Fig. 8
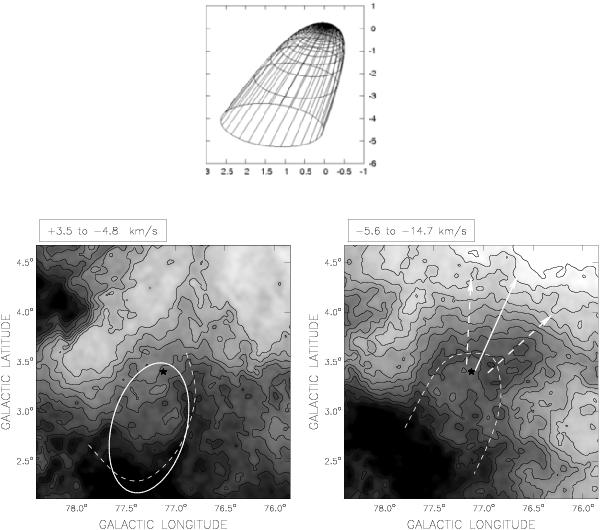
H i temperature brightness emission distribution from +3.5 to –4.8 km s-1 (lower left panel) and from –5.6 to –14.7 km s-1 (lower right panel). The stellar position is marked by a star symbol. A constant mean brightness temperature value was subtracted from each image (see text). The direction of the nominal peculiar stellar proper motion is shown by a solid arrow, while ± 1σ directions are shown by dashed arrows (lower right panel). In both lower panels the outer border of the bow shock is indicated by a dashed curve. In the lower left panel the ellipse depicts the bow shock cross section at a distance of 1 pc downstream from the stellar position. The upper panel shows the 3D bow shock structure orientation as it would appear to an external observer (see text). The star is located at the (0, 0) position.
Current usage metrics show cumulative count of Article Views (full-text article views including HTML views, PDF and ePub downloads, according to the available data) and Abstracts Views on Vision4Press platform.
Data correspond to usage on the plateform after 2015. The current usage metrics is available 48-96 hours after online publication and is updated daily on week days.
Initial download of the metrics may take a while.