Fig. 5
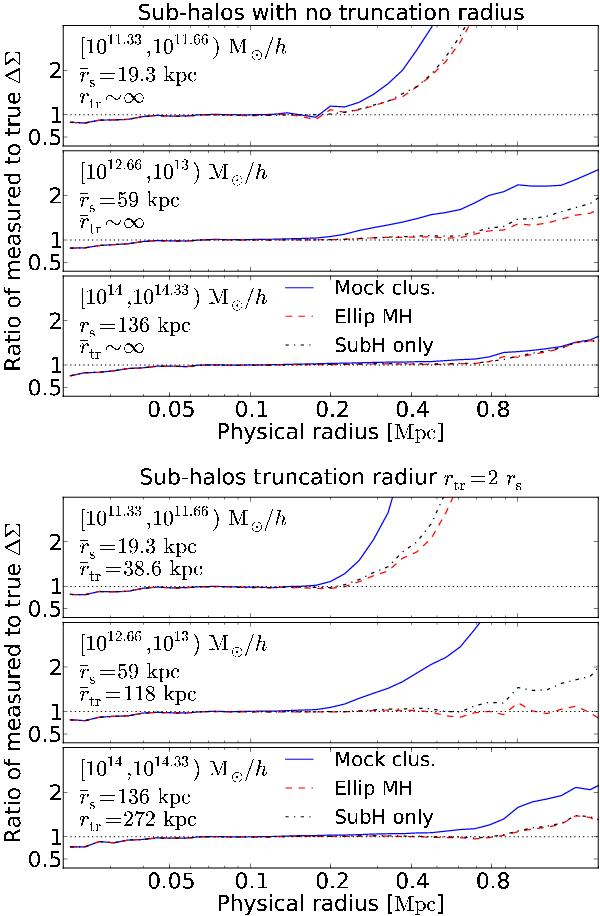
Results from mock clusters. Ratio of the measured ΔΣ(ξ) to the one we input using GGLC, versus the projected physical radius ξ. Top: non-truncated NFWs. Bottom: rtr = 2 rs. We plot only the results for a selection of mass bins, the mass ranges are given. Black dotted-dashed lines: no main halo was added. Red dashed lines: clusters with an elliptical main halo. Blue solid lines: clusters with a non-elliptical main halo. The dotted black line, where the ratio is one, is a visual reference.
Current usage metrics show cumulative count of Article Views (full-text article views including HTML views, PDF and ePub downloads, according to the available data) and Abstracts Views on Vision4Press platform.
Data correspond to usage on the plateform after 2015. The current usage metrics is available 48-96 hours after online publication and is updated daily on week days.
Initial download of the metrics may take a while.