Fig. 20
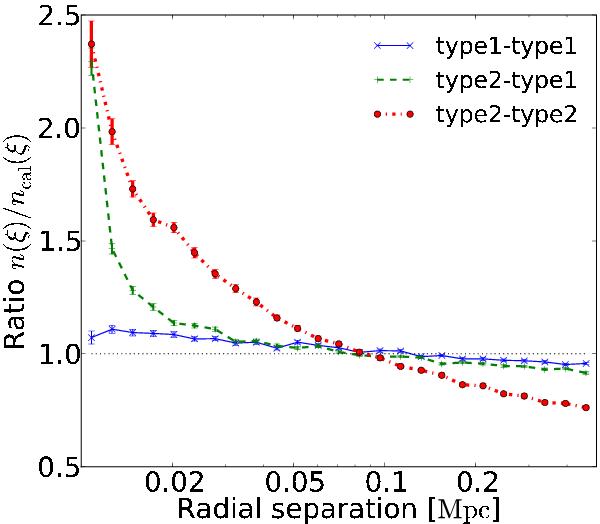
Ratio between the galaxy number density around a galaxy and around its corresponding calibration point, as a function of distance. We also plot as visual reference the line where the ratio is 1. Dotted-dashed red: excess type-2 number density around type-2. Solid blue: type-1 number density around type-1. Green dashed: excess type-1 number density around type-2. dM − S > 0.5 Mpc.
Current usage metrics show cumulative count of Article Views (full-text article views including HTML views, PDF and ePub downloads, according to the available data) and Abstracts Views on Vision4Press platform.
Data correspond to usage on the plateform after 2015. The current usage metrics is available 48-96 hours after online publication and is updated daily on week days.
Initial download of the metrics may take a while.