Fig. 2
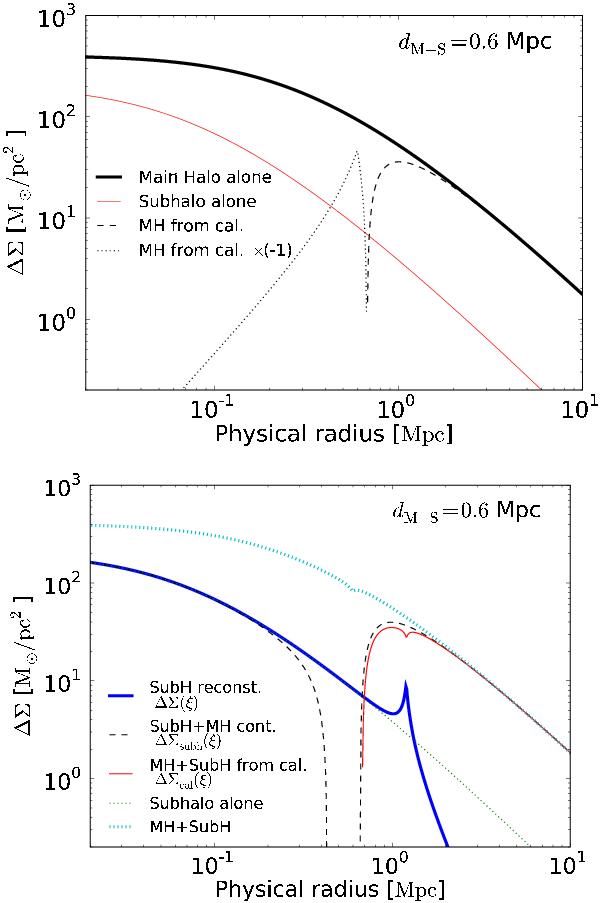
Galaxy-galaxy lensing signals of cluster main halo and subhalo (assuming NFW profiles). The subhalo is at 0.6 Mpc from the cluster center. Top panel: the subhalo around the subhalo center (thin solid red line), the main halo around the main halo center (thick solid black line), and the main halo around the calibration point (dashed/dotted line for positive/negative part). Bottom panel: the subhalo around the subhalo center (thin dotted green line), the subhalo plus main halo around the subhalo center (black dashed line), the subhalo plus main halo around the main halo center (cyan dotted line), the subhalo plus main halo around the calibration point (red solid line), and the reconstructed subhalo (blue thick solid line).
Current usage metrics show cumulative count of Article Views (full-text article views including HTML views, PDF and ePub downloads, according to the available data) and Abstracts Views on Vision4Press platform.
Data correspond to usage on the plateform after 2015. The current usage metrics is available 48-96 hours after online publication and is updated daily on week days.
Initial download of the metrics may take a while.