Fig. 19
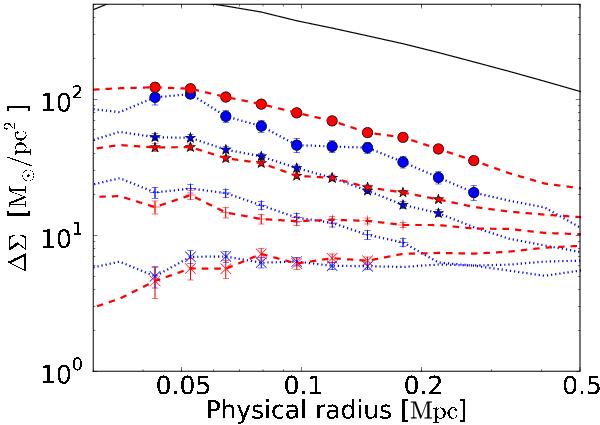
Morphology-stellar mass classification for a LSST-like survey including both type-1 and type-2 galaxies. Blue dotted lines correspond to galaxies with a relatively small bulge, red dashed to those with a large bulge. The different symbols distinguish different stellar mass bins. The range where we assume the measurement has a bias below 10% is highlighted (derived using our results from the type-1 only profiles). The classification ranges are described in the top table in Fig. 17. The black solid line is the measurement for the host cluster shown for visual reference.
Current usage metrics show cumulative count of Article Views (full-text article views including HTML views, PDF and ePub downloads, according to the available data) and Abstracts Views on Vision4Press platform.
Data correspond to usage on the plateform after 2015. The current usage metrics is available 48-96 hours after online publication and is updated daily on week days.
Initial download of the metrics may take a while.