Fig. 18
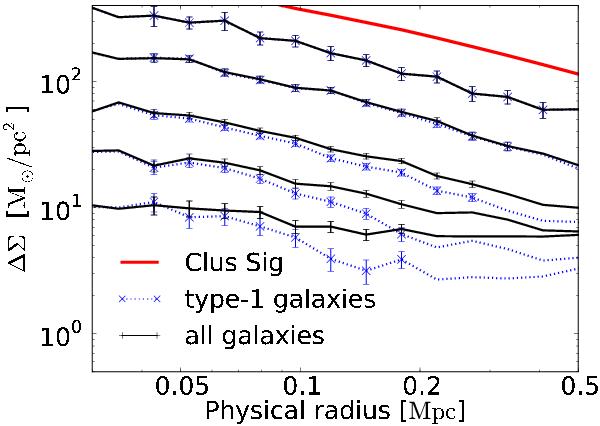
Excess surface mass density ΔΣ(ξ) for a few luminosity bins for an LSST-like survey. The blue dashed lines correspond to the measurements only for type-1 galaxies. The solid black lines correspond to the combination of both type-1 and type-2 galaxies. The range where we assume the measurement has a bias below 10% is highlighted (derived using our results for type-1 only profiles). The solid thick red line is the signal for the average cluster, shown for visual reference.
Current usage metrics show cumulative count of Article Views (full-text article views including HTML views, PDF and ePub downloads, according to the available data) and Abstracts Views on Vision4Press platform.
Data correspond to usage on the plateform after 2015. The current usage metrics is available 48-96 hours after online publication and is updated daily on week days.
Initial download of the metrics may take a while.