Fig. 17
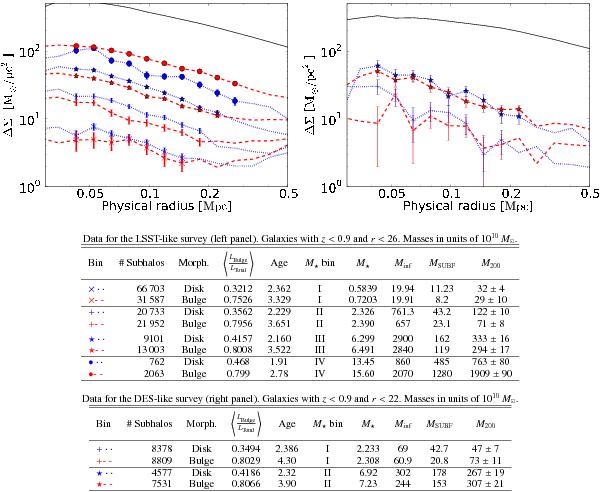
Morphology-stellar mass classification for a LSST-like survey (left panel) and for a DES-like survey (right panel). The black solid line is the measurement for the host cluster shown for visual reference. We only plot symbols and error bars for the range where we consider that the bias is below 10%. The subhalos are at dM − S > 0.5 Mpc. Blue dotted lines correspond to galaxies with a relatively small bulge: Disk → 0 < LBulge/LTotal ≤ 0.6. Red dashed lines correspond to galaxies with a large bulge which spent more time inside a cluster: Bulge → 0.6 < LBulge/LTotal < 0.98. The different symbols distinguish different stellar mass bins (in units of 1010 M⊙). For the left panel the ranges are: 1 → [0.14:1.4 ] , II → [1.4:4.11 ] , III → [4.11:10.96 ] , 4 → [10.96:∞ ] . For the right panel the ranges are I → [1.1:4.1 ] , II → [4.1:13.7 ] .
Current usage metrics show cumulative count of Article Views (full-text article views including HTML views, PDF and ePub downloads, according to the available data) and Abstracts Views on Vision4Press platform.
Data correspond to usage on the plateform after 2015. The current usage metrics is available 48-96 hours after online publication and is updated daily on week days.
Initial download of the metrics may take a while.