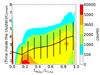
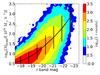
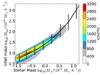
Fig. 12
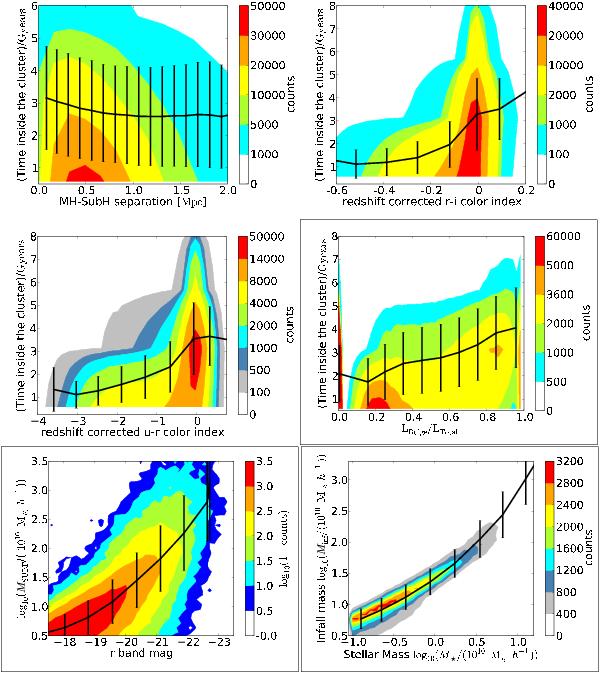
Relations between physical subhalo properties (vertical axis) and observable proxies (horizontal axis). With black frames, we outline those finally used. Contours give the full distribution; we overplot the mean value of each subhalo property and its standard deviation for each bin in the observable (curves with error bars). Top left: age of the subhalo versus the projected radial separation of the subhalo from the main halo center. Top right: age of the subhalo versus redshift-corrected r − i. Middle left: age of the subhalo versus redshift-corrected u − r. See text for a description of the redshift correction. Middle right: age of the subhalo versus our morphology estimator. Bottom left: MSUBF versus absolute r band magnitude. Bottom right: Minf versus stellar mass (using results from Wang et al. 2006). Note that the contour levels differ between the panels.
Current usage metrics show cumulative count of Article Views (full-text article views including HTML views, PDF and ePub downloads, according to the available data) and Abstracts Views on Vision4Press platform.
Data correspond to usage on the plateform after 2015. The current usage metrics is available 48-96 hours after online publication and is updated daily on week days.
Initial download of the metrics may take a while.