Fig. 11
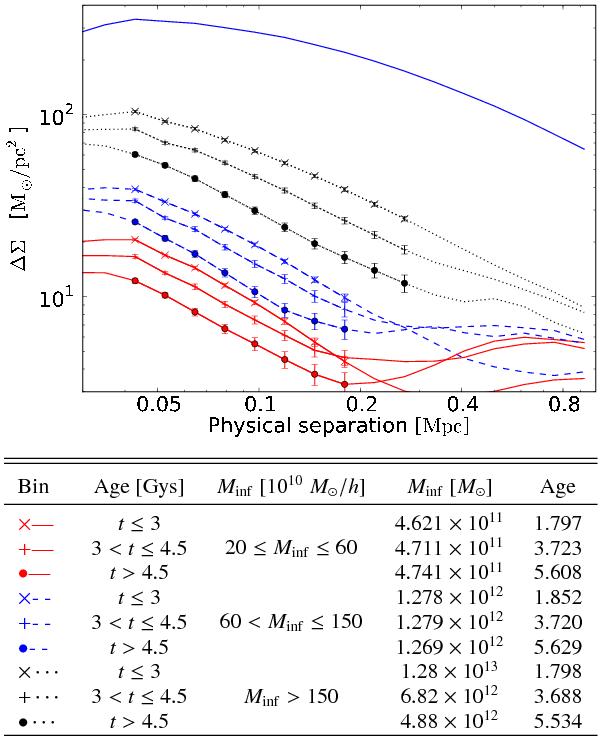
Profiles for different infall mass and time spend inside the cluster: with error bars the regions where the bias is below 10%. The color and the line type are the same for samples selected from the same infall mass range. The symbols are the same for samples defined from the same age bin. In solid blue we plot the average signal for the host cluster as a visual reference. In the table the ranges used for the binning and the average value for each sub-sample.
Current usage metrics show cumulative count of Article Views (full-text article views including HTML views, PDF and ePub downloads, according to the available data) and Abstracts Views on Vision4Press platform.
Data correspond to usage on the plateform after 2015. The current usage metrics is available 48-96 hours after online publication and is updated daily on week days.
Initial download of the metrics may take a while.