| Issue |
A&A
Volume 531, July 2011
|
|
|---|---|---|
| Article Number | A84 | |
| Number of page(s) | 11 | |
| Section | Interstellar and circumstellar matter | |
| DOI | https://doi.org/10.1051/0004-6361/201016091 | |
| Published online | 17 June 2011 | |
A low optical depth region in the inner disk of the Herbig Ae star HR 5999⋆,⋆⋆
1
INAF – Osservatorio Astrofisico di Arcetri, Largo E. Fermi 5,
50125
Firenze,
Italy
2
Max Planck Institut für Astronomie, Konigstühl 17, 69117
Heidelberg,
Germany
e-mail: benisty@mpia.de
3
Laboratoire d’Astrophysique de Grenoble, CNRS-UJF UMR 5571,
414 rue de la Piscine, 38400 St
Martin d’Hères,
France
4
European Southern Observatory, Casilla 19001, Santiago 19, Chile
5
Universidade do Porto, Faculdade de Engenharia, SIM Unidade FCT 4006, Rua Dr. Roberto Frias, s/n
P-4200-465
Porto,
Portugal
6
Caltech, MC 249-17, 1200 East California Blvd,
Pasadena,
CA
91125,
USA
7
European Southern Observatory, Karl-Schwarzschild-Strasse 2, 85748
Garching,
Germany
8
Centre de Recherche Astrophysique de Lyon, CNRS-UCBL-ENSL UMR5574,
69561
St Genis Laval,
France
9
Laboratoire A. H. Fizeau, UMR 6525, Université de Nice-Sophia
Antipolis, Parc
Valrose, 06108
Nice Cedex 02,
France
10
Max Planck Institut für Radioastronomie,
Auf dem Hügel 69,
53121
Bonn,
Germany
Received: 6 November 2010
Accepted: 8 April 2011
Context. Circumstellar disks surrounding young stars are known to be the birthplaces of planetary systems, and the innermost astronomical unit is of particular interest. Near-infrared interferometric studies have revealed a complex morphology for the close environment surrounding Herbig Ae stars.
Aims. We present new long-baseline spectro-interferometric observations of the Herbig Ae star, HR 5999, obtained in the H and K bands with the AMBER instrument at the VLTI, and aim to produce near-infrared images at the sub-AU spatial scale.
Methods. We spatially resolve the circumstellar material and reconstruct images in the H and K bands using the MiRA algorithm. In addition, we interpret the interferometric observations using models that assume that the near-infrared excess is dominated by the emission of a circumstellar disk. We compare the images reconstructed from the VLTI measurements to images obtained using simulated model data.
Results. The K-band image reveals three main elements: a ring-like feature located at ~0.65 AU, a low surface brightness region inside 0.65 AU, and a central spot. At the maximum angular resolution of our observations (B/λ ~ 1.3 mas), the ring is resolved while the central spot is only marginally resolved, preventing us from revealing the exact morphology of the circumstellar environment. We suggest that the ring traces silicate condensation, i.e., an opacity change, in a circumstellar disk around HR 5999. We build a model that includes a ring at the silicate sublimation radius and an inner disk of low surface brightness responsible for a large amount of the near-infrared continuum emission. The model successfully fits the SED, visibilities, and closure phases in the H and K bands, and provides evidence of a low surface brightness region inside the silicate sublimation radius.
Conclusions. This study provides milli-arcsecond resolution images of the environment of HR 5999 and additional evidence that in Herbig Ae stars, there is material in a low surface brightness region, probably a low optical depth region, located inside the silicate sublimation radius and of unknown nature. The possibility that the formation of such a region in a thick disk is related to disk evolution should be investigated.
Key words: methods: observational / circumstellar matter / stars: pre-main sequence / stars: variables: T Tauri, Herbig Ae/Be / techniques: interferometric
Based on observations collected at the VLTI (ESO Paranal, Chile) with programs 080.C-0056, 083.C-0298, 083.C-0144, 083.C-0334, 083.C-0170, 083.C-0857, 083.C-0864, 083.C-0602, 084.C-0590, 085.C-0769, 085.C-0502.
Appendix A is available in electronic form at http://www.aanda.org
© ESO, 2011
1. Introduction
Circumstellar disks surrounding young stars are known to be the birthplaces of planetary systems. To understand planet formation, it is crucial to study the physical conditions in the disks in which they form, and the processes that control the evolution of gas and dust. The innermost astronomical unit (AU) is of particular interest because star-disk interactions, such as mass accretion and ejection, occur there. In the past decade, near-infrared (NIR) long-baseline interferometry has allowed us to directly probe matter within the first AU. The first interferometric studies of intermediate-mass young stars, the Herbig AeBe stars (HAeBe), have shown that the characteristic sizes of the emission in the NIR were larger than expected with classical accretion disk models (Millan-Gabet et al. 2001), and were found to be correlated with the stellar luminosity (Monnier & Millan-Gabet 2002). This supports the idea that the NIR emission is dominated by the thermal emission of hot dust heated by stellar radiation. Natta et al. (2001) suggested that an inner, optically thin cavity due to dust sublimation exists in the disk. At the edge of this region, where dust condensates, the disk is expected to puff up because of direct illumination from the star (Dullemond et al. 2001; Isella & Natta 2005; Tannirkulam et al. 2007; Kama et al. 2009), explaining the size-luminosity law derived for Herbig Ae (and late Be) stars by Monnier & Millan-Gabet (2002). On the basis of a small number of interferometric observations, simple geometrical models were proposed to explain the global morphology of these regions (e.g., Eisner et al. 2004; Monnier et al. 2005).
However, as higher quality data sets have become available, it has become clear that the regions probed by NIR interferometry are much more complex and that a deeper understanding requires the combination of photometric and multi-wavelength interferometric measurements together with more sophisticated models. Using the very long CHARA baselines, Tannirkulam et al. (2008) found that the K-band observations at the milli-arcsecond (mas) resolution of the Herbig Ae star HD 163296 could not be reproduced using models where the majority of the K-band emission arises in a dust rim, but that an additional NIR emission inside the dust sublimation radius was needed to explain the visibilities and the SED. They interpreted this additional emission as being produced by gas, as suggested for other Herbig AeBe stars when using spectro-interferometry (e.g., Eisner et al. 2007; Isella et al. 2008; Kraus et al. 2008). Using the largest interferometric dataset so far, Benisty et al. (2010) suggested an alternative scenario for HD 163296 of an optically thin inner disk, made of refractory grains such as iron up to 0.5 AU, as the major source of the NIR emission in HD 163296.
With the advent of interferometers with more than two telescopes and of significantly high spectral and spatial resolution (e.g., VLTI/AMBER, CHARA/MIRC), the number of interferometric observations has significantly increased allowing the first images to be reconstructed with aperture synthesis techniques. Images of stellar surfaces (e.g., Haubois et al. 2009), binaries (e.g., Zhao et al. 2008), and circumstellar shells around evolved stars (e.g., Le Bouquin et al. 2009) have been obtained. Two circumstellar disks have been imaged, around an intermediate-mass young star (Renard et al. 2010) and around a massive young star (Kraus et al. 2010).
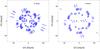 |
Fig. 1 UV coverage obtained in the K-band (left) and in the H-band (right). |
In this study, we present NIR images and an analysis of the inner environment surrounding the Herbig Ae star HR 5999 (V856 Sco, HD 144668). The star lies in the Lupus star formation complex, at a distance of 208 pc. It is part of a quadruple system, its closest detected companion (Rossiter 3930; ΔV,H,K = 4.6, 3.1, 3.6 mag, Stecklum et al. 1995) being at 1.4′′. HR 5999 was identified as a 3−4 M⊙ star, that is ~0.5 Myr old, with a A7 III-IV spectral type (Tjin A Djie et al. 1989), Teff = 7925 K, L = 87 L⊙ (van Boekel et al. 2005), and Av = 0.49 mag. Photometric and spectroscopic variability was observed in the optical (Perez et al. 1992) and UV (Perez et al. 1993) and interpreted as evidence of accreting gas in a boundary layer in a highly inclined disk. Hubrig et al. (2007) detected a magnetic field, which was found to be variable, with a strength varying between −75 G and +166 G, possibly related to the spectroscopic variations. Its spectral energy distribution (SED) presents strong near and mid-infrared (MIR) excesses (Hillenbrand et al. 1992), as well as a weak emission at millimetric wavelengths (Henning et al. 1994). This indicates that a circumstellar disk is present, which is probably of low mass (0.006 M⊙; Siebenmorgen et al. 2000). Grady et al. (2005) found no indication of a nebulosity at radii larger than 70 AU, which was later confirmed by MIR spatially resolved observations (Preibisch et al. 2006). The MIDI/VLTI measurements indicated an angular extent of the MIR emission smaller than that of other HAeBes, and were consistent with an inclined disk (i ~ 58°, PA ~ 115°), truncated at an outer radius of 2.5 AU. The authors speculated that the low mass and the small outer radius of the disk are probably caused by mechanisms of dynamic clearing by a close binary. In addition, Rodrigues et al. (2009) measured an intrinsic linear polarization, due to scattering of the stellar light off circumstellar material along PA ~ 137°, in agreement with the PA of the disk measured by Preibisch et al. (2006).
Very little is known about the structure and morphology of the circumstellar disk in the first AU, as no spatially resolved observations have so far been published on the NIR emission. Here, we present the first observational study of the circumstellar disk around HR 5999 at the sub-AU scale using the AMBER/VLTI. We gathered a large number of measurements in the H and K bands from 2008 to 2010, and present here the first reconstructed images of HR 5999, as well as a qualitative model to account for the interferometric measurements.
The article is organized as follow. Section 2 describes the observations, the data processing and the image reconstruction method. Section 3 presents the reconstructed images obtained in the H and K bands, and Sect. 4 provides a temptative disk model. In Sect. 5, we discuss our results and conclude.
2. Observations and data processing
2.1. AMBER measurements
We observed HR 5999 between February 2008 and June 2010, during fourteen nights. We used the near-infrared instrument AMBER, located at the Very Large Telescope Interferometer (VLTI; Schöller 2007). AMBER enables the simultaneous combination of three beams in the H (1.69−1.73 μm) and K bands (2.0−2.4 μm), with a spectral resolution up to ~12 000 (Petrov et al. 2007). In the following, we present measurements obtained with the low spectral resolution mode (λ/Δλ ~ 35). The data were obtained within programs of Guaranteed Time. We performed these observations using the relocatable 1.8 m auxiliary telescopes (ATs) in seven different configurations, sampling a large range of baseline position angles and providing an excellent UV coverage. The longest baseline is ~128 m corresponding to a maximum angular resolution B/λ of 1.3 mas. A summary of the observations presented in this paper is given in Table A.1. Each measurement for HR 5999 was encircled by observations of a calibrator targets (HD 136014, HD 123004, HD 145921, HD 137730) to measure the instrumental transfer function and correct for instrumental effects. About 20% of the observations were performed using the fringe-tracker FINITO (Le Bouquin et al. 2008).
The data reduction was performed following standard procedures described in Tatulli et al. (2007) and Chelli et al. (2009), using the amdlib package, release 2.99, and the yorick interface provided by the Jean-Marie Mariotti Center1. Raw spectral visibilities, differential phases, and closure phases were extracted for all the frames of each observing file. A selection of 20% of the highest quality frames was made to enhance the signal-to-noise ratio. The transfer function was obtained by averaging the calibrator measurements, after correcting for their instrinsic diameters. In general, the H band data have a lower signal-to-noise ratio than K-band due to lower flux and instrumental transmission. Consequently, no H-band data could be retrieved during four nights (2009-04-08, 2010-06-07, 2010-04-10, 2010-03-21). The closest detected companion (Rossiter 3930 at 1.4′′) is outside the field of view of the ATs (~300 mas), and does not impact our measurements.
The total dataset covers observations over more than two years, and consists of 1014 and 338 K-band visibilities and closure phases, respectively, as well as 498 and 166 H-band visibilities and closure phases, respectively. The calibrated data in the OI-FITS format (Pauls et al. 2005) are available upon request. Figure 1 gives the resulting UV coverages. The processed visibilities and closure phases are presented in Figs. A.1 and A.3. A large scatter in the data can be seen, in particular in the visibilities, that is not only due to the fact that we sample the object with different baseline position angles (details are given in Sect. 4).
2.2. Image reconstruction process
According to the Van Cittert-Zernicke theorem, the complex visibility, V ei φ, is the Fourier transform of the object brightness distribution at the spatial frequency of the observations (B/λ; where B is the baseline and λ the wavelength). The visibility amplitude, V, is related to the spatial extent of the emission, and the phase, φ, to the location of the photocenter. However, the absolute value of the phase is lost because of random atmospheric perturbations. By adding the phases of the fringes measured for each baseline over a 3-telescope configuration, one can measure the closure phase, which is insensitive to atmospheric disturbances (Jennison 1958; Monnier 2003). The closure phase includes part of the Fourier phase information, and is related to the global asymmetry of the emission: a point-symmetric object has a zero closure phase. The main observables are therefore the squared visibility amplitudes, V2, and the closure phases (CP). The goal of the image reconstruction is to numerically retrieve an approximation of the true brightness distribution of the source given a set of V2 and CP. To account for the data, the Fourier transform of the image should fit the measurements. However, because of the sparse UV coverage, the image reconstruction problem is ill-posed as there are more unknowns than measurements. Additional constraints are therefore required to supplement the available data and retrieve a unique and stable solution. In this paper, we use the Multi-aperture image Reconstruction Algorithm (MiRA; by Thiébaut 2008). The solution is normalized and positive and the code finds the closest agreement between the image and the data, favoring e.g., the simplest or the smoothest image (Thiébaut & Giovannelli 2010). For this work, we tested three different regularizations (so-called “total variation”, “MEM” (for maximum entropy method), and “compactness”) that led to very similar results. In the following, we show images obtained with the “total variation” regularization that minimizes the norm of the image gradient and favors areas with steep but localized changes (Strong & Chan 2003). For more details of the image reconstruction process, we refer the reader to Renard et al. (2010) and Renard et al. (2011). We used a 150 × 150 grid, with a scale of 0.2 mas/pixel, and the V2 and CP have a weight inversely proportional to their individual error. All spectral channels were combined to maximize the UV coverage and we obtained two polychromatic images, for the H-band and the K-band, assuming a grey emission within each filter.
3. Reconstructed images
We present in Fig. 2 the resulting image in the K band. The interferometric beam is shown in the lower right corners, and is defined as the maximum angular resolution along the U and V axis (1.8 mas × 2.3 mas in the K band and 1.6 mas × 1.8 mas in the H band). Using MiRA (or a similar fitting procedure), one can retrieve spatial information at about half the maximum angular resolution of the interferometer (performing the so-called “super-resolution”). The reconstructed image resolves the inner environment around HR 5999, and reveals several features. The “blobby” aspect of the image is probably due to the incomplete UV coverage.
The K-band image gives indications of a bright spot at the center and an elongated structure in a ring-like shape. The central spot is ~1.8 mas wide, i.e., about our limit in resolution. Using an ellipse to describe the ring-like structure, we find a major axis at the inner edge of ~5.5−6 mas (i.e., at a distance of 210 pc, ~1.15−1.26 AU), a ratio [width/inner radius] of ~25%, an inclination of ~40−50°, and an orientation of the long axis along PA ~ 130−140°. It provides ~33−38% of the total flux in the image (depending on the regularization), while the large central spot contributes to the rest. Between these two main features, the image reveals low or zero emission. We interpret the elongated structure as the disk emission. The central spot is interpreted as the image of the star (of diameter ~0.2 mas), and possibly of additional unresolved or partially resolved circumstellar material (~1 to 2 mas wide).
The H-band emission is more compact than the K-band emission, and the image is of quite low quality because the observations obtained are of much lower signal-to-noise ratio. The image consists of two blobs (separated by 3.8 mas, which we interpret as tracing the elongated structure seen in the K-band image, i.e., a disk) and a central spot (~1.8 mas wide). These features have sizes about or slightly smaller than the maximum angular resolution, and while the separation between the two blobs is resolved at this resolution, the global H-band emission is only marginally resolved by our observations. In this case, the reconstructed image provides only partial information (Lachaume 2003), such as the orientation of the bulk of the emission, but cannot reproduce the structure of the circumstellar material emitting in the H band. The large error bars in the H-band data lead to a much smaller dynamical range, probably preventing the ring to appear in the image. Finally, the chromaticity of the emission in the H-band has a strong impact on the visibility (with a clear increase with B/λ, across the spectral channels of an observation; Fig. A.2). Considering these caveats, the H-band image provides little reliable physical information, and will not be discussed further.
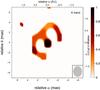 |
Fig. 2 Reconstructed image in the K band. The interferometric beam (defined as the maximum angular resolution) is given in the lower right corner. The image is shown on a 14 mas × 14 mas scale. The H band image (not shown) brings little reliable information. |
Considering the incomplete UV coverage, the limited angular resolution, the large uncertainties, and the scatter in the observations, great caution is required when interpreting the K-band image. Interpreting the exhibited details but also the hidden features in these images is not straightforward, as the reconstruction process produces artefacts. We performed numerous tests to understand this issue. Our tests show that the images depend on the availability and precision of measurements at high spatial frequency (i.e., at long baselines), and whether these measurements have a high enough angular resolution to discriminate, e.g., a ring from a uniform disk.
The ring in the K-band image (~6 mas wide) is resolved at the angular resolution of our measurements, and its appearance is systematic in all the tests we performed with different regularizations. On the other hand, the central spot has a size similar to the maximum angular resolution achieved with our observations, and is only marginally resolved. The exact morphology of this emission can therefore not be determined by the image. The combination of the different features leads to a complex visibility curve that depends on their morphology but also on their relative flux contributions. In addition, possible incorrect calibration of the absolute visibility as well as the chromaticity of the emission (that we consider grey within each band for the image reconstruction) can produce an additional scatter (up to 5−10%), adding complexity to the visibility curve. However, the ring is encoded in the differential visibilities (corresponding to different spatial frequencies) that are not affected by any calibration issue as well as in the closure phases and in the observations at very long baselines that are well-accounted for by MiRA. Given the large amount of data, the ring is systematically retrieved in the reconstructed images. Figures A.4, A.5 show the best-fit to the K-band observations obtained with MiRA ( ;
;  ), and corresponding to the reconstructed image in Fig. 2. One can see that some of the scatter in the observations is well reproduced indicating a complex structure resulting from a combination of resolved features (such as the ring) and marginally-resolved features (such as the central spot).
We must also consider the sensitivity of the image reconstruction algorithm to a low brightness surface such as the one inside the ring-like feature, a common feature of theses images. The scatter in the measurements at a given spatial frequency has the consequence of lowering the signal-to-noise ratio (since at a given spatial frequency, different values of the visibilities and CP have to be reproduced for a single image value) and producing a lower dynamical range. In practice, this decreases our capability of detecting low surface brightness emission, and favors sharp transitions in the image. On the other hand, if HR 5999 were surrounded by a uniform disk, the reconstructed image would have shown an elongated disk-like structure and not a ring-like feature. It is therefore likely that HR 5999 disk displays a strong change in the surface brightness within the first AU.
To more clearly understand the image and avoid over-interpretation, we attempt to apply a fitting procedure to the V2 and CP based on disk models that we develop in the next section.
4. Disk model
The main features seen in the images of HR 5999, i.e., a star, a disk, and a lower surface brightness inner region resemble the observed properties of the circumstellar matter around other Herbig Ae stars (e.g., Isella et al. 2008; Eisner et al. 2009; Benisty et al. 2010). To understand the images, we propose a disk model that qualitatively reproduces the observations.
As shown in Figs. A.1, A.2, the squared visibilities smoothly decrease with the baseline length, and reach values of ~7% (in K) and ~17% (in H) for the longest baseline. The closure phases (Fig. A.3) are close to zero when measured with short-baseline configurations, and increase up to ~20° for long-baseline configurations. Both visibilities and closure phases change with the baseline position angle and hour angle of the observations.
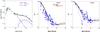 |
Fig. 3 The black curves give the predictions of the two-component disk model for the SED (left), the broad-band visibilities in the K-band (middle) and in the H-band (right). The visibilities predicted by the puffed-up rim model are added (red dashed curves). In both cases, the visibilities curves are shown along two perpendicular baseline position angles, against effective spatial frequency (computed with i = 48° and PA = 135°). See the text for more details on the effective baselines Beff, and note that their values are smaller than the physical baseline lengths given in Figs. A.1 and A.4. |
4.1. Spectral energy distribution
Photometric measurements were gathered in the literature (2MASS; Hillenbrand et al. 1992; de Winter et al. 2001), enabling us to construct a SED (Fig. 3, left). Using a Kurucz model for a A5 photosphere at Teff = 8000 K and Av = 0.49, we find a stellar contribution to the K and H fluxes of ~22% and ~40%, respectively. The adaptive optics study by Stecklum et al. (1995) showed that the flux of the companion, Rossiter 3930, is much smaller than HR 5999 up to NIR wavelengths (i.e., ΔH,K = 3.1, 3.6 mag), and can be neglected in the following.
4.2. Models
A uniform ring?
We first fitted geometric models to our visibilities to estimate the main characteristics of the NIR emission and check whether they are consistent with the image features. We used a uniform ring model, with a ratio of width to inner radius of ~20% to account for the emission of the inner parts of a circumstellar disk. In the K-band, we find that the best fits are achieved with an inner diameter of θ = 4.4 ± 0.2 mas (i.e., an inner radius of ~0.45 AU), an inclination of i = 48 ± 11°, and an orientation of PA = 116 ± 11°. In the H-band, the best-fit models give θ =  mas, i =
  °, and PA =
  °. These models provide an unsatisfactory fit to the V2, with large values of reduced χ2, which probably reflects the more complex circumstellar environment and is possibly caused by the large scatter in the visibilities. Their predictions however give values of i and PA that agree with MIR (i = 58°, PA = 115°; Preibisch et al. 2006) and polarimetric measurements (PA = 137.2°; Rodrigues et al. 2009), and with the NIR reconstructed images.
A puffed up rim?
Early NIR interferometric studies of Herbig Ae stars have shown that standard accretion disks, extending up to the dust sublimation radius do not fit the observations and that better fits are obtained assuming that the disk develops a curved rim controlled by dust sublimation and its dependence on gas density (Isella & Natta 2005; Tannirkulam et al. 2007). The detection of non-zero closure phases supports the idea that an asymmetric brightness distribution – possibly a disk inner rim – contributes to the NIR emission. We therefore started by examining a “star + puffed-up rim” to model our observations, following Isella & Natta (2005). We adopt the stellar properties d = 210 pc, L = 87 L⊙, Teff = 7925 K and Av = 0.49 mag. The disk is assumed to be in hydrostatic equilibrium. The dust consists of silicates with optical properties given by Weingartner & Draine (2001). The evaporation temperature, around 1500 K, depends on the local gas density as in Pollack et al. (1994). Since the shape of the rim is controlled by the largest grains, we consider a single size for the silicate dust, which therefore is the only free parameter in the model. The dependence of the evaporation temperature on z implies that the distance from the star at which dust evaporates increases with the altitude, i.e., that the rim is curved.
We find that our measurements are inconsistent with a rim only, regardless of its location. Using 1-micron large silicate grains with a high cooling efficiency, we find that they sublimate at 1486 K at a radius of ~0.65 AU. With an inclination of 48° and a PA of 135°, the rim accounts for ~62% and ~41% of the K-band and H-band fluxes, respectively, and a sharp visibility profile with baseline that is inconsistent with our observations. We show in Fig. 3, middle and right panels, the broad-band visibilities in the K and H bands respectively, against the effective spatial frequency Beff/λ. The broad-band visibilities were obtained by averaging the visibilities over the available spectral range. The effective baseline Beff is defined following Tannirkulam et al. (2008) as 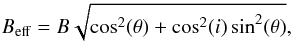 where θ is the angle between the baseline direction and the major axis of the disk, and i is the disk inclination. This representation is useful to show a large dataset in a concise way once the inclination and position angle of the disk are known, as effective baselines account for the decrease in interferometric resolution due to the inclination of the disk in the sky. We note that Beff ≤ B. Following Tannirkulam et al. (2008), a model-independent estimate of the disk inclination and position angle can be retrieved by minimizing the variance of the observed visibility curve at a given baseline length. Using this method, we find that i = 52 ± 11° and PA = 143 ± 11°. Considering the large error bars, in the following, we assume that i = 48° and PA = 135°. As it can be seen in the red dashed curves, the rim model with an inclination of 48° and a PA of 135° cannot reproduce the H and K-band visibility measurements, and results in closure phases that are much higher than observed (up to ~60°). This indicates that the actual level of asymmetry is lower than the one predicted by a puffed-up rim at 48° of inclination, and that the bulks of the H and of the K-band emissions are unlikely to originate in the same physical region.
The model of a rim of dust grains directly irradiated by the star cannot fit our data. However, we find that, for various dust grain properties, the silicate sublimation occurs around ~0.65 AU, a distance similar to the sharp transition in surface brightness seen in the K-band image. We therefore interpret the ring-like feature in the K-band image as tracing the emission from dust at ~1500 K, i.e., at the transition radius where silicate condensate.
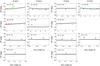 |
Fig. 4 The black curves give the predictions of the two-component disk model for the broad-band closure phases in the K-band (left columns) and in the H-band (right columns). Each panel corresponds to a different telescope configuration, and the color code is the one of Figs. A.1 and A.3. |
 |
Fig. 5 The K-band image is shown, as reconstructed from the AMBER measurements (left), and as reconstructed from the simulated data from the model (middle). The latter is shown in the right panel. The images are shown on a 10 mas × 10 mas scale. |
A two-component disk?
The previous simple models suggest that the H-band emission is more compact than the K-band emission, and indicate that there is material located inside the silicate sublimation radius, as already found in other Herbig Ae stars. Assuming that the ring-like feature in the K-band image is related to silicate sublimation, we compose a model made of three elements: a star, a ring at the silicate sublimation radius, and an inner disk. This inner and compact emission is expected to modify the shape of the visibility curves and to smooth the closure phases predicted by a very asymmetric component such as the puffed-up rim. In this section, we attempt to derive the main characteristics of these three components, i.e., their extents and contributions to the NIR emission.
Since it is unclear whether a rim would puff up in the way computed in Isella & Natta (2005) if inside matter is blocking part of the stellar emission, we refer to the inner edge of the dusty disk as ring instead of rim. Determining its exact structure is beyond the scope of this paper. This ring traces dust condensation and provides some asymmetric emission, as indicated by the non-zero closure phases. We compute its emission using the rim model at Rsub = 0.65 AU, but where its luminosity is treated as a free parameter to enable SED fitting with an additional inner component. We describe the inner disk using a radial temperature profile T ∝ r−α as expected in a circumstellar disk, and a vertical optical depth τ.
We find an acceptable fit to the SED, the visibilities, and the closure phases in the H and K bands using a model where the inner disk extends from Rin = 0.1 AU to Rsub, with Tin = 2400 K, α = 0.4, and a vertical optical depth τ ~ 0.4. In this model, the ring contributes 40% of the K-band flux, while the inner disk provides 38% of it. In the H-band, the ring is responsible for 26% of the emission, the inner disk for 34%, leaving the star as the major contributor at 1.6 μm. The parameters of the model are summarized in Table 1. We show in Figs. 3 and 4 the model predictions for the SED, the broad-band visibilities and closure phases (full black lines). By spreading the NIR emission across a broader range of radii (compared to the puffed-up rim), i.e., from Rsub to Rin, the shape of the visibility-versus-baseline curve is well reproduced and the high closure phases predicted by the model of the puffed-up rim are smoothed out, resulting in values close to the observations (from 0 to 20°). A temperature gradient within the inner disk is needed to reproduce both the H and K band visibilities together, as a single temperature disk at a specific τ cannot. The model is shown in Fig. 5, right. Considering the large scatter in the observations, we do not claim the uniqueness of the parameters of our model (τ, Tin, α), although they provide a qualitatively good fit to the observations, and the extents and flux ratio of each component are well constrained and in agreement with the images.
Parameters of our model with inner disk between Rin and Rsub, where silicates sublimate.
4.3. Model image
Our model produces a strong variation in surface brightness in the first AU, from the star to the ring. To better interpret the reconstructed image presented in Fig. 2, we performed an image reconstruction from the visibilities and closure phases of our model. To do so, we computed synthetic data sets from the model image, with an identical UV coverage as the observations, the same errors, and a similar scatter in the visibility measurements. We present an example of a reconstructed image from the model in Fig. 5, middle, compared to the real image (left). The image reconstructed from the model shares the same characteristics as the real image, i.e., an incomplete ring-like feature in the K-band oriented along PA ~ 135° and inclined by ~45°, with an inner diameter of ~5.5 mas; and an extended central spot. This confirms that our model provides a qualitatively good description of our data. In particular, the missing part of the ring-like feature can be explained by the low-brightness edge of an inclined rim (while the other edge is much brighter). It also shows that although the star is unresolved in the model with a diameter of ~0.2 mas (i.e., inside the central pixel), the central spot in the reconstructed image is much more extended (~2.1 mas; similar to the real image). Its size is about the interferometric beam size, but in the model image, it has much more flux than the star’s, due to the inner disk emission on unresolved scales as small as 0.1 AU. This could indicate that the central spot in the real image also includes an additional emission to the star’s.
Several tests have led us to conclude that the scatter in the visibility measurements lowers the achievable dynamics which can result in an image that has low or no emission inside the ring. In practice, in the K-band model, the ring is responsible for 40% of the total flux, i.e., each pixel on the ring provides (on average) ~0.10% of it (corresponding to 0.25% per squared mas) and can be retrieved. The inner disk contributes 38% of the flux, which means that each of the pixels tracing the inner disk provides (on average) ~0.06% of the total K-band emission (i.e., 0.15% per squared mas), and is not necessarily retrieved. The reconstructed image from the model (Fig. 5, middle) shows that, in our case, the process is probably able to retrieve the ring emission but not to reproduce the inner disk emission. Precise data at higher angular resolution would be needed to do so. The reconstruction process gathers most of the inner disk emission together with the star in the central spot, that contributes in the real image to 62% of the K-band emission.
The H-band image reconstructed from the model is similar to the real one, with an elongated structure extending up to the ring radius, and confirms that the H-band emission is more compact and only partially resolved by our measurements.
5. Summary and conclusions
We have presented images of the close circumstellar environment of HR 5999 reconstructed from extensive interferometric datasets and the MiRA algorithm, assuming a gray emission within each band. The K-band image shows two clear features: a marginally-resolved central spot and a resolved ring-like feature with an inner diameter of ~6 mas. The H-band emission is more compact and the corresponding image suffers from observations obtained at low signal-to-noise ratio. With the maximum angular resolution reached by the VLTI baselines (B/λ ~ 1.3 mas), we are unable to probe the exact structure of the inner disk, the corresponding H-band image providing limited and partial information, such as the orientation of the emission. To avoid mis-interpretation of the images, we have used a physical model of an unresolved star, that is surrounded by an inner disk of low surface brightness inside a ring located at the silicate sublimation radius. In the model, the inner disk contributes 38% and 34% of the K and H-band flux, respectively, and the ring does to the levels of 40% and 26%, respectively. As they both contribute similarly to the NIR emission but are distributed on different ranges of radii, one requires a strong surface brightness contrast at ~0.65 AU. We interpret this as being caused by silicate condensation in a low optical depth region that implies a sudden increase in opacity. The properties that we derive for HR 5999 are very similar to the cases of e.g., AB Aur, HD 163296, and MWC 758. If we speculate that the low surface brightness traces a low density region in an optically thick dusty disk, it is interesting to speculate whether this is a general feature of Herbig Ae stars. The NIR emission was originally thought to arise from the inner edge of the dusty disk only, and that a similar (or a major) contribution to the emission comes from an inner component is surprising. Their massive counterparts, the Herbig Be stars, show clear evidence of optically thick gas shielding part of the stellar emission enabling dust sublimation at a closer distance from the star (Kraus et al. 2008; Bagnoli et al. 2010). Our study indicates however that the inner region in HR 5999 displays a discontinuity in surface brightness that is inconsistent with a dense continuous accretion disk extending up to the star.
The nature of the emission in the inner disk is unclear. A hot gaseous disk as well as refractory grains have been previously suggested for other Herbig Ae stars (Tannirkulam et al. 2008; Eisner et al. 2009; Benisty et al. 2010). Ascertaining the emission nature is beyond the scope of the paper, as even simple models could not be accurately tested against our interferometric measurements, because of the complexity of the visibility curve. However, the contribution and properties of a gaseous disk could be studied using high resolution NIR spectra. A dense and cold gaseous disk would produce a high level of NIR continuum emission together with strong molecular lines, while non-LTE tenuous layers of atomic or ionized gas would generate a low level of continuum and strong emission lines. An accurate estimate of the mass accretion rate based on an analysis across a broad range of wavelengths would also be useful in constraining the properties of the inner disk. On the other hand, refractory dust grains could also be responsible for this continuum emission but they would be required to survive at temperatures well above their tabulated sublimation temperatures. Self-consistent models of dust-free gaseous disks and multi-dust population should be computed to fully understand the interferometric observations.
While the derived flux contributions of the two main features in the K-band image and their extents are robust, the structure of the ring being less clear. We added in a crude way the inner disk to the ring, with no self-consistent computation of the dusty disk structure at the opacity transition. It is unclear what its exact structure would be when the stellar light is partially shielded by the inner disk, but it seems likely that its morphology would deviate from the classical puffed-up rim case.
We have searched for clear trends in time variability that could explain part of the scatter in the visibility data (Eiroa et al. 2002; Sitko et al. 2008), because the timescales for changes in the structure of the dusty disk and in the dynamics of the gas – such as dust grain destruction or growth, Keplerian rotation, accretion through bursts, instabilities – are well within the two year range of our observations. More generally, any variation in the stellar and/or NIR excess flux would affect the visibility measurements. We found no such trend, and this interesting issue will be investigated further with more precise measurements, since instrumental problems related to absolute calibrations may be responsible for some of the scatter. Gathering within a short timescale (e.g., a month) such a large interferometric dataset and obtaining contemporaneous NIR photometry would however be necessary to study this problem.
To understand whether the properties derived for HR 5999 are common among Herbig Ae stars, and if they can be interpreted as a sign of disk evolution, a larger sample of stars should be studied with an extensive UV coverage at different wavelengths. To perform accurate and unambiguous image reconstruction at the milli-arsecond resolution, highly precise measurements are required, as well as very long baselines (≥140 m). Improvements are also expected on the image reconstruction codes, to nable e.g., monochromatic images in the continuum fitting the SED without any assumption about the color of the emission. In this context, the NIR 4-beam instruments PIONIER/VLTI, MIRC/CHARA, and GRAVITY/VLTI are expected to achieve tremendous progress in the coming years and to enable variability study on timescales of a few months.
Online material
Appendix A: Details of the observations
Log of the observations, including the baseline name, length (PL), position angle (PA), as well as the average seeing (Θ) and coherence time (τ).
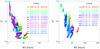 |
Fig. A.1 Observed spectral visibilities against spatial frequencies measured in the K band (left) and the H band (right). Each night/dataset is indicated with a specific color. |
 |
Fig. A.2 Observed spectral visibilities against effective spatial frequencies measured in the K band (left) and the H band (right) and assuming i = 48° and PA = 135°. Each night/dataset is indicated with a specific color. |
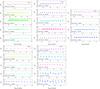 |
Fig. A.3 Observed spectral closure phases (in degrees) against maximum spatial frequencies measured in the K band (upper panels) and the H band (lower panels). Each night/dataset is indicated with a specific color, according to the same color code as in Fig. A.1. |
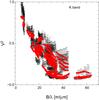 |
Fig. A.4 Squared visibilities measured (black) and computed from the reconstructed image (red filled circles) for the K band. |
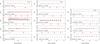 |
Fig. A.5 Closure phases measured (black) and computed from the reconstructed image (red filled circles). |
Acknowledgments
We thank the VLTI team at Paranal. M.B. acknowledges funding from INAF (grant ASI-INAF I/016/07/0). We thank the anonymous referee for useful comments that help improved the manuscript.
References
- Bagnoli, T., van Lieshout, R., Waters, L. B. F. M., et al. 2010, ApJ, 724, L5 [NASA ADS] [CrossRef] [Google Scholar]
- Benisty, M., Natta, A., Isella, A., et al. 2010, A&A, 511, A74 [NASA ADS] [CrossRef] [EDP Sciences] [Google Scholar]
- Chelli, A., Utrera, O. H., & Duvert, G. 2009, A&A, 502, 705 [NASA ADS] [CrossRef] [EDP Sciences] [Google Scholar]
- de Winter, D., van den Ancker, M. E., Maira, A., et al. 2001, A&A, 380, 609 [NASA ADS] [CrossRef] [EDP Sciences] [Google Scholar]
- Dullemond, C. P., Dominik, C., & Natta, A. 2001, ApJ, 560, 957 [NASA ADS] [CrossRef] [Google Scholar]
- Eiroa, C., Oudmaijer, R. D., Davies, J. K., et al. 2002, A&A, 384, 1038 [NASA ADS] [CrossRef] [EDP Sciences] [Google Scholar]
- Eisner, J. A., Lane, B. F., Hillenbrand, L. A., Akeson, R. L., & Sargent, A. I. 2004, ApJ, 613, 1049 [NASA ADS] [CrossRef] [Google Scholar]
- Eisner, J. A., Chiang, E. I., Lane, B. F., & Akeson, R. L. 2007, ApJ, 657, 347 [NASA ADS] [CrossRef] [Google Scholar]
- Eisner, J. A., Graham, J. R., Akeson, R. L., & Najita, J. 2009, ApJ, 692, 309 [NASA ADS] [CrossRef] [Google Scholar]
- Grady, C. A., Woodgate, B. E., Bowers, C. W., et al. 2005, ApJ, 630, 958 [NASA ADS] [CrossRef] [Google Scholar]
- Haubois, X., Perrin, G., Lacour, S., et al. 2009, A&A, 508, 923 [NASA ADS] [CrossRef] [EDP Sciences] [Google Scholar]
- Henning, T., Launhardt, R., Steinacker, J., & Thamm, E. 1994, A&A, 291, 546 [NASA ADS] [Google Scholar]
- Hillenbrand, L. A., Strom, S. E., Vrba, F. J., & Keene, J. 1992, ApJ, 397, 613 [NASA ADS] [CrossRef] [Google Scholar]
- Hubrig, S., Pogodin, M. A., Yudin, R. V., Schöller, M., & Schnerr, R. S. 2007, A&A, 463, 1039 [NASA ADS] [CrossRef] [EDP Sciences] [Google Scholar]
- Isella, A., & Natta, A. 2005, A&A, 438, 899 [NASA ADS] [CrossRef] [EDP Sciences] [Google Scholar]
- Isella, A., Tatulli, E., Natta, A., & Testi, L. 2008, A&A, 483, L13 [NASA ADS] [CrossRef] [EDP Sciences] [Google Scholar]
- Jennison, R. C. 1958, MNRAS, 118, 276 [NASA ADS] [CrossRef] [Google Scholar]
- Kama, M., Min, M., & Dominik, C. 2009, A&A, 506, 1199 [NASA ADS] [CrossRef] [EDP Sciences] [Google Scholar]
- Kraus, S., Preibisch, T., & Ohnaka, K. 2008, ApJ, 676, 490 [NASA ADS] [CrossRef] [Google Scholar]
- Kraus, S., Hofmann, K., Menten, K. M., et al. 2010, Nature, 466, 339 [NASA ADS] [CrossRef] [MathSciNet] [PubMed] [Google Scholar]
- Lachaume, R. 2003, A&A, 400, 795 [NASA ADS] [CrossRef] [EDP Sciences] [Google Scholar]
- Le Bouquin, J., Lacour, S., Renard, S., et al. 2009, A&A, 496, L1 [NASA ADS] [CrossRef] [EDP Sciences] [Google Scholar]
- Le Bouquin, J.-B., Bauvir, B., Haguenauer, P., et al. 2008, A&A, 481, 553 [NASA ADS] [CrossRef] [EDP Sciences] [Google Scholar]
- Millan-Gabet, R., Schloerb, F. P., & Traub, W. A. 2001, ApJ, 546, 358 [NASA ADS] [CrossRef] [Google Scholar]
- Monnier, J. D. 2003, Rep. Prog. Phys., 66, 789 [NASA ADS] [CrossRef] [MathSciNet] [Google Scholar]
- Monnier, J. D., & Millan-Gabet, R. 2002, ApJ, 579, 694 [NASA ADS] [CrossRef] [Google Scholar]
- Monnier, J. D., Millan-Gabet, R., Billmeier, R., et al. 2005, ApJ, 624, 832 [NASA ADS] [CrossRef] [Google Scholar]
- Natta, A., Prusti, T., Neri, R., et al. 2001, A&A, 371, 186 [NASA ADS] [CrossRef] [EDP Sciences] [Google Scholar]
- Pauls, T. A., Young, J. S., Cotton, W. D., & Monnier, J. D. 2005, PASP, 117, 1255 [NASA ADS] [CrossRef] [Google Scholar]
- Perez, M. R., Webb, J. R., & The, P. S. 1992, A&A, 257, 209 [NASA ADS] [Google Scholar]
- Perez, M. R., Grady, C. A., & The, P. S. 1993, A&A, 274, 381 [NASA ADS] [Google Scholar]
- Petrov, R. G., Malbet, F., Weigelt, G., et al. 2007, A&A, 464, 1 [NASA ADS] [CrossRef] [EDP Sciences] [Google Scholar]
- Pollack, J. B., Hollenbach, D., Beckwith, S., et al. 1994, ApJ, 421, 615 [NASA ADS] [CrossRef] [Google Scholar]
- Preibisch, T., Kraus, S., Driebe, T., van Boekel, R., & Weigelt, G. 2006, A&A, 458, 235 [NASA ADS] [CrossRef] [EDP Sciences] [Google Scholar]
- Renard, S., Malbet, F., Benisty, M., Thiébaut, E., & Berger, J. 2010, A&A, 519, A26 [NASA ADS] [CrossRef] [EDP Sciences] [Google Scholar]
- Renard, S., Thiebaut, E., & Malbet, F. 2011, A&A, accepted [Google Scholar]
- Rodrigues, C. V., Sartori, M. J., Gregorio-Hetem, J., & Magalhães, A. M. 2009, ApJ, 698, 2031 [NASA ADS] [CrossRef] [Google Scholar]
- Schöller, M. 2007, New Astron. Rev., 51, 628 [NASA ADS] [CrossRef] [Google Scholar]
- Siebenmorgen, R., Prusti, T., Natta, A., & Müller, T. G. 2000, A&A, 361, 258 [NASA ADS] [Google Scholar]
- Sitko, M. L., Carpenter, W. J., Kimes, R. L., et al. 2008, ApJ, 678, 1070 [NASA ADS] [CrossRef] [Google Scholar]
- Stecklum, B., Eckart, A., Henning, T., & Loewe, M. 1995, A&A, 296, 463 [NASA ADS] [Google Scholar]
- Strong, D., & Chan, T. 2003, Inverse Problems, 19, S165 [NASA ADS] [CrossRef] [Google Scholar]
- Tannirkulam, A., Harries, T. J., & Monnier, J. D. 2007, ApJ, 661, 374 [NASA ADS] [CrossRef] [Google Scholar]
- Tannirkulam, A., Monnier, J. D., Harries, T. J., et al. 2008, ApJ, 689, 513 [NASA ADS] [CrossRef] [Google Scholar]
- Tatulli, E., Millour, F., Chelli, A., et al. 2007, A&A, 464, 29 [NASA ADS] [CrossRef] [EDP Sciences] [Google Scholar]
- Thiébaut, E. 2008, SPIE Ser., 7013 [Google Scholar]
- Thiébaut, É., & Giovannelli, J.-F. 2010, IEEE Signal Processing Magazine, 27, 97 [CrossRef] [Google Scholar]
- Tjin, A, Djie, H. R. E., The, P. S., Andersen, J., et al. 1989, A&AS, 78, 1 [NASA ADS] [Google Scholar]
- van Boekel, R., Min, M., Waters, L. B. F. M., et al. 2005, A&A, 437, 189 [NASA ADS] [CrossRef] [EDP Sciences] [Google Scholar]
- Weingartner, J. C., & Draine, B. T. 2001, ApJ, 563, 842 [Google Scholar]
- Zhao, M., Gies, D., Monnier, J. D., et al. 2008, ApJ, 684, L95 [NASA ADS] [CrossRef] [Google Scholar]
All Tables
Parameters of our model with inner disk between Rin and Rsub, where silicates sublimate.
Log of the observations, including the baseline name, length (PL), position angle (PA), as well as the average seeing (Θ) and coherence time (τ).
All Figures
|
Fig. 1 UV coverage obtained in the K-band (left) and in the H-band (right). |
| In the text | |
|
Fig. 2 Reconstructed image in the K band. The interferometric beam (defined as the maximum angular resolution) is given in the lower right corner. The image is shown on a 14 mas × 14 mas scale. The H band image (not shown) brings little reliable information. |
| In the text | |
|
Fig. 3 The black curves give the predictions of the two-component disk model for the SED (left), the broad-band visibilities in the K-band (middle) and in the H-band (right). The visibilities predicted by the puffed-up rim model are added (red dashed curves). In both cases, the visibilities curves are shown along two perpendicular baseline position angles, against effective spatial frequency (computed with i = 48° and PA = 135°). See the text for more details on the effective baselines Beff, and note that their values are smaller than the physical baseline lengths given in Figs. A.1 and A.4. |
| In the text | |
|
Fig. 4 The black curves give the predictions of the two-component disk model for the broad-band closure phases in the K-band (left columns) and in the H-band (right columns). Each panel corresponds to a different telescope configuration, and the color code is the one of Figs. A.1 and A.3. |
| In the text | |
|
Fig. 5 The K-band image is shown, as reconstructed from the AMBER measurements (left), and as reconstructed from the simulated data from the model (middle). The latter is shown in the right panel. The images are shown on a 10 mas × 10 mas scale. |
| In the text | |
|
Fig. A.1 Observed spectral visibilities against spatial frequencies measured in the K band (left) and the H band (right). Each night/dataset is indicated with a specific color. |
| In the text | |
|
Fig. A.2 Observed spectral visibilities against effective spatial frequencies measured in the K band (left) and the H band (right) and assuming i = 48° and PA = 135°. Each night/dataset is indicated with a specific color. |
| In the text | |
|
Fig. A.3 Observed spectral closure phases (in degrees) against maximum spatial frequencies measured in the K band (upper panels) and the H band (lower panels). Each night/dataset is indicated with a specific color, according to the same color code as in Fig. A.1. |
| In the text | |
|
Fig. A.4 Squared visibilities measured (black) and computed from the reconstructed image (red filled circles) for the K band. |
| In the text | |
|
Fig. A.5 Closure phases measured (black) and computed from the reconstructed image (red filled circles). |
| In the text | |
Current usage metrics show cumulative count of Article Views (full-text article views including HTML views, PDF and ePub downloads, according to the available data) and Abstracts Views on Vision4Press platform.
Data correspond to usage on the plateform after 2015. The current usage metrics is available 48-96 hours after online publication and is updated daily on week days.
Initial download of the metrics may take a while.