Fig. 3
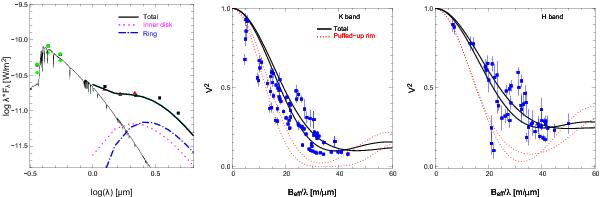
The black curves give the predictions of the two-component disk model for the SED (left), the broad-band visibilities in the K-band (middle) and in the H-band (right). The visibilities predicted by the puffed-up rim model are added (red dashed curves). In both cases, the visibilities curves are shown along two perpendicular baseline position angles, against effective spatial frequency (computed with i = 48° and PA = 135°). See the text for more details on the effective baselines Beff, and note that their values are smaller than the physical baseline lengths given in Figs. A.1 and A.4.
Current usage metrics show cumulative count of Article Views (full-text article views including HTML views, PDF and ePub downloads, according to the available data) and Abstracts Views on Vision4Press platform.
Data correspond to usage on the plateform after 2015. The current usage metrics is available 48-96 hours after online publication and is updated daily on week days.
Initial download of the metrics may take a while.