| Issue |
A&A
Volume 529, May 2011
|
|
|---|---|---|
| Article Number | A81 | |
| Number of page(s) | 6 | |
| Section | The Sun | |
| DOI | https://doi.org/10.1051/0004-6361/201016234 | |
| Published online | 07 April 2011 | |
Solar total irradiance in cycle 23
1
Max-Planck-Institut für Sonnensystemforschung,
Max-Planck-Str. 2,
37191
Katlenburg-Lindau,
Germany
e-mail: natalie@mps.mpg.de
2
School of Space Research, Kyung Hee University,
Yongin,
Gyeonggi
446-701,
Korea
3
Physikalisch-Meteorologisches Observatorium Davos,
World Radiation
Center, Switzerland
Received: 30 November 2010
Accepted: 31 January 2011
Context. The most recent minimum of solar activity was deeper and longer than the previous two minima as indicated by different proxies of solar activity. This is also true for the total solar irradiance (TSI) according to the PMOD composite.
Aims. The apparently unusual behaviour of the TSI has been interpreted as evidence against solar surface magnetism as the main driver of the secular change in the TSI. We test claims that the evolution of the solar surface magnetic field does not reproduce the observed TSI in cycle 23.
Methods. We use sensitive, 60-min averaged MDI magnetograms and quasi-simultaneous continuum images as an input to our SATIRE-S model and calculate the TSI variation over cycle 23, sampled roughly every two weeks. The computed TSI is then compared with the PMOD composite of TSI measurements and with the data from two individual instruments, SORCE/TIM and UARS/ACRIM II, that monitored the TSI during the declining phase of cycle 23 and over the previous minimum in 1996, respectively.
Results. Excellent agreement is found between the trends shown by the model and almost all sets of measurements. The only exception is the early, i.e. 1996 to 1998, PMOD data. Whereas the agreement between the model and the PMOD composite over the period 1999–2009 is almost perfect, the modelled TSI shows a steeper increase between 1996 and 1999 than implied by the PMOD composite. On the other hand, the steeper trend in the model agrees remarkably well with the ACRIM II data. A closer look at the VIRGO data, which are the basis of the PMOD composite after 1996, reveals that only one of the two VIRGO instruments, the PMO6V, shows the shallower trend present in the composite, whereas the DIARAD measurements indicate a steeper trend.
Conclusions. Based on these results, we conclude that (1) the sensitivity changes of the PMO6V radiometers within VIRGO during the first two years have very likely not been correctly evaluated; and that (2) the TSI variations over cycle 23 and the change in the TSI levels between the minima in 1996 and 2008 are consistent with the solar surface magnetism mechanism.
Key words: Sun: activity / magnetic fields / solar-terrestrial relations
© ESO, 2011
1. Introduction
Solar total (i.e. integrated over all wavelengths) irradiance is the main external source of energy input into the Earth’s atmosphere and is thus one of the key parameters of climate models. Total solar irradiance (TSI) has been measured by a series of partly overlapping space-borne instruments since 1978 and was found to vary on different time scales from minutes to decades (Willson & Hudson 1988, 1991; Fröhlich 2009b). These variations have generally been attributed to the evolution of solar surface magnetic features, such as sunspots, faculae and the network (Foukal & Lean 1988; Fröhlich & Lean 1997; Fligge et al. 2000; Preminger et al. 2002; Krivova et al. 2003; Wenzler et al. 2005, 2006). In particular, models of the TSI assuming that all variations are entirely caused by the evolution of the solar photospheric magnetic flux explain up to 90% of all observed variations up to the middle of cycle 23 (Wenzler et al. 2006).
The minimum in 2008 was more extended and deeper than the two previous minima (in 1976 and 1986) as indicated by many different indices (e.g., Didkovsky et al. 2010; Heber et al. 2009; Heelis et al. 2009; Wang et al. 2009; Solomon et al. 2010), including the TSI (see, e.g., Fröhlich 2009a). Fröhlich (2009a) found a decrease in TSI of more than 0.2 W m-2 compared with the minimum in 1996. The magnitude of this decrease, relative to the cycle amplitude, is larger than the corresponding decrease shown by other indices (an exception is the open magnetic field). He interpreted this decrease as evidence against the magnetic origin of the secular change in the TSI.
This engendered the analysis by Steinhilber (2010), who used MDI magnetogram and intensity synoptic charts and a model sculpturing the SATIRE-S to reconstruct the TSI between 1996 and 2010. He found a fair agreement between the calculated TSI and the PMOD data between 1996 and 2004, but failed to reproduce the measurements afterwards and thus arrived at the conclusion that “the TSI observation cannot be described by the evolving manifestation of solar surface magnetism as obtained from MDI CR synoptic magnetograms and photograms”. Among possible explanations he lists the uncertainty in the irradiance observations, a change in the global photospheric temperature or that the evolution of the weak magnetic flux might have been underrepresented in his model. The latter is indeed possible because the weak changes in the irradiance levels at minima are believed to be driven by the changes in the weak “background” magnetic flux (e.g., Solanki et al. 2002; Krivova et al. 2007). By setting the cut-off at 50 G, which almost eliminates this background flux, and by leaving out the latitudes above ±65°, Steinhilber (2010) basically models the evolution of the TSI caused by active regions only.
This is implicitly confirmed by the recent study of Ball et al. (2011). They ran the SATIRE-S model based on 5-min averaged MDI magnetograms and compared the outcome of the model with the SORCE total and spectral irradiance measurements as well as with the PMOD TSI composite for the period 2003–2009. A very good agreement between the model and both TIM/SORCE and PMOD data was found, with the linear correlation coefficient lying above 0.98 in both cases, but the modelled variability on the rotational time scale was weaker compared with observations during the minimum period in 2008. Note that Ball et al. (2011) employed a 3-σ noise cut-off of roughly 40 G and the limb threshold of μ = 0.1 (i.e. leaving out only heliocentric angles above approximately 84°).
Here, we use the SATIRE-S model and the MDI magnetograms and continuum images to re-calculate solar irradiance variations between 1996 and 2009 and to check whether the calculated changes agree with the observations. To make sure that we include weakest possible magnetic features with the MDI data, we use 60-min averaged magnetograms with a mean noise level of about 3.9 G. We also extend the analysis of Steinhilber (2010) by comparing the model’s output with different TSI time series and not just the PMOD composite.
We describe our model and all the data we used in Sect. 2, present the results in Sect. 3 and sum up our conclusions in Sect. 4.
2. Data and model
2.1. SATIRE and MDI data
To calculate TSI variations over the period 1996–2009, we employed the SATIRE-S model (Krivova et al. 2003, 2011), which assumes that all irradiance changes on the considered time scales (i.e. days to the solar cycle) are entirely caused by the evolution of the solar surface magnetic field. SoHO MDI magnetograms and continuum images (Scherrer et al. 1995) were employed to retrieve the information on the surface distribution of different magnetic structures at a given time. The current version of the model distinguishes four types of surface features: the quiet Sun (surface free of magnetic field above the noise level), sunspot umbrae, sunspot penumbrae, and faculae/network.
In order to include the weakest possible magnetic features in the analysis, we used MDI magnetograms averaged over 60 min. Averaging over longer intervals than this is problematic in practice, because sufficiently long sequences of single magnetograms become incrementally rarer, and a still longer integration is not necessarily beneficial, as intrinsic evolution and peculiar motion of magnetic features lead to a smearing of the signal (cf. Krivova & Solanki 2004). The noise level in the final magnetograms is roughly 3.9 G on average, but depends somewhat on the position on the disc as found by Ortiz et al. (2002) and Ball et al. (2011). Because of the new calibration of the MDI magnetograms this is about 50% higher than found by Krivova & Solanki (2004). We set the noise threshold at the 3-σ level, which removes around 99% of the noise. We also excluded the limb pixels with μ < 0.1 (cf. Ball et al. 2011). The line-of-sight magnetogram signal was corrected for foreshortening by assuming the magnetic field in faculae and the network to be vertical.
MDI continuum images suffer progressively from a flat-field distortion, which becomes increasingly serious after around 2003–2004. Therefore, we corrected the images, dividing them by the median filters, which are produced once or twice per Carrington rotation and were kindly provided by the MDI team (Sommers 2007; Hoeksema, priv. comm.). These are the filters that are used by the MDI team to produce level 2 continuum photograms. The very limited number of the available level 2 images was the main argument against employing these data directly instead of level 1.5.
The continuum images were rotated to co-align them in time with the corresponding magnetograms, typically recorded within an hour of each other. The continuum images were used to identify sunspot pixels, which were then excluded from the corresponding magnetograms. The remaining magnetic signal above the noise threshold was considered to be faculae and the network.
We originally selected images in a way that they were sampled roughly every two weeks, whenever possible. Several shorter periods (e.g., the Halloween storm at the end of October 2003 or end of December 1996) were covered more frequently. A significant fraction of the final averaged magnetograms, however, turned out to be corrupted for different reasons and had to be rejected. The final set includes 262 pairs of 60-min averaged magnetograms and the corresponding continuum images, covering the period November 1996 to April 2009.
The time-independent brightness spectra of all components were computed (Unruh et al. 1999) from the corresponding model atmospheres using the ATLAS9 code described by Kurucz (1993). The model has one free parameter, Bsat, which takes into account saturation of contrast with increasing concentration of magnetic elements (as suggested by the work of Solanki & Stenflo 1985; Ortiz et al. 2002; Vögler 2005). The free parameter is determined from a comparison of the model outcome with the measurements. The SATIRE model has been extensively described in a number of earlier papers (e.g., Krivova et al. 2003; Wenzler et al. 2004, 2005, 2006; Solanki et al. 2005).
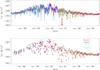 |
Fig. 1 Total solar irradiance over cycle 23: reconstructed using SATIRE-S from 60-min averaged MDI magnetograms (red diamonds; consecutive days are connected by red lines) and measured. Measurements by two instruments, ACRIM II (pine green) and TIM/SORCE (light green), are shown as well as the PMOD composite of measurements (blue). In the bottom panel, measurements are only shown on the days when the SATIRE-S values based on 60-min MDI magnetograms are available. |
Comparison between the model and different data sets and between the PMOD composite and the two individual instruments.
2.2. TSI observations
A number of space-borne instruments have being monitoring the TSI since 1978. Their measurements mostly overlap in time, which should in principal allow their cross-calibration. A construction of a composite record is, nevertheless, quite challenging because of a few but crucial exceptions. Thus three composites have been produced, one each by Fröhlich (2009b), called PMOD composite, and by the ACRIM (Willson & Mordvinov 2003) and IRMB (Dewitte et al. 2004b) teams.
Here, we use the PMOD composite because (1) SATIRE-S was previously found to agree best with this composite (Wenzler et al. 2009; Krivova et al. 2009); and (2) Fröhlich’s (2009a) analysis of the TSI trend between the minima in 1996 and 2008 is based on this composite.
We use version 6.2 of 0904, i.e. exactly the same as the one used by Fröhlich (2009a). In the period after 1996, the PMOD composite is based on SoHO/VIRGO measurements (Fröhlich 2009a). VIRGO data are discussed in more detail in Sect. 3.
In addition, we use data from two individual experiments. For the period since 2003, i.e. the declining phase of cycle 23, we also consider data from the SORCE/TIM instrument (Kopp et al. 2005), which show a slightly weaker decrease in TSI over the period 2003–2009 (Fröhlich 2009a). We also use UARS/ACRIM II data (Willson 1997) over the period covering the activity minimum in 1996. Besides ERBS/ERBE, this is the only instrument that monitored solar irradiance uninterruptedly from the declining phase of cycle 22 to around the maximum of cycle 23. We also considered ERBS/ERBE data, but they are significantly noisier. Although they can possibly be used to trace long-term changes, on shorter time scales (at least, up to a year) they show a significantly lower correlation with other data sets, such as EURECA/SOVA 1 and SOVA 2 or Nimbus 7/ERB than, e.g., the ACRIM II data (Mecherikunnel 1996). We also tried to compare the results to ERBS/ERBE measurements, which turned to be ineffective and we do not discuss them here.
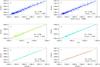 |
Fig. 2 Comparison of the model with different data sets: a) PMOD composite (1996–2009); b) PMOD composite (1999–2009); c) TIM; e) ACRIM II, and of the PMOD composite with the measurements by the two other individual instruments: d) TIM and f) ACRIM II. The coloured straight lines show the slopes of the linear regressions between the compared sets. The dashed black line shows the expected ideal slope of 1. In each panel, the corresponding correlation coefficient, Rc, and the slope are indicated. |
3. Results
The reconstructed TSI is plotted in Fig. 1 (red diamonds) and is compared with the PMOD composite (blue), ACRIM II (pine green) and TIM (light green) measurements. In the top panel all data are shown, whereas in the bottom panel we show only data on the days with available model values, to facilitate the comparison. All data are shifted to fit the PMOD mean absolute level after 1999. Note that the free parameter in the SATIRE-S model is fixed to achieve the best agreement with the PMOD composite and is not varied further when comparing SATIRE’s output to other data sets. The value of the free parameter is 452 G, which is very close to the value of 450 G obtained by Steinhilber (2010) using MDI synoptic charts. This is about 60% higher than the value of 280 G found by Krivova et al. (2003) from a comparison with the level 2 VIRGO data (version v5_005_0301), which is mainly because of the re-calibration of the MDI magnetograms carried out by the MDI team (Tran et al. 2005). It is easy to see that the model generally agrees quite well with all the data sets, which is also confirmed by Fig. 2 and Table 1.
Figure 2 directly compares the model to each of the data sets: PMOD (panels a and b), TIM (c) and ACRIM II (e). Also shown is the comparison of the PMOD data with those from the two individual experiments, TIM (d) and ACRIM II (f). The coloured straight lines in Fig. 2 show the linear regression fits between the sets compared in each panel, while the black dashed lines (in most cases hidden behind the coloured lines) show the “ideal” fits with the slope of 1. Also listed in each panel are the corresponding correlation coefficients and the slopes of the linear regression fits. For this comparison, we left out the data during big spot passages (i.e. values below 1365 W/m2) to avoid their strong effect on the correlations and slopes, since the main accent of this paper is the analysis of the long-term changes in the TSI.
The correlation coefficients, their squares and the slopes of the linear regression fits are summarised in Table 1. The correlation coefficients emphasise the agreement on shorter time scales (i.e. the scatter of the individual data points), whereas the slopes of the linear regression better describe the long-term changes. The best short-term agreement is reached between the TIM and PMOD data (rc = 0.99), although the correlation is only slightly lower for the SATIRE-S vs. PMOD (rc = 0.98), and is still significantly high for the SATIRE-S vs. TIM (rc = 0.96). The correlation for both the SATIRE-S and PMOD vs. ACRIM II is somewhat weaker (rc = 0.93 and 0.94, respectively), implying that on shorter time scales ACRIM II is noisier than PMOD or TIM.
The slopes of the linear regressions between SATIRE-S and all data sets, PMOD, TIM and ACRIM II, are all very close to 1 (the deviation is less than 1% in all cases). We emphasise that the free parameter of the model was fixed to provide the best fit with the PMOD data and was not changed when comparing with the other data sets, so that the slightly worse agreement (in the slopes) with the other two sets is due to the model set up.
A closer look at Fig. 1 (see also Fig. 3) reveals, however, that the PMOD values lie slightly higher than SATIRE-S and ACRIM II values before approximately 1998/1999. Note that the ACRIM II values were shifted to fit the PMOD level after the recovery of SoHO in 1999. Indeed, if the PMOD values before 1999 are excluded, the slope of the linear regression between SATIRE-S and PMOD becomes essentially 1 (see Fig. 2 and Table 1). The remaining difference is smaller than the difference between PMOD and TIM (slope 1.022).
Although the short-term agreement (i.e. rc) between SATIRE-S and ACRIM II is worse than between SATIRE-S and PMOD or TIM, which is caused by the higher scatter in ACRIM II data, the slope of the linear fit between SATIRE-S and ACRIM II is still very close to 1 (0.991; remember that the free parameter, Bsat, was fixed to get best agreement with PMOD so that the obtained slope between SATIRE-S and ACRIM II came out automatically without further adjustments). At the same time, the slope between PMOD and ACRIM II is the only one that strongly diverges from unity, being only 0.84 (see Fig. 2 and Table 1).
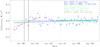 |
Fig. 3 Difference in W/m2 between the model and the data: PMOD (blue), ACRIM II (pine green), TIM (light green), and between the PMOD and the other two data sets: ACRIM II (orange) and TIM (cyan). Dots show values for individual days, whereas bigger symbols represent bins of five individual points. The corresponding trends with time are indicated by the straight lines and are listed in the right top corner. The vertical black lines show the beginning and the end dates of the period without regular contact with SoHO. |
In Fig. 3 we plot the difference between different pairs of irradiance sets. The dots signify differences on individual days, whereas the bigger symbols show bins of five days on which 60-min magnetograms are available (i.e. 5 dots). The regression lines highlight the trends. The slopes of the regressions are listed in the top right corner of Fig. 3 and in the last column of Table 1. The difference between SATIRE-S and PMOD after 1999 displays a negligible slope of –3 ppm/decade (which is less than 1σ). It is more than an order of magnitude higher (>2σ) if PMOD is considered over the whole period 1996–2009, but most of this is obviously due to the different trends before 1999. Similarly, the differences between SATIRE-S (optimised to fit the PMOD composite) and TIM or ACRIM II also exhibit weak slopes of 18 ppm/decade and 7 ppm/decade, respectively (both below 1σ). The difference PMOD – TIM shows a stronger trend of about –50 ppm/decade, as also found by Fröhlich (2009a). Striking, however, is the very strong trend in the difference of ACRIM II – PMOD. With 475 ppm/decade, this is an order of magnitude stronger than the trend for the differences PMOD – TIM or SATIRE-S – PMOD (if taken over the whole period) and roughly two orders of magnitude stronger than the differences between SATIRE-S – ACRIM II or SATIRE-S – PMOD (if taken only since 1999). Even with the higher uncertainty introduced by the bigger scatter in ACRIM II, the trend differs from zero by 4.7σ.
The vertical black lines in Fig. 3 bound the period without regular contact with SoHO. The analysis carried out here shows that the systematic difference between SATIRE-S and the PMOD composite is restricted to the period prior to the loss of contact with SoHO. Moreover, a comparison with the ACRIM II data shows that whereas SATIRE-S is consistent with this data set, the PMOD composite is not. Furthermore, a comparison between the data from the two instruments composing SoHO/VIRGO, namely PMO6V and DIARAD, reveals a similar difference in their trends in this period as shown by ACRIM II or SATIRE-S vs. the PMOD composite.
From 1996 onwards, the PMOD composite is based on SoHO/VIRGO measurements. VIRGO started operation in 1996, just around the cycle minimum, and the evaluation of the early trends in these data is not entirely free of problems, because the two types of VIRGO radiometers, PMO6V and DIARAD, showed a very different behaviour (e.g., Fröhlich 2000; Fröhlich & Finsterle 2001; Fröhlich 2009a). This is further complicated by the interruption in SoHO measurements in 1998/1999.
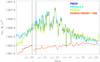 |
Fig. 4 Monthly smoothed TSI measurements by PMO6V (light blue line), DIARAD (light green line) and from the PMOD composite (dark blue dotted line). The PMO6V and DIARAD data were shifted to fit the mean PMOD level after 1999. The red line shows the difference between DIARAD and PMO6V shifted by 1365 W/m2. The black dashed line marks the difference between SATIRE-S and PMOD in the period before regular contact with SoHO was lost. The vertical black lines mark the beginning and the end dates of the period without regular contact with SoHO. |
Figure 4 shows the monthly smoothed data from PMO6V1 (light blue line; level 2.0) and DIARAD2 (light green line, level 2.0; Dewitte et al. 2004a) and their difference (red line) shifted by 1365 W/m2. Both data sets were shifted to fit the mean level of the PMOD composite (dark blue dotted line) after 1999. Obviously, in this earlier period the PMOD composite relies on the PMO6V data, whereas the DIARAD data demonstrate a significantly steeper rise. For the period around 1997–1998, this steeper rise agrees well with ACRIM-II data and SATIRE-S results. The dashed black line shows the mean difference between the model and the PMOD data as determined by the points in Fig. 3 before the loss of contact with SoHO. We emphasise that because our set of 60-min MDI magnetograms starts only in November 1996, we can argue neither pro nor contra the very steep increase in the DIARAD TSI in 1996 (which is not seen in ACRIM II data).
Cumulatively, these results suggest that the disagreement between the model and the PMOD composite is more likely to lie with the early behaviour of the PMO6V data than with shortcomings of the SATIRE-S model. Thus, the fact that the TSI level at the previous minimum is mismeasured by roughly 0.2 W/m2 in the PMOD composite (see Figs. 3 and 4), appears to be the main reason for the difference in the behaviour of the TSI levels during the minima in 1996 and 2009 when compared with other proxies as found by Fröhlich (2009a).
4. Conclusions
We have reconstructed total solar irradiance using the SATIRE-S model based on 60-minute averaged MDI magnetograms and continuum images recorded roughly every two weeks. We summarise our results here as follows:
-
1.
We find a good agreement between the model and the PMOD composite since 1999 and between the model and measurements of the two experiments: SORCE/TIM and ACRIM II, whose observations cover the declining phase of cycle 23 and the activity minimum in 1996, respectively. The slopes of the regression fits between the SATIRE-S and all sets of observations all lie within 0.01 around 1.0, and the corresponding trends in the differences SATIRE-S minus observations are all below ± 50 ppm/decade, i.e. less than the trend in the difference PMOD – TIM. The agreement with PMOD significantly increases and becomes very close to ideal within the error-bars (slope of the SATIRE-S vs. PMOD fit is 1.001 and the trend for SATIRE-S – PMOD is −3 ppm/decade) if only the PMOD data are considered that were recorded after the interruptions in SoHO operation in 1998/1999.
-
2.
There is a strong trend (475 ppm/decade) in the difference between the ACRIM II and PMOD data in the period before the loss of regular contact with SoHO, which roughly equals the trend in SATIRE-S–PMOD for this period.
-
3.
A similar trend is also shown by the difference between the measurements by DIARAD and PMO6V, the two VIRGO radiometers. Whereas the PMOD composite relies on PMO6V data, the TSI increase over 1997–1998 in our model agrees well with the trend shown by the DIARAD.
These results suggest that early degradation trends in the PMO6V data (Fröhlich 2000; Fröhlich & Finsterle 2001) might not have been fully accounted for (cf. also Fröhlich 2009a). For this reason, the level of TSI during the activity minimum in 1996 seems to be overestimated in the PMOD composite by roughly 0.2 W/m2, which explains the apparently different behaviour of the TSI over cycle 23 when compared with other proxies as found by Fröhlich (2009a). Therefore we conclude that the TSI variability in cycle 23 is fully consistent with the solar surface
magnetism mechanism (Fröhlich & Lean 1997; Fligge et al. 2000; Preminger et al. 2002; Krivova et al. 2003; Wenzler et al. 2006).
Acknowledgments
We are grateful to Jeneen Sommers, Todd Hoeksema and Phil Scherrer for their advice and kind assistance in MDI data access and analysis. We use data from VIRGO and MDI experiments on the cooperative ESA/NASA mission SoHO. We thank C. Fröhlich as well as the SORCE/TIM, IRMB and ACRIM II teams for providing their data. This work was supported by the Deutsche Forschungsgemeinschaft, DFG project number SO 711/1-3 and the WCU grant (No. R31-10016) funded by the Korean Ministry of Education, Science and Technology.
References
- Ball, W. T., Unruh, Y. C., Krivova, N. A., Solanki, S. K., & Harder, J. W. 2011, A&A, submitted [Google Scholar]
- Dewitte, S., Crommelynck, D., & Joukoff, A. 2004a, JGR (Space Physics), 109, 2102 [Google Scholar]
- Dewitte, S., Crommelynck, D., Mekaoui, S., & Joukoff, A. 2004b, Sol. Phys., 224, 209 [NASA ADS] [CrossRef] [Google Scholar]
- Didkovsky, L. V., Judge, D. L., Wieman, S. R., & McMullin, D. 2010, in SOHO-23: Understanding a Peculiar Solar Minimum, ed. S. R. Cranmer, J. T. Hoeksema, & J. L. Kohl, ASP Conf. Ser., 428, 73 [Google Scholar]
- Fligge, M., Solanki, S. K., & Unruh, Y. C. 2000, A&A, 353, 380 [NASA ADS] [Google Scholar]
- Foukal, P., & Lean, J. 1988, ApJ, 328, 347 [NASA ADS] [CrossRef] [Google Scholar]
- Fröhlich, C. 2000, Space Sci. Rev., 94, 15 [NASA ADS] [CrossRef] [Google Scholar]
- Fröhlich, C. 2009a, A&A, 501, L27 [NASA ADS] [CrossRef] [EDP Sciences] [Google Scholar]
- Fröhlich, C. 2009b, in Climate and Weather of the Sun-Earth System (CAWSES): Selected Papers from the 2007 Kyoto Symposium, ed. T. T. et al. (Setagaya-ku, Tokyo, Japan: Terra Publishing), 217 [Google Scholar]
- Fröhlich, C., & Finsterle, W. 2001, in Recent Insights Into the Physics of the Sun and Heliosphere – Highlights from SOHO and Other Space Missions, ed. P. Brekke, B. Fleck, & J. B. Gurman, ASP Conf. Ser., 203, 105 [Google Scholar]
- Fröhlich, C., & Lean, J. 1997, ESA SP, 415, 227 [NASA ADS] [Google Scholar]
- Heber, B., Kopp, A., Gieseler, J., et al. 2009, ApJ, 699, 1956 [Google Scholar]
- Heelis, R. A., Coley, W. R., Burrell, A. G., et al. 2009, GRL, 36 [Google Scholar]
- Kopp, G., Lawrence, G., & Rottman, G. 2005, Sol. Phys., 230, 129 [NASA ADS] [CrossRef] [Google Scholar]
- Krivova, N. A., & Solanki, S. K. 2004, A&A, 417, 1125 [NASA ADS] [CrossRef] [EDP Sciences] [Google Scholar]
- Krivova, N. A., Solanki, S. K., Fligge, M., & Unruh, Y. C. 2003, A&A, 399, L1 [NASA ADS] [CrossRef] [EDP Sciences] [Google Scholar]
- Krivova, N. A., Balmaceda, L., & Solanki, S. K. 2007, A&A, 467, 335 [NASA ADS] [CrossRef] [EDP Sciences] [Google Scholar]
- Krivova, N. A., Solanki, S. K., & Wenzler, T. 2009, GRL, 36, L20101 [Google Scholar]
- Krivova, N. A., Solanki, S. K., & Unruh, Y. C. 2011, J. Atm. Sol.-Terr. Phys., 73, 223 [Google Scholar]
- Kurucz, R. 1993, ATLAS9 Stellar Atmosphere Programs and 2 km/s grid. Kurucz CD-ROM No. 13, Cambridge, Mass.: Smithsonian Astrophysical Observatory, 13 [Google Scholar]
- Mecherikunnel, A. T. 1996, JGR, 101, 17073 [NASA ADS] [CrossRef] [Google Scholar]
- Ortiz, A., Solanki, S. K., Domingo, V., Fligge, M., & Sanahuja, B. 2002, A&A, 388, 1036 [NASA ADS] [CrossRef] [EDP Sciences] [Google Scholar]
- Preminger, D. G., Walton, S. R., & Chapman, G. A. 2002, JGR, 107, 1354 [Google Scholar]
- Scherrer, P. H., Bogart, R. S., Bush, R. I., et al. 1995, Sol. Phys., 162, 129 [Google Scholar]
- Solanki, S. K., & Stenflo, J. O. 1985, A&A, 148, 123 [NASA ADS] [Google Scholar]
- Solanki, S. K., Schüssler, M., & Fligge, M. 2002, A&A, 383, 706 [NASA ADS] [CrossRef] [EDP Sciences] [Google Scholar]
- Solanki, S. K., Krivova, N. A., & Wenzler, T. 2005, Adv. Space Res., 35, 376 [Google Scholar]
- Solomon, S. C., Woods, T. N., Didkovsky, L. V., Emmert, J. T., & Qian, L. 2010, GRL, 37, 16103 [Google Scholar]
- Steinhilber, F. 2010, A&A, 523, A39 [NASA ADS] [CrossRef] [EDP Sciences] [Google Scholar]
- Tran, T., Bertello, L., Ulrich, R. K., & Evans, S. 2005, ApJS, 156, 295 [NASA ADS] [CrossRef] [Google Scholar]
- Unruh, Y. C., Solanki, S. K., & Fligge, M. 1999, A&A, 345, 635 [NASA ADS] [Google Scholar]
- Vögler, A. 2005, Mem. Soc. Astron. It., 76, 842 [NASA ADS] [Google Scholar]
- Wang, Y., Robbrecht, E., & Sheeley, N. R. 2009, ApJ, 707, 1372 [NASA ADS] [CrossRef] [Google Scholar]
- Wenzler, T., Solanki, S. K., Krivova, N. A., & Fluri, D. M. 2004, A&A, 427, 1031 [NASA ADS] [CrossRef] [EDP Sciences] [Google Scholar]
- Wenzler, T., Solanki, S. K., & Krivova, N. A. 2005, A&A, 432, 1057 [NASA ADS] [CrossRef] [EDP Sciences] [Google Scholar]
- Wenzler, T., Solanki, S. K., Krivova, N. A., & Fröhlich, C. 2006, A&A, 460, 583 [NASA ADS] [CrossRef] [EDP Sciences] [Google Scholar]
- Wenzler, T., Solanki, S. K., & Krivova, N. A. 2009, GRL, 36, L11102 [Google Scholar]
- Willson, R. C. 1997, Science, 277, 1963 [NASA ADS] [CrossRef] [Google Scholar]
- Willson, R. C., & Hudson, H. S. 1988, Nature, 332, 810 [NASA ADS] [CrossRef] [Google Scholar]
- Willson, R. C., & Hudson, H. S. 1991, Nature, 351, 42 [NASA ADS] [CrossRef] [Google Scholar]
- Willson, R. C., & Mordvinov, A. V. 2003, GRL, 30, 1199 [Google Scholar]
All Tables
Comparison between the model and different data sets and between the PMOD composite and the two individual instruments.
All Figures
|
Fig. 1 Total solar irradiance over cycle 23: reconstructed using SATIRE-S from 60-min averaged MDI magnetograms (red diamonds; consecutive days are connected by red lines) and measured. Measurements by two instruments, ACRIM II (pine green) and TIM/SORCE (light green), are shown as well as the PMOD composite of measurements (blue). In the bottom panel, measurements are only shown on the days when the SATIRE-S values based on 60-min MDI magnetograms are available. |
| In the text | |
|
Fig. 2 Comparison of the model with different data sets: a) PMOD composite (1996–2009); b) PMOD composite (1999–2009); c) TIM; e) ACRIM II, and of the PMOD composite with the measurements by the two other individual instruments: d) TIM and f) ACRIM II. The coloured straight lines show the slopes of the linear regressions between the compared sets. The dashed black line shows the expected ideal slope of 1. In each panel, the corresponding correlation coefficient, Rc, and the slope are indicated. |
| In the text | |
|
Fig. 3 Difference in W/m2 between the model and the data: PMOD (blue), ACRIM II (pine green), TIM (light green), and between the PMOD and the other two data sets: ACRIM II (orange) and TIM (cyan). Dots show values for individual days, whereas bigger symbols represent bins of five individual points. The corresponding trends with time are indicated by the straight lines and are listed in the right top corner. The vertical black lines show the beginning and the end dates of the period without regular contact with SoHO. |
| In the text | |
|
Fig. 4 Monthly smoothed TSI measurements by PMO6V (light blue line), DIARAD (light green line) and from the PMOD composite (dark blue dotted line). The PMO6V and DIARAD data were shifted to fit the mean PMOD level after 1999. The red line shows the difference between DIARAD and PMO6V shifted by 1365 W/m2. The black dashed line marks the difference between SATIRE-S and PMOD in the period before regular contact with SoHO was lost. The vertical black lines mark the beginning and the end dates of the period without regular contact with SoHO. |
| In the text | |
Current usage metrics show cumulative count of Article Views (full-text article views including HTML views, PDF and ePub downloads, according to the available data) and Abstracts Views on Vision4Press platform.
Data correspond to usage on the plateform after 2015. The current usage metrics is available 48-96 hours after online publication and is updated daily on week days.
Initial download of the metrics may take a while.