Fig. 2
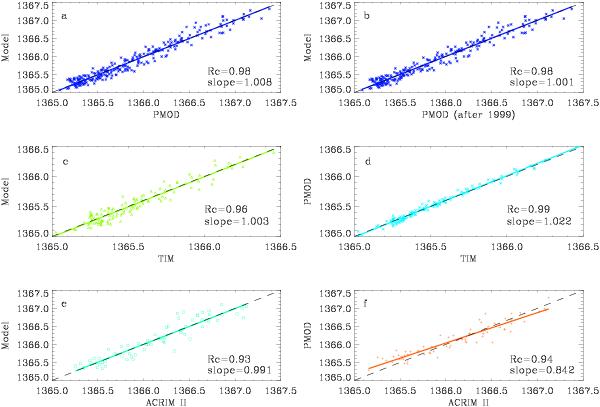
Comparison of the model with different data sets: a) PMOD composite (1996–2009); b) PMOD composite (1999–2009); c) TIM; e) ACRIM II, and of the PMOD composite with the measurements by the two other individual instruments: d) TIM and f) ACRIM II. The coloured straight lines show the slopes of the linear regressions between the compared sets. The dashed black line shows the expected ideal slope of 1. In each panel, the corresponding correlation coefficient, Rc, and the slope are indicated.
Current usage metrics show cumulative count of Article Views (full-text article views including HTML views, PDF and ePub downloads, according to the available data) and Abstracts Views on Vision4Press platform.
Data correspond to usage on the plateform after 2015. The current usage metrics is available 48-96 hours after online publication and is updated daily on week days.
Initial download of the metrics may take a while.