Fig. 4
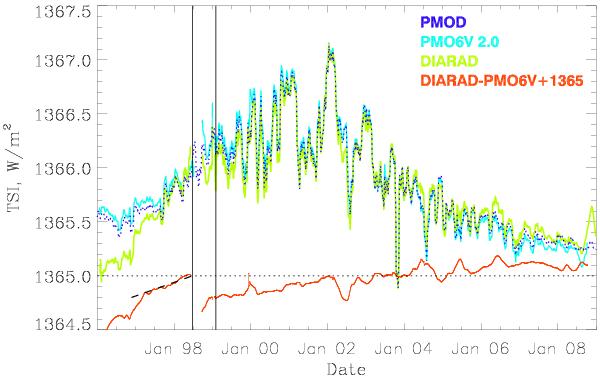
Monthly smoothed TSI measurements by PMO6V (light blue line), DIARAD (light green line) and from the PMOD composite (dark blue dotted line). The PMO6V and DIARAD data were shifted to fit the mean PMOD level after 1999. The red line shows the difference between DIARAD and PMO6V shifted by 1365 W/m2. The black dashed line marks the difference between SATIRE-S and PMOD in the period before regular contact with SoHO was lost. The vertical black lines mark the beginning and the end dates of the period without regular contact with SoHO.
Current usage metrics show cumulative count of Article Views (full-text article views including HTML views, PDF and ePub downloads, according to the available data) and Abstracts Views on Vision4Press platform.
Data correspond to usage on the plateform after 2015. The current usage metrics is available 48-96 hours after online publication and is updated daily on week days.
Initial download of the metrics may take a while.