Fig. 3
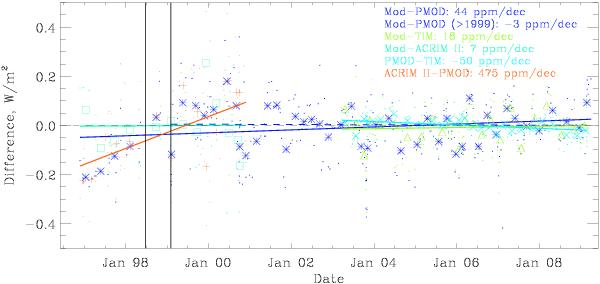
Difference in W/m2 between the model and the data: PMOD (blue), ACRIM II (pine green), TIM (light green), and between the PMOD and the other two data sets: ACRIM II (orange) and TIM (cyan). Dots show values for individual days, whereas bigger symbols represent bins of five individual points. The corresponding trends with time are indicated by the straight lines and are listed in the right top corner. The vertical black lines show the beginning and the end dates of the period without regular contact with SoHO.
Current usage metrics show cumulative count of Article Views (full-text article views including HTML views, PDF and ePub downloads, according to the available data) and Abstracts Views on Vision4Press platform.
Data correspond to usage on the plateform after 2015. The current usage metrics is available 48-96 hours after online publication and is updated daily on week days.
Initial download of the metrics may take a while.