| Issue |
A&A
Volume 527, March 2011
|
|
|---|---|---|
| Article Number | L6 | |
| Number of page(s) | 4 | |
| Section | Letters | |
| DOI | https://doi.org/10.1051/0004-6361/201016217 | |
| Published online | 02 February 2011 | |
Letter to the Editor
Asymmetries in the type IIn SN 2010jl⋆
1
European Organization for Astronomical Research in the Southern Hemisphere
(ESO), Karl-Schwarzschild-Str. 2,
85748
Garching b. München,
Germany
e-mail: fpatat@eso.org
2
Max-Planck-Institut für Astrophysik, Karl-Schwarzschild-Str. 1, 85741
Garching b. München,
Germany
3
Istituto Nazionale di Astrofisica, Osservatorio Astronomico di
Padova, v. Osservatorio n.5, 35122
Padua,
Italy
4
Queen’s University, Belfast BT7 1NN, Northern Ireland,
UK
5
INAF, Telescopio Nazionale Galileo.
Rambla José Ana Fernández Pérez 7, 38712 Breña Baja, TF, Spain
Received:
26
November
2010
Accepted:
13
January
2011
Aims. We study possible signs of asymmetry in the luminous type IIn SN 2010jl, to obtain independent information about its explosion geometry.
Methods. We performed optical linear spectropolarimetry of SN 2010jl two weeks after the discovery, in the spectral range 3700–8800 Å.
Results. The object exhibits a continuum polarization at a very significant and almost constant level (1.7–2.0%). Distinctive line depolarization is seen at the positions of the strongest emission features, such as Hα and Hβ. This implies that the line forming region is well above the photosphere. The continuum polarization level (1.7–2.0%) indicates a substantial asphericity, of axial ratio ≤ 0.7. The almost complete depolarization seen at Hα is indicative of a very low level of interstellar polarization (≤0.3%). This rules out the presence of relevant amounts of dust in the progenitor environment at the time of our observations. From a polarimetric point of view, SN 2010jl appears to be very similar to the two other well-studied type IIn SNe 1997eg and 1998S, establishing a strong link between members of this class of objects.
Key words: supernovae: general / supernovae: individual: SN 2010jl / dust, extinction / techniques: polarimetric
Based on observations collected at the German-Spanish Astronomical Center, Calar Alto, jointly operated by the Max-Planck-Institut für Astronomie Heidelberg and the Instituto de Astrofisica de Andalucia (CSIC).Also based on observations made with the Italian Telescopio Nazionale Galileo (TNG) operated by the Fundaciòn Galileo Galilei of the Istituto Nazionale di Astrofisica.
© ESO, 2011
1. Introduction
Type IIn supernovae (SNe) are characterized by intense, composite-profile emission lines, and by the absence of the broad P-Cygni absorption troughs that are the distinguishing feature of classical type II SNe (Schlegel 1990). The early spectra of these objects are explained in terms of a strong interaction between the rapidly expanding SN ejecta and dense, slowly moving circumstellar medium, fed by a significant mass loss undergone by the progenitor star (Chugai 1997). However, many questions about these objects, i.e. the mass loss history of their progenitors, the geometry of the explosion, and of the circum-stellar material (CSM) remain unanswered. With its unique ability to derive geometrical information, spectropolarimetry constitutes an independent way of attacking these open issues.
The bright SN 2010jl was discovered on November 3.5 UT, 2010 (Newton & Puckett 2010). A spectrum obtained on November 5 revealed it to be a type IIn (Benetti et al. 2010), with the typical, multi-component emission lines of hydrogen, and weaker helium features. On the basis of archival images of the explosion site, Smith et al. (2010) concluded that the progenitor was probably a massive star, with an initial mass higher than 30 M⊙. The object was detected on the rising part of the light curve in images obtained 25 days before the epoch of discovery (Stoll et al. 2010), implying that the explosion occurred at least a month earlier. Soon after the SN was announced, we started an optical/near-IR follow-up using a number of ground-based facilities. The results will be presented and discussed elsewhere. In this Letter, we focus on the spectropolarimetry of SN 2010jl obtained about two weeks after its discovery.
2. Observations and data reduction
We observed SN 2010jl on November 18.2 UT, i.e. 14.7 days after its discovery, using the Calar Alto Faint Object Spectrograph (CAFOS), mounted at the 2.2 m telescope in Calar Alto, Spain (Meisenheimer 1998). In this multi-mode instrument, polarimetry is performed by introducing into the optical path a Wollaston prism and a super-achromatic half-wave plate (HWP). To reduce some known instrumental problems (see Patat & Romaniello 2006), we used four half-wave plate angles (0, 22.5, 45, and 67.5 degrees). All spectra were obtained with the low-resolution B200 grism coupled with a 1.0 arcsec slit, giving a spectral range 3300–8900 Å, a dispersion of ~4.7 Å px-1, and a FWHM resolution of 14.0 Å (640 km s-1 at Hα). For each HWP angle we obtained two exposures each of 20 min. The resulting signal-to-noise ratio (hereafter S/N) per pixel on the single beam is ~180 at 5000 Å. Data were bias and flat-field corrected, and wavelength calibrated using standard tasks within IRAF. Stokes parameters (Q, U), linear polarization degree (P), and position angle (θ) were computed by means of specific routines written by ourselves. Finally, polarization bias correction and error estimates were performed following the prescriptions described by Patat & Romaniello (2006). The HWP zero-point angle chromatism was derived using the polarization standard star BD+59d389 (P(V) = 6.7 ± 0.2%, θ = 98.1 degrees; Schmidt et al. 1992), observed on November 18.8 UT with the same instrumental setup. Instrumental polarization was analyzed using the unpolarized star HD 14069 (P(V) = 0.02 ± 0.02%; Schmidt et al. 1992), and found to vary very slowly as a function of wavelength between 0.3% and 0.4%. Once this correction is applied to the data of BD+59d389, the resulting linear polarization degree is consistent with the published values to within 0.1% (for a full characterization of the CAFOS polarimeter see Patat & Taubenberger (in preparation). To increase the signal-to-noise ratio, the final Stokes parameters were binned in ~51.2 Å wide bins (11 pixels). This resulted in a nominal rms error in the polarization of 0.1% at 5000 Å, where the continuum signal-to-noise ratio per resolution element reaches its maximum (580). Flux calibration was achieved by observing a spectrophotometric standard star with the polarimetric optics inserted. Absolute fluxes were scaled using broad-band photometry. Wavelengths were corrected to the rest frame by adopting a recession velocity of 3214 km s-1 for the host galaxy (Koribalski et al. 2004).
3. Reddening and interstellar polarization
The extinction arising within the Milky Way along the line of sight to SN 2010jl is very small (EB − V = 0.027, Schlegel et al. 1998). The inspection of a high resolution spectrum (λ/Δλ ~ 46 000) obtained with the SARG Echelle Spectrograph at the TNG on November 7, 2010 shows very weak Na i D lines at about zero velocity. The equivalent width (EW) of the D2 component is smaller than 100 mÅ, implying that EB − V < 0.02 (Munari & Zwitter 1997). Therefore, the limit on interstellar polarization (ISP) within the Galaxy is PMW ≤ 0.2% (Serkowski et al. 1975; Whittet et al. 1992). The compilation of Heiles (1999) contains two stars within 3 degrees from the position of UGC 5189A. Both have P = 0.05%, in full agreement with the low Galactic extinction along the line of sight. Interstellar Na i D lines are detected in the high resolution spectrum at ~3120 km s-1, possibly resulting from multiple components within 50 km s-1. The total EW of the D2 line is 0.20 ± 0.02 Å, implying that EB − V = 0.03 for a MW dust/gas mixture (Munari & Zwitter 1997). Although there is mounting evidence that the Serkowski law is not universal (Leonard & Filippenko 2001; Leonard et al. 2002; Maund et al. 2007; Patat et al. 2009; 2010), we reckon that it is very plausible the ISP in the host galaxy is small, most likely below 0.3%. For this reason, we assume in the following that the ISP negligible. This assumption is independently bolstered by the lack of reddening evidence in the flux spectrum (see Sect. 4), and the almost complete depolarization observed at the peak of Hα (see Sect. 5.2).
 |
Fig. 1 Spectropolarimetric data for SN 2010jl. From top to bottom: unbinned total flux spectrum (log F(λ) in erg s-1 cm-2 Å-1), linear polarization degree, Stokes parameters Q (upper) and U (lower), and polarization position angle on the plane of the sky. The thin solid curve in the top panel is the best-fit black-body curve corrected for Galactic reddening (see text). |
4. Flux spectrum
The total flux spectrum of SN 2010jl shown in Fig. 1 (top panel) is characterised by emission lines of H, He, and CNO elements superimposed on a blue continuum. This is closely matched by a black-body of ~7000 K after correcting for Galactic reddening. With this correction, there is no additional need for host-galaxy reddening or multiple-temperature components (see the discussion in Smith et al. 2010). This is fully in line with the low reddening implied by the measured Na i D EWs (Sect. 3). As often found in SNe IIn, a de-blending of the Hα emission reveals a broad component of ~10 500 km s-1FWHM, with a blue-shift of ~580 km s-1and an integrated flux of 6.8 × 10⁻¹³ erg cm-2 s-1. An intermediate (~2400 km s-1) and an unresolved component (~640 km s-1) are also present. We note that, based on higher resolution spectra, Smith et al. (2010) resolved the narrow component at 120 km s-1FWHM. A similar width is measured in our TNG-SARG spectrum. The low CSM velocity (~50 km s-1) inferred from the narrow P-Cyg profile is remarkable (Fig. 2, upper right inset). This value is comparable to typical RSG wind speeds, rather than those of LBVs. We discuss this in detail in our forthcoming paper (see also Smith et al. 2010). Apart from the Balmer series of hydrogen, narrow unresolved emission lines of [O ii] λ3727, [O iii] λλ4959,5007, [N ii] λ5755, He iλ5876, and He iλ7065 are also detected. For the He i lines, underlying broader components can be discerned. There is also weak evidence of He iiλ4686, He iλ7281, and [O ii] λλ7320,7330. In general, SN 2010jl is spectroscopically very similar to other well studied type IIn events, such as SN 2007rt (Trundle et al. 2009 and references therein).
5. Spectropolarimetry
5.1. Continuum polarization
The continuum appears to be polarized at a very significant level across the whole spectral range (Fig. 1). With the remarkable exceptions of regions dominated by the main emission lines (see next section), the polarization degree is roughly constant. The mean level estimated for different portions of the continuum is: 2.00 ± 0.04% (3800–4600 Å), 2.02 ± 0.05% (5000–5600 Å), and 1.67 ± 0.03% (6900–8400 Å). The polarization is on average slightly higher in the blue than in the red. The analysis of the Q − U plane reveals that the data strongly cluster around one single point, and that there is no statistically significant correlation between Q and U. The averages within the spectral range 4000–8000 Å are 0.02 ± 0.03% and −1.77 ± 0.03% for Q and U, respectively (the rms deviation from the mean value is 0.3% for both parameters). For this reason, the position angle is almost constant as a function of wavelength (see also Fig. 1, bottom panel). The average values measured on the continuum in the same ranges as above are 140.9 ± 0.9, 132.1 ± 1.0, and 136.0 ± 0.9 degrees, respectively (with RMS deviations of 3.5, 3.3, and 5.2 degrees). The polarized signal is almost completely carried by the U component.
5.2. Line polarization
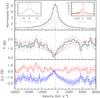 |
Fig. 2 Spectropolarimetry of the Hα line (unbinned data). Top panel: continuum normalized flux profile. The thin curves trace the narrow (dotted), intermediate (dashed), and broad (dotted-dashed) components. The solid curve is the sum of the three. The insets show the high-resolution SARG spectrum (right), and the broad Hα component (left). Mid panel: polarization degree. The thin solid line traces the depolarization expected for dilution by the full line profile, while the dashed line is the same for the intermediate and narrow components only. Bottom panel: Stokes parameters Q (upper) and U (lower). |
Significant depolarizations are observed at the positions of the main emission features Hα, Hβ, Hγ, and He i 5876 Å (Fig. 1). The level of depolarization appears to be related to the line intensity, which provides strong evidence that continuum dilution is the responsible mechanism. Given the marked enhancement in the signal-to-noise across the Hα emission, this line can be studied at full spectral resolution (640 km s-1). The polarization profile is roughly symmetric, and P departs from the continuum level (~1.7%) at about ± 3000 km s-1 (i.e. where the intermediate component begins to dominate over the broad one), to reach a minimum (0.12 ± 0.20%) around − 250 km s-1, which is slightly blue-shifted with respect to the total flux profile (Fig. 2). Under the hypothesis that the emission line is unpolarized, the polarization across the profile can be computed using the semi-empirical relation proposed by McLean & Clarke (1979). The result is plotted in Fig. 2 (mid panel, thin solid curve). Although the polarization level at the center of the line is reproduced well, the wings of the line display a residual polarization. A much closer match is obtained by considering only the intermediate and narrow components (mid panel, dashed curve). This suggests that the broad component is polarized to some extent (see also Sect. 6). All the variation takes place along the U component (Fig. 2, bottom panel). Since Q is close to 0, the points in the Q − U plane move along the U axis, so that the position angle remains constant across the line profile. This is what is expected for simple continuum depolarization dilution (see for instance Hoffman et al. 2008). A similar behavior is seen (within the signal-to-noise) in the Hβ line, where the polarization is ~1% at the line center. Dust above the line forming region (e.g. in the circum- or inter-stellar environment) would polarize the light irrespective of its origin. i.e. affecting both the adjacent continuum and the line. Admittedly, depending on its position angle, the ISP could also act as a depolarizer. However, to have a null net polarization, the component of the IS Stokes vector perpendicular to the intrinsic polarization needs to have a fine tuned value, which makes this possibility rather unlikely. We note that if this were the case, then the intrinsic polarization would be higher than that observed. The almost complete depolarization seen at the center of Hα is strongly suggestive of a negligible ISP, thus confirming the expectations based on reddening considerations (Sect. 3).
6. Discussion
As type IIn events are only 6–9% of all core-collapse SNe (Li et al. 2010), and the technique requires very high signal-to-noise data, spectropolarimetry of this class of objects is rare (Wang & Wheeler 2008). The only two published cases are those of SNe 1997eg (Hoffman et al. 2008), and 1998S (Leonard et al. 2000; Wang et al. 2001), which reached a comparable absolute magnitude (MV ~ −18.6), i.e. significantly fainter than the peak magnitude attained by SN 2010jl (MV ≈ − 20, Smith et al. 2010; Stoll et al. 2010). Besides being brighter, SN 2010jl differs substantially from these two events, in that its light curve is much flatter (Stoll et al. 2010), and reminiscent SN 1988Z (Turatto et al. 1993). Although the analysis was difficult because of the uncertainty in the ISP correction, in the earliest epochs the two objects displayed a significant and almost constant continuum polarization (2.0–2.6%), characterized by a constant position angle. In addition, pronounced line depolarizations were observed at the positions of the most prominent emission lines (Leonard et al. 2000; Wang et al. 2001; Hoffman et al. 2008). Notwithstanding the photometric differences, our data show that SN 2010jl conforms strikingly well to this behavior, implying that there is a common geometry of the explosion or, more in general, of the environment in which the explosion takes place. The basic physical findings from the early-time data are: i) the wavelength-independent continuum polarization; ii) the constant position angle; and iii) the strong line depolarization. These place SNe IIn in a very special niche within the SN polarimetric zoo (see Wang & Wheeler 2008, for a general review). The most natural source of wavelength-independent linear polarization in a stellar envelope is Thomson scattering by free electrons. In this context, a non-null net polarization is indicative of an asymmetry in the continuum-emitting region. In the case of an axisymmetric geometry, this would produce a wavelength-independent polarization angle (perpendicular to the major axis). Under the assumption of a spheroidal electron-scattering atmosphere, the level of polarization measured in SN 2010jl (~2%) is indicative of substantial asphericity, of axial ratio ≤ 0.7 (Höflich 1991). This value is very similar to those derived for the other two known cases (Leonard et al. 2000; Hoffman et al. 2008). As first proposed by Leonard et al. (2000), the simplest explanation for the line depolarization in type IIn SNe is the dilution of polarized continuum light by unpolarized line recombination emission, which has to take place well above the photosphere, in a region where electron scattering becomes negligible. This picture was complicated by the detection of a different behavior in the narrow component, suggesting a different geometry for the regions where these lines form (Leonard et al. 2000; Wang et al. 2001; Hoffman et al. 2008). As the narrow component is not resolved in our spectra, we cannot address this issue. However, we note that while the core of the Hα profile (corresponding to the narrow and intermediate components) is depolarized, this is not the case for the wings at velocities larger than 3000 km s-1 (see Sect. 5.2). This might be understood in the scenario proposed by Chugai (2001) for the early phases, where the narrow component is essentially unpolarized, while the broad wings are the result of electron scattering. In this picture, the broad component does not arise in the reverse-shocked ejecta (as commonly assumed), but rather in a dense, fully ionized CSM shell dominated by electron scattering, where the photosphere would also reside. A closer inspection of the binned Hα profile indeed shows a polarization bump (mostly in the Q parameter), spanning the full breadth of the broad component (Fig. 1), and peaking at ~ 0.4 ± 0.1% above the adjacent continuum polarization level. The change in θ seen across the bump implies that the geometries of the photosphere and the broad line-forming region differ. There is also an excess of polarization on the blue wing, similar to that seen in SN 2007eg. This possibly indicates that the receding side of the scattering region is obscured either by its approaching side or the ejecta (Hoffman et al. 2008). In a scenario where continuum polarization is acquired within the CSM, spectropolarimetry can hardly provide information about the asymmetry of the explosion itself. As a consequence, the high level of continuum polarization observed in type IIn SNe would be interpreted as a strong deviation from sphericity in the CSM and, in turn, in the outflow of material during the mass-loss episodes preceding the explosion. This conundrum can be resolved only by using multi-epoch, higher spectral resolution spectropolarimetry, which with 8m-class telescopes should be possible, at least for the most luminous events. This will allow one to distinguish the different behaviors of the various components, and study their evolution
with time, as the ejecta proceed into the CSM. We note that the low polarization level measured at the peak of Hα ( ≤ 0.2%) and the low reddening are inconsistent with the presence of substantial amounts of dust along the line of sight, including the immediate surroundings of the explosion site. Therefore, although a significant quantity of CSM must be present at the epoch of our observations (as revealed by the strong signs of interaction), this material has to have a very low dust content. Whether this is intrinsic or caused by dust evaporation by the UV radiation cannot be established based on the available data.
Acknowledgments
We thank Calar Alto Observatory for allocating DD Time to this project. This work has been conducted in the framework of the European collaboration “SN Variety and Nucleosynthesis Yields”. We are grateful to N. Chugai for helpful discussions.
References
- Benetti, S., Bufano, F., Vinko, J., et al. 2010, CBET, 2536, 1 [NASA ADS] [Google Scholar]
- Chugai, N. N. 1997, Ap&SS, 252, 225 [NASA ADS] [CrossRef] [Google Scholar]
- Chugai, N. N. 2001, MNRAS, 326, 1448 [NASA ADS] [CrossRef] [Google Scholar]
- Heiles, C. 1999, AJ, 119, 923 [Google Scholar]
- Höflich, P. 1991, A&A, 246, 481 [Google Scholar]
- Hoffman, J. L., Leonard, D. C., Chornock, R., et al. 2008, ApJ, 688, 1186 [NASA ADS] [CrossRef] [Google Scholar]
- Koribalski, B.S., Staveley-Smith, L., Kilborn, V. A., et al. 2004, AJ, 128, 16 [NASA ADS] [CrossRef] [Google Scholar]
- Leonard, D. C., Filippenko, A. V., Barth, A. J., et al. 2000, ApJ, 536, 239 [NASA ADS] [CrossRef] [Google Scholar]
- Leonard, D. C., & Filippenko, A. V. 2001, PASP, 113, 920 [Google Scholar]
- Leonard, D. C., Leaman, J., Chornock, R., et al. 2002, ApJ, 124, 2506 [Google Scholar]
- Li, W., Adam, A., Miller, A. A., et al. 2010, MNRAS, submitted [arXiv:1006.4612] [Google Scholar]
- Maund, J. R., Wheeler, J. C., Patat, et al. 2007, MNRAS, 381, 201 [NASA ADS] [CrossRef] [Google Scholar]
- McLean, I. S., & Clarke, D. 1979, MNRAS, 186, 245 [Google Scholar]
- Meisenheimer, K. 1998, User Guide to the CAFOS 2.2 [Google Scholar]
- Munari, U., & Zwitter, T. 1997, A&A, 318, 269 [NASA ADS] [Google Scholar]
- Newton, J., & Puckett, T. 2010, CBET, 2532, 1 [NASA ADS] [Google Scholar]
- Patat, F., & Romaniello, M. 2006, PASP, 118, 146 [NASA ADS] [CrossRef] [Google Scholar]
- Patat, F., Baade, D., Höflich, P., et al. 2009, A&A, 508, 229 [NASA ADS] [CrossRef] [EDP Sciences] [Google Scholar]
- Patat, F., Maund, J.R., Benetti, S., et al. 2010, A&A, 510, A108 [NASA ADS] [CrossRef] [EDP Sciences] [Google Scholar]
- Serkowski, K., Matheson, D. S., & Ford, V. L. 1975, ApJ, 196, 261 [NASA ADS] [CrossRef] [Google Scholar]
- Schlegel, E. M. 1990, MNRAS, 244, 269 [NASA ADS] [Google Scholar]
- Schlegel, D. J., Finkbeiner, D. P., & Davis, M. 1998, ApJ, 500, 525 [NASA ADS] [CrossRef] [Google Scholar]
- Schmidt, G. D., Elston, R., & Lupie, O. L. 1992, 104, 1563 [Google Scholar]
- Smith, N., Li, W., Miller, A. A. et al. 2010, ApJ, submitted [arXiv:1011.4150v1] [Google Scholar]
- Stoll, R., Prieto, J. L., Stanek, K. Z., et al. 2010, ApJ, accepted [arXiv:1012.3461] [Google Scholar]
- Trundle, C., Pastorello, A., Benetti, S., et al. 2009, A&A, 504, 945 [NASA ADS] [CrossRef] [EDP Sciences] [Google Scholar]
- Turatto, M., Cappellaro, E., Danziger, I. J., et al. 1993, MNRAS, 262, 128 [NASA ADS] [CrossRef] [Google Scholar]
- Wang, L., & Wheeler, J. C. 2008, ARAA, 46, 433 [Google Scholar]
- Wang, L., Howell, D. A., Höflich, P., et al. 2001, ApJ, 550, 1030 [NASA ADS] [CrossRef] [Google Scholar]
- Whittet, D. C. B., Martin, P. G., Hough, J. H., et al. 1992, ApJ, 386, 562 [NASA ADS] [CrossRef] [Google Scholar]
All Figures
|
Fig. 1 Spectropolarimetric data for SN 2010jl. From top to bottom: unbinned total flux spectrum (log F(λ) in erg s-1 cm-2 Å-1), linear polarization degree, Stokes parameters Q (upper) and U (lower), and polarization position angle on the plane of the sky. The thin solid curve in the top panel is the best-fit black-body curve corrected for Galactic reddening (see text). |
| In the text | |
|
Fig. 2 Spectropolarimetry of the Hα line (unbinned data). Top panel: continuum normalized flux profile. The thin curves trace the narrow (dotted), intermediate (dashed), and broad (dotted-dashed) components. The solid curve is the sum of the three. The insets show the high-resolution SARG spectrum (right), and the broad Hα component (left). Mid panel: polarization degree. The thin solid line traces the depolarization expected for dilution by the full line profile, while the dashed line is the same for the intermediate and narrow components only. Bottom panel: Stokes parameters Q (upper) and U (lower). |
| In the text | |
Current usage metrics show cumulative count of Article Views (full-text article views including HTML views, PDF and ePub downloads, according to the available data) and Abstracts Views on Vision4Press platform.
Data correspond to usage on the plateform after 2015. The current usage metrics is available 48-96 hours after online publication and is updated daily on week days.
Initial download of the metrics may take a while.