| Issue |
A&A
Volume 526, February 2011
|
|
|---|---|---|
| Article Number | A82 | |
| Number of page(s) | 9 | |
| Section | Interstellar and circumstellar matter | |
| DOI | https://doi.org/10.1051/0004-6361/201015727 | |
| Published online | 24 December 2010 | |
A multi-wavelength study of the unidentified TeV gamma-ray source HESS J1626−490
1
Erlangen Centre for Astroparticle Physics, Universität
Erlangen-Nürnberg,
Erwin-Rommel-Str. 1,
91058
Erlangen,
Germany
e-mail: This email address is being protected from spambots. You need JavaScript enabled to view it.
2
School of Chemistry and Physics, University of Adelaide,
Adelaide
5005,
Australia
3
Department of Astrophysics, Nagoya University,
Furocho, Chikusaku,
Nagoya
464-8602,
Japan
4
CEA Saclay, DSM/IRFU, 91191
Gif-Sur-Yvette Cedex,
France
Received: 9 September 2010
Accepted: 6 November 2010
Abstract
Aims. To explore the nature of the unidentified very-high-energy (VHE, E > 100 GeV) gamma-ray source HESS J1626−490, we investigated the region in X-ray, sub-millimeter, and infrared energy bands.
Methods. So far only detected with the HESS array of imaging atmospheric Cherenkov telescopes, HESS J1626−490 could not be unambiguously identified with any source seen at lower energies. Therefore, we analyzed data from an archival XMM-Newton observation, pointed towards HESS J1626−490, to classify detected X-ray point sources according to their spectral properties and their near-infrared counterparts from the 2MASS catalog. Furthermore, we characterized in detail the diffuse X-ray emission from a region compatible with the extended VHE signal. To characterize the interstellar medium surrounding HESS J1626−490 we analyzed 12CO(J = 1−0) molecular line data from the Nanten Galactic plane survey, H i data from the Southern Galactic Plane Survey (SGPS) and Spitzer data from the GLIMPSE and MIPSGAL surveys.
Results. None of the detected X-ray point sources fulfills the energy requirements to be considered as the synchrotron radiation counterpart to the VHE source assuming an inverse-Compton (IC) emission scenario. We did not detect any diffuse X-ray excess emission originating in the region around HESS J1626−490 above the Galactic background and the derived upper limit for the total X-ray flux disfavors a purely leptonic emission scenario for HESS J1626−490. We found a good morphological match between molecular and atomic gas in the −27 km s-1 to −18 km s-1 line-of-sight velocity range and HESS J1626−490. The cloud has a mass of 1.8 × 10⁴ M⊙ and is located at a mean kinematic distance of d = 1.8 kpc. Furthermore, we found a density depression in the H i gas at a similar distance, which is spatially consistent with the SNR G335.2+00.1. We discuss various scenarios for the VHE emission, including the CO molecular cloud being a passive target for cosmic ray protons accelerated by the nearby SNR G335.2+00.1.
Key words: acceleration of particles / ISM: supernova remnants / ISM: clouds / ISM: individual objects: HESS J1626-490 / X-rays: ISM / submillimeter: ISM
Now at Laboratoire d’Annecy-le-Vieux de Physique des Particules (LAPP), Université de Savoie, CNRS/IN2P3, 74941 Annecy-Le-Vieux, France.
© ESO, 2010
1. Introduction
During scans of the Galactic plane with the Imaging Atmospheric Cherenkov Telescopes (IACTs) of the HESS (High Energy Stereoscopic System) array a number of new Galactic very high energy (VHE, E > 100 GeV) γ-ray sources were detected (Aharonian et al. 2005a, 2006a). Many of these sources could be identified as pulsar wind nebulae (PWN), shell-type supernova remnants (SNR), γ-ray binaries, molecular clouds, or active Galactic nuclei (AGN). However, there are still a few TeV sources that could not be unambiguously associated with any source detected in lower energy bands (see, e.g., Aharonian et al. 2008a). In recent efforts to investigate these “dark” VHE emitters, multi-wavelength observations were conducted to probe the environment of these particle accelerators (for recent work, see, e.g., Aharonian et al. 2008b,c).
HESS J1626−490 is another VHE gamma-ray source of unknown origin, which so far could not be identified with a source at lower wavelengths. This object, with an intrinsic extension of ~5 arcmin (Gaussian FWHM), is located right on the Galactic plane (RA: 16h26m04s, Dec: −49°05′13″) and was detected by HESS with a peak significance of 7.5σ (Aharonian et al. 2008a). It is also stated that the source might be composed of two separate sources owing to the long tail extending towards the east. These authors measured a power-law spectrum with a photon index of 2.2 ± 0.1stat ± 0.2sys and a flux normalization of (4.9 ± 0.9) × 10-12 cm-2 s-1 TeV-1at 1 TeV at energies between 0.5 TeV and 40 TeV. A number of possible counterparts from other wavelengths are discussed by (Aharonian et al. 2008a), such as the nearby faint extended ROSAT source 1RXS J162504−490918 (Voges et al. 1999), the shell-type SNR G335.2+00.1 (Whiteoak & Green 1996), and despite their large offsets, the X-ray binaries (XRBs) 4U 1624-490 and IGR 16283-4838. Furthermore, the high-energy (HE) source 1FGL J1626.0−4917c from the one-year Fermi source catalog (1FGL, Abdo et al. 2010) lies in close proximity to HESS J1626−490.
The two physical mechanisms thought to produce VHE gamma rays are inverse-Compton (IC) upscattering of low-energy photons by a population of relativistic electrons, as well as production and subsequent decay of π°s when high-energy hadrons interact with a dense medium. The latter, purely hadronic scenario becomes more viable in cases where the VHE emission correlates with the location of dense molecular clouds (e.g. towards the Galactic Center Ridge, Aharonian et al. 2006b) or when SNRs interact with the surrounding interstellar medium (ISM) as seen with HESS from W28 and other SNRs (Aharonian et al. 2008c; Feinstein et al. 2009) and with VERITAS and MAGIC from IC 443 (Acciari et al. 2009; Albert et al. 2007). In an IC scenario, X-ray emission coinciding with the VHE signal is expected due to synchrotron radiation from the same lepton population, whereas only a very low X-ray flux is predicted for a purely hadronic scenario arising from synchrotron cooling and/or nonthermal bremsstrahlung from secondary electrons produced in the decay of charged pions (see e.g. Gabici et al. 2009).
In this work we analyzed the data of an archival XMM-Newton observation to search for an X-ray counterpart of HESS J1626−490. Therefore, we classified the detected X-ray point sources in the vicinity of HESS J1626−490 and searched for possible diffuse excess emissions above the expected Galactic background. Furthermore, we present 12CO(J = 1–0) molecular line survey data taken with the Nanten mm/sub-mm observatory to scan for molecular clouds and infrared data from the Spitzer GLIMPSE and MIPSGAL surveys to search for indications of recent star-forming activity.
2. X-ray data analysis and results
We retrieved the EPIC (European Photon Imaging camera) data of an archival XMM-Newton (Jansen et al. 2001) observation (ID: 0403280201), pointed to the position of HESS J1626−490. The EPIC-MOS (Turner et al. 2001) and EPIC-PN (Strüder et al. 2001) data were analyzed with the XMM-Newton Science Analysis System (SAS) version 9.0.0, supported by tools from the FTOOLS package and XSPEC version 12.5.0 (Arnaud 1996) for spectral modeling. For image processing, we used some tools from the CIAO 4.0 software package.
This observation was affected by long intervals of strong background flaring. To clean the data we applied a background good-time-interval (GTI) screening based on the full field-of-view (FoV) 7–15 keV light curve provided by the standard processing chain. We used thresholds of 8 cts/s for PN and 3 cts/s for MOS and the resulting net exposures are 4.9 ks for PN and 13.2 ks for MOS, respectively. For all spectra and images presented in the following sections, we selected good (FLAG==0) single and multiple events: PATTERN ≤ 4 (PN), PATTERN ≤ 12 (MOS).
2.1. X-ray point sources
Even though Aharonian et al. (2008a) detected HESS J1626−490 with an intrinsic extension of ~0.1°, we first characterized possible point-like X-ray counterparts. The SAS standard maximum likelihood technique for source detection was used in several energy bands: 0.2–0.5 keV, 0.5–1.0 keV, 1.0–2.0 keV, 2.0–4.5 keV, 4.5–10.0 keV, and 0.5–10.0 keV. The resulting point source list indicates a detection threshold of 2 × 10-14 erg cm-2 s-1. Within the 4σ contours of HESS J1626−490, we detected twelve X-ray point sources (see Fig. 1). For five of these sources (1, 5, 7, 8, and 9) the photon statistics were sufficient to perform a spectral analysis. The remaining seven objects were classified according to their hardness ratio (HR), which we defined as the normalized difference between high-energy (Hi: 2.0–10.0 keV) and low-energy (Low: 0.2–2.0 keV) counts:  (1)The number of counts in the respective energy bands is the sum over all instruments where the source is detected. A correction for differential vignetting was applied to the HRs. Similar to the Galactic plane X-ray source population studies conducted with XMM-Newton (Hands et al. 2004) and Chandra (Ebisawa et al. 2005), we classified sources as either soft (HR < −0.5), medium (−0.5 < HR < 0.5) or hard (HR > 0.5). To identify near-infrared (NIR) counterparts, we correlated the X-ray point-source positions to the 2MASS all-sky catalog (Skrutskie et al. 2006). Especially for regions on the Galactic plane where the interstellar absorption is very strong, which is the case for HESS J1626−490 (NH ~ 2.22 × 1022 cm-2Dickey & Lockman 1990b), the NIR band is particularly suited to probing deep into the interstellar medium (ISM). We classified an X-ray source from this observation as NIR-identified when a 2MASS catalog entry is found within 2 arcsec of the source position resulting from the SAS source detection algorithm. In the following section we classify the detected point sources as either “soft Galactic” (e.g., X-ray active stars), “hard Galactic” (e.g., cataclysmic variables (CVs), X-ray binaries), or “hard Extra-galactic” (e.g., background AGN), based on the X-ray spectral characteristics and the NIR counterpart. These classifications are meant to reflect general characteristics such as hard/soft or absorbed/unabsorbed, which helps for deriving more accurate fluxes for sources where no spectral analysis was possible.
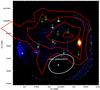 |
Fig. 1 Combined color-coded image from the PN and MOS detectors. Energy intervals for the colors are 0.5–1.0 keV (red), 1.0–2.0 keV (green), and 2.0–4.5 keV (blue). The red contours denote the 7,6,5,4σ statistical significance levels of the HESS detection of HESS J1626−490. Marked are point sources detected within the 4σ VHE contours (numbered 1 to 12 with increasing RA). The dashed ellipse (white) shows the 1σ confidence region of the positional uncertainty of the Fermi source 1FGL J1626.0−4917c. |
Classification of point sources.
2.1.1. Soft Galactic sources
Owing to coronal activity and/or binary interaction, stars can exhibit strong thermal X-ray emission during a wide variety of evolutionary stages (for a compilation of the 100 brightest X-ray stars detected by ROSAT, see Makarov 2003). Therefore, such objects comprise the vast majority of soft Galactic sources. A typical physical model to describe their X-ray spectra is an absorbed multi-temperature thermal plasma (MEKAL in XSPEC) with temperatures in the range of kT = 0.5–2.0 keV. Due to the lack of high interstellar absorption at these short distances and their intrinsically soft spectra, these objects would be classified as soft, according to the HR criterion, mentioned in the previous section. Furthermore, we required an NIR counterpart for an identification as a “soft Galactic” source. According to these criteria, eight of the twelve point sources were classified as “soft Galactic”, and a spectral analysis could be performed on three of them. We calculated the flux for those sources with no spectrum from the 0.5–10.0 keV count-rate assuming an unabsorbed power-law spectrum with photon index 3.0. The X-ray and infrared information for these objects are compiled in Table 1.
Source No. 1 is by far the brightest X-ray point source (FX, unabs = 8.0 × 10⁻¹² erg cm-2 s-1) in the FoV and is spatially coincident with the active triplet system HD 147633= 1RXS J162517.7−490855 (Makarov 2003). This system contains a close binary of two G-type main sequence stars. The X-ray spectrum (Fig. 2) can be well-fit with a 3-temperature thermal plasma emission model (see Table 1). The three plasma temperatures resulting from the fit are compatible with temperatures seen, e.g., from the Castor X-ray triplet (Güdel et al. 2001). We therefore conclude that an identification of Source No. 1 with HD 147633is very likely.
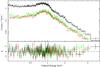 |
Fig. 2 EPIC-PN and EPIC-MOS spectra of source No. 1 with a 3-temperature thermal plasma model (MEKAL, |

2.1.2. Hard Galactic and extra-galactic sources
In contrast to the X-ray emission seen from nearby active stars, the spectra of background AGN and Galactic CVs are intrinsically harder, and, in the case of AGN, heavily absorbed by the interstellar medium in the Galactic plane. According to the hardness-ratio classification scheme, these sources would be medium or hard. For two sources, not classified as “soft Galactic”, an X-ray spectrum could be extracted (Nos. 7 and 9). Both feature hard power-law spectra. Source No. 7 shows a very high absorption column density (NH = 8.8 × 1022 cm-2), which is higher than the Galactic level in that direction (NH = 2.1 × 1022 cm-2, Dickey & Lockman 1990b), so we classify this object as “hard extra-galactic”. In contrast, the spectrum of the NIR identified source No. 9 is much less absorbed, indicating a location in the Galactic plane. We therefore classify this source as “hard Galactic”. The rest of the medium or hard sources were classified as “Galactic” if an NIR counterpart is present, otherwise as “extra-galactic”. We calculated the flux for sources with no spectrum from the 0.5–10.0 keV count rate assuming an absorbed power-law spectrum with photon index 2.0. For “extra-galactic” sources we assumed the total Galactic column density NH = 2.1 × 1022 cm-2, for “Galactic” sources the somewhat lower value NH = 5 × 1021 cm-2. The results for all point sources are shown in Table 1. We note here that in the rare case of hard Galactic sources with no NIR counterpart, such as PWN, these objects would have been wrongly classified as “extra-galactic”.
2.2. Properties of the diffuse X-ray emission
(Aharonian et al. 2008a) approximated the morphology of HESS J1626−490 by fitting a 2-D Gaussian to the VHE excess map. The resulting intrinsic (with the effects of the instrument point-spread-function removed) major and minor axes were 0.1 deg and 0.07 deg, respectively, with a position angle of 3 deg west to north. An IC scenario would predict X-ray emission due to the synchrotron cooling of the same population of electrons. Likely candidates for such a scenario are PWN. For these sources the X-ray nebula is more compact than the VHE source since the high magnetic fields close to the pulsar lead to strong synchrotron cooling. In contrast, the VHE nebula might be dominated by a more extended population of electrons with lower energies and longer cooling timescales. However, as we did not see any obvious extended X-ray counterpart with XMM-Newton we characterized the diffuse X-ray emission seen from a region comparable to the VHE emission.
Before the extraction of events from diffuse regions, we first removed all detected point sources from the dataset. For that purpose we mostly relied on the results from the SAS maximum-likelihood source detection algorithm. Exceptions were very bright sources (e.g. source No. 1), sources at large off-axis angles (e.g. source No. 5), and the out-of-time event column from source No. 1, where we modified or added the respective regions manually. All exclusion regions are shown in Fig. 3.
To estimate of the non-X-ray background (NXB) we used a filter-wheel closed dataset, provided by the EPIC background working group (Carter & Read 2007). To clean the background data of soft proton flares and of contributing observations with a general higher flux level, we applied the same GTI threshold as for the source data (see Sect. 2). However, due to the non-simultaneity of the source and background observations, the particle-induced background level could still be different. At energies above ~12 keV the effective area of the X-ray telescope decreases significantly and the NXB becomes the dominant background component. Thus to improve the estimation of the NXB we derived a scaling factor based on the ratio of the count-rate in the 12–15 keV energy bands between source and background observations (similar to De Luca & Molendi 2004).
To check for possible hard diffuse X-ray excess emission, we extracted an image in the 3–7 keV energy band. We refilled excluded regions using dmfilth and applied the adaptive smoothing algorithm csmooth (Fig. 3). For the kernel size of the smoothing we required a minimum significance of 5σ. As background we subtracted the scaled NXB dataset as described in the previous paragraph.
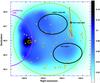 |
Fig. 3 Adaptively smoothed EPIC-PN image of diffuse X-ray flux in the 3–7 keV energy band with a linear color scale (arbitrary units). The instrument FoV is shown as a dashed circle (green). The large ellipses (black) denote the extraction regions for HESS J1626−490 and the background test, respectively. The large circle (magenta) to the east gives the approximate extension of the X-ray scattering halo of 4U 1624-490. Excluded regions are shown as crossed-out areas (yellow regions crossed with red lines). |
Fit results for a 2-T NEI model.
2.2.1. Upper limit for extended X-ray emission from HESS J1626−490
The diffuse image (Fig. 3) shows no significant excess emission above the flat Galactic diffuse component apart from the area at the eastern edge of the FoV, which is discussed in the next section. To derive an upper limit for the total X-ray flux possibly connected to HESS J1626−490 (yellow ellipse in Fig. 3) we extracted a spectrum from that area and compare it to a spectrum extracted from the southern part of the FoV outside the 4σ contours of the VHE detection. For the spectral analysis we used the same exclusion regions as for the extraction of the diffuse image (see Sect. 2.2).
To accurately account for the energy-dependent variation of the effective area over these large regions we applied the weighting method described by Arnaud et al. (2001) to extract the spectra. In accordance with this method we used the on-axis energy response (RMF) and ancillary response files (ARF). As background we subtracted spectra from the identical regions in the NXB dataset using the weighting method as well. Both NXB subtracted spectra are shown in Fig. 4.
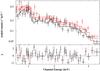 |
Fig. 4 NXB subtracted spectra from the elliptical region centered at HESS J1626−490 (black) and a region in the south of the FoV outside the 4σ contours of HESS J1626−490 (red). The stepped lines show the best-fit of a 2-temperature NEI model. |
Since HESS J1626−490 is right on the Galactic plane, we assumed that the observed emission from both regions is of diffuse Galactic origin. Therefore, we adopted the two-temperature non-equilibrium ionization model (2-T NEI) from Ebisawa et al. (2005, henceforth E05). These authors observed a typical Galactic plane region (Dickey & Lockman 1990b) with Chandra and analyzed the Galactic diffuse emission in great detail. We fixed most of the model parameters at the values from E05 except for the norm and column densities of both temperature components and the Si abundance of the hard component, which would have been significantly overestimated otherwise. We fit both spectra in parallel with this model (Fig. 4), and we only allowed the normalizations to vary separately. The intrinsic surface fluxes were derived by dividing the unabsorbed fluxes by the effective extraction region, which is the region on the detector minus excluded areas, bad pixels/columns, and CCD gaps. For both regions the details of the fitting parameters are listed in Table 2.
The total surface fluxes for both regions agree within 1.5σ, with the flux measured from the test region slightly larger. Therefore, we did not detect any significant X-ray excess emission from the direction of HESS J1626−490 with respect to the test region. Assuming that a possible X-ray signal associated to HESS J1626−490 would originate in a region with the same extension as the VHE signal and that an excess flux greater than 4σ above the Galactic diffuse emission would be detectable, we derived an upper limit for the X-ray flux in the 1–10 keV band of Fx, excess < 4.85 × 10⁻¹² erg cm-2 s-1. Given the observed background count rate from the ellipse and assuming an absorbed power-law spectral shape with index −2 and column density 1 × 1022 cm-2, the formal 4σ confidence level flux upper limit (1–10 keV) would be ~1 × 10-12 erg cm-2 s-1, somewhat lower than the above value. However, we used the first value as we deem it more realistic for the actual source analysis techniques.
Figure 5 shows the VHE spectral energy distribution (SED) of HESS J1626−490, together with this upper limit, assuming a power-law spectrum with index −2 for the X-ray spectrum. In addition, the spectral uncertainty band of the Fermi source 1FGL J1626.0−4917c is shown (Abdo et al. 2010).
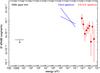 |
Fig. 5 Spectral energy distribution of HESS J1626−490, showing the HESS spectrum as data points with errors (red) (Aharonian et al. 2008a) together with the spectral uncertainty band of 1FGL J1626.0−4917c (Abdo et al. 2010). The XMM-Newton upper limit from this work is denoted by a horizontal line with an arrow (black). |
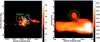 |
Fig. 6 Left: Nanten12CO(J = 1–0) image of the region around HESS J1626−490 (linear scale in K km s-1) integrated over the vLSR range −31 to −18 km s-1. Overlaid are the contours of the VHE emission (blue) and of the H i cloud discussed in Sect. 4 (green). The dashed circle (light blue) denotes the position and extension of SNR G335.2+00.1. Right: Nanten12CO(J = 1–0) Galactic longitude-velocity plot (linear scale in K deg) integrated over the Galactic latitude range −0.33 to 0.14 deg. The 12CO cloud shown in the left image is marked by a dashed circle (green). |
2.2.2. Contamination from the dust-scattering halo of the low-mass X-ray binary 4U 1624-490
As seen in the smoothed image of diffuse X-ray emission 3, the flux level increases towards the eastern edge of the FoV. The dipping low-mass X-ray binary 4U 1624-490 is located ~270 arcsec outside the XMM-Newton FoV, exactly to the east. This source features an extended dust-scattering halo, which was detected with BeppoSAX (Bałucińska-Church et al. 2000) and Chandra (Xiang et al. 2007). According to these authors the halo shows a hard, highly absorbed spectrum (NH = 8–9 × 1022 cm-2) and should reach well inside the XMM-Newton FoV of this observation as denoted by the eastern yellow circular region in Fig. 3. An absorbed power-law fit to the spectrum extracted from the eastern region in the XMM-Newton observation gives a column density of NH = (8.0 ± 2.5) × 1022 cm-2 and a photon index of Γ = 2.3 ± 0.7. These results, together with the apparent circular shape of the excess, confirm the identification of this emission with the dust-scattering halo of 4U 1624-490. The effects of this contamination are very limited to the eastern edge of the FoV and should therefore not influence much the measurements of the diffuse emission from the direction of HESS J1626−490 and the test region.
3. Nanten12CO(J = 1–0) data
To search for molecular clouds, spatially and morphologically coincident with HESS J1626−490, we analyzed 12CO(J = 1–0) molecular line observations performed by the 4 m mm/sub-mm Nanten telescope, located at Las Campanas Observatory, Chile (Mizuno & Fukui 2004). These data were taken as part of the Nanten Galactic Plane Survey (1999 to 2003, Matsunaga et al. 2001, and references therein). The survey grid spacing was 4 arcmin for the region around HESS J1626−490. For this work the local standard of rest velocity (vLSR) range -240 to +100 km s-1 was searched.
Figure 6 (left) shows the Nanten12CO(J = 1–0) image integrated over the vLSR range −31 to −18 km s-1. In this interval we found a 12CO feature partially overlapping with the VHE emission. According to the Galactic rotational model of Brand & Blitz (1993), this vLSR range corresponds to a kinematic distance of 2.2 to 1.5 kpc. As can be seen in the Nanten position-velocity plot (Fig. 6 (right)), this CO cloud seems to be connected to a much larger system of clouds at velocities −32 to −50 km s-1. The 12CO emission at these more distant velocities is much more extended, and we did not find any apparent feature particularly matching the VHE morphology or coinciding with the SNR G335.2+00.1.
Using the relation between the hydrogen column density (NH) and the 12CO(J = 1–0) intensity W(12CO), NH = 1.5 × 10²⁰ [W(12CO)/K km s-1](Strong et al. 2004), we estimate the total mass of this cloud at 1.8 × 10⁴ M⊙ for d = 1.8 kpc within an elliptical region centered at l = 334.78, b = 0.00 with dimensions 0.26 × 0.30 deg. The corresponding average density is 2.1 × 102 cm-3.
4. HI and infrared data
Figure 8 shows H i images of the region around HESS J1626−490 from the Southern Galactic Plane Survey (SGPS McClure-Griffiths et al. 2005) integrated over the vLSR ranges −23 to −18 km s-1 (Left) and −31 to −23 km s-1 (Right), respectively. A local H i density depression is seen in the center of the left image at an angular separation of ~21′ from the CO molecular cloud and HESS J1626−490. It is striking that this feature is consistent in position as well as in angular extension with the SNR G335.2+00.1 (Green 2009; Reach et al. 2006). Furthermore, both images show a region of increased gas density in spatial coincidence with the VHE contours, which is more pronounced in the −31 to −23 km s-1 velocity range. Two dips, most likely due to foreground absorption, are marked by arrows (labeled D1 and D2).
We estimated the mass of the dense H i region coinciding with the VHE and 12CO features using the signal within the same elliptical region as for the CO cloud (Sect. 3). Using the relation between H i intensity and column density from Dickey & Lockman (1990a) (X = 1.8 × 1018 cm-2 K-1 km s-1) we estimated the mass of the cloud as 4.9 × 10³ M⊙ with an average density of 60.1 cm-3. However, we note here that due to the two absorption dips in the region this value should be seen only as a lower limit of the actual mass of the H i cloud.
Figure 7 shows the vLSR profile for this region integrated over the Galactic latitude range −0.11 to 0.24 deg, which is the extension of both the SNR G335.2+00.1 and the VHE emission of HESS J1626−490. Both, the region of low density and the H i cloud are clearly visible. The latter is in good agreement with the position of the CO cloud (Sect. 3), as indicated by the dashed ellipse.
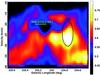 |
Fig. 7 H i SGPS Galactic longitude-velocity plot (linear scale in K deg) integrated over the Galactic latitude range −0.11 to 0.24 deg. The position and extension of the 12CO cloud is denoted by a dashed circle (black). The double arrow (green) shows the Galactic latitude and extension of SNR G335.2+00.1. |
Figure 9 shows a three-color (rgb = 24/8/3.6 μm) image from the Spitzer GLIMPSE and MIPSGAL surveys in log scale (MJy/sr units) with lower limit clipping at (rgb = 30/60/5 MJy/sr). Apart from the large-scale diffuse emission in the red and green bands along the Galactic plane, there are two prominent H ii regions within the 4σ HESS contours. These two H ii regions are coincident with the absorption dips seen in H i (Fig. 8), which is a common feature of many H ii regions in the Galactic plane (see, e.g., Kuchar & Bania 1990). R1 is listed in the catalog of Russeil (2003) (No. 427) with a systemic distance of 2.4 ± 0.3 kpc. Even though R2 is not listed, judging from the similarity of the two absorption dips, the distances to both H ii regions should be quite similar. Both H ii regions are also clearly seen in the Molonglo (Green et al. 1999) 843 MHz radio image shown by (Aharonian et al. 2008a, Fig. 2). The differing distance estimates for the H ii regions and the H i/CO-complex might indicate systematic differences between both methods. In particular this could mean that a large fraction of the mass of the H i cloud is located at a distance more than 1.8 kpc.
5. Discussion
In this work we searched for X-ray, sub-millimeter, and infrared counterparts of the unidentified VHE gamma ray source HESS J1626−490 to explore the nature of the particle acceleration process responsible for the observed emission. With a luminosity of 2 × 1033 erg s-1 × (d/kpc)2, HESS J1626−490 is quite typical of Galactic TeV sources detected by HESS, and we discuss both leptonic and hadronic emission scenarios in this section.
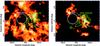 |
Fig. 8 H i SGPS images of the region around HESS J1626−490 (linear scale in K km s-1) integrated over the vLSR ranges −23 to −18 km s-1 (left) and −31 to −23 km s-1 (right), respectively. The dashed circle (white) marks the position and radio extension of SNR G335.2+00.1. Also shown are the HESS VHE contours of HESS J1626−490 (green). The arrows (white, labeled D1 and D2) mark two dips, probably due to foreground absorption. |
According to Reimer et al. (2006), close binary systems consisting of Wolf-Rayet (WR) and/or OB super-giant stars are expected to effectively produce VHE gamma-rays in the colliding wind zone where strong shocks are present and where particle acceleration to multi TeV energies could take place. The nearby triplet system HD 147633(source No. 1, Sect. 2.1.1) is a strong X-ray emitter. Its spectrum can be well fit by a thermal model with temperatures typical of X-ray binaries showing coronal activity. This system is composed of a close binary of two G-type main sequence stars and a tertiary star orbiting at a greater distance (Makarov 2003) and can therefore most likely be ruled out as an efficient source of highly relativistic particles, which could give rise to VHE gamma-ray emission. Apart from that, the extended morphology of HESS J1626−490 makes an identification with an X-ray point-source detected by XMM-Newton rather unlikely.
In the case of a leptonic scenario where low-energy photons are up-scattered by relativistic electrons via the IC process, X-ray emission is expected to accompany the VHE signal arising from synchrotron cooling of the same population of high-energy electrons (Aharonian et al. 1997). Two examples for such sources detected by HESS are the pulsar wind nebulae MSH 15-52 (Aharonian et al. 2005b; Schöck et al. 2010) and HESS J1825-13 (Aharonian et al. 2005c). Even from a first glance at the flux levels in X-rays (~ × 10-13 erg cm-2 s-1 for point sources and ~ × 10-12 erg cm-2 s-1 for diffuse emission) and at VHE energies (~ × 10-11 erg cm-2 s-1), a purely leptonic emission scenario seems unlikely. Following Aharonian et al. (1997) and assuming a typical Galactic magnetic field strength of 3 × 10⁻⁶ G, the corresponding synchrotron photon energy for E = 1 TeV IC photons is ϵ = 0.02 keV. Assuming the same photon index for the synchrotron counterpart as measured from the VHE source (Γ = 2.18) and extrapolating the flux to the 0.5 to 10 keV band, we estimate an integrated source flux of ~1.1 × 10⁻¹¹ erg cm-2 s-1. This flux is a factor of ~25 more than what we measure from any point source, apart from X-ray source No. 1, which was discussed in the previous paragraph. This makes an identification of HESS J1626−490 with any of these sources unlikely. Our upper limit for diffuse X-ray emission (Sect. 2.2.1) is a factor of ~2 lower than the expected value for HESS J1626−490 in a purely leptonic model.
We observed infrared emission from the field around HESS J1626−490 (see Sect. 4) which could provide an additional target radiation field for the IC process. This would lower the expected synchrotron flux in the X-ray band. On the other hand, these estimates are based on the lowest possible magnetic field found in the Galactic ISM. Magnetic fields in the vicinity of energetic pulsars can be a factor of 10–100 larger, which would increase the expected synchrotron flux accordingly. We therefore conclude that a purely leptonic emission scenario is rather unlikely for HESS J1626−490.
Not detecting any X-ray source fulfilling the energetic requirements for a purely leptonic scenario favors a hadronic emission process such as dense clouds in the vicinity of a cosmic particle accelerator. Such a scenario will be discussed in the remaining part of this section. As already mentioned in Sect. 1, dense molecular clouds are established VHE gamma-ray emitters because they provide target material in regions of high cosmic-ray densities. Using data from the Nanten12CO(J = 1–0) Galactic plane survey, we detected a molecular cloud that is morphologically consistent with HESS J1626−490. This object is located at a kinematic distance of ~1.8 kpc. Following Aharonian et al. (1994, Eqs. (2) and (3)), we estimated the required gas density to produce the observed VHE γ-ray signal (Fγ(>0.6 TeV) = 7.5 × 10⁻¹² ph cm-2 s-1 and Γ = 2.2) as n ≈ 10 cm-3 assuming a cosmic ray production efficiency of θ = 0.1 and a distance of d = 1.8 kpc. This value is an order of magnitude lower than the measured 12CO mean density. Thus, this environment would be easily suited to providing the observed VHE γ-ray flux.
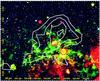 |
Fig. 9 Three-color (rgb = 24/8/3.6 μm) image from the Spitzer GLIMPSE and MIPSGAL surveys in log scale (MJy/sr units) with lower limit clipping at (rgb = 30/60/5 MJy/sr) in Galactic coordinates. Shown are the VHE contours of HESS J1626−490 (white) and two HII regions (red, labeled R1 and R2). |
Following Aharonian (1991) (Eq. (10)), assuming that the observed molecular cloud only provides a “passive” target for cosmic-rays originating in a nearby acceleration site, the cosmic-ray enhancement factor for this source would be kCR = 333 for 10 TeV protons. As seen in Fig. 8 (right) and Fig. 7 there is a region of high-density H i gas spatially coincident with HESS J1626−490 located at vLSR ≈ −25 km s-1. Taking the additional mass of this H i cloud into account as additional target material kCR would be down to ~255 which is an order of magnitude larger than seen from other SNR–ISM interactions (see, e.g., Aharonian et al. 2008c). However, following Aharonian & Atoyan (1996) (Fig. 1b), even cosmic ray enhancements of kCR > 103 are to be expected from molecular clouds at distances <10 pc (as in our case, see next paragraph) from the SNR shell and for diffusion coefficients of D(10 GeV) ~ 1026 cm2 s-1 if the age of the SNR does not exceed 104 to 105 years.
In particular in the left image of Fig. 8, there appears to be a region of higher concentration of H i gas towards the eastern tail of the VHE emission, which in turn could arise from a second VHE source (as already mentioned in Sect. 1). The 12CO emission that traces the denser regions of the cloud does not show two distinct features in a similar way. As this issue cannot be clearly solved based on the current available VHE data, we did not investigate any subregions and only considered the area as a whole.
Now assuming that this 12CO/H i cloud is indeed the source of the observed VHE gamma-rays, a nearby accelerator would be needed. The presence of two prominent H ii regions at distances consistent with the CO/H i clouds (see Sect. 4) indicates massive star formation, hence potential PWNe and SNRs in this area. The nearby density depression seen in H i (see Sect. 4) might indicate the presence of a recent catastrophic event, such as an SNR, giving rise to strong shocks that would have blown the neutral gas out. At d = 1.8 kpc the edge of this region would be at a distance of 8.1 pc from the 12CO/H i cloud. It is striking that this H i feature is consistent in both position and angular extension with the SNR G335.2+00.1 (Green 2009). Using the Σ-D relation Guseinov et al. (2004) estimated the distance to SNR G335.2+00.1 as d = 5 kpc. which conflicts with the identification of SNR G335.2+00.1 with the H i depression seen at a distance of 1.8 kpc. However, the scatter in Σ-D distances for individual sources is quite large (Green 2005) making a positive identification of SNR G335.2+00.1 and the H i depression seen at a kinematic distance of 1.8 kpc very well possible.
We note here that, apart from possible systematic uncertainties in kinematic distance estimates, the projected distance of 8.1 pc should be seen only as a lower limit because the physical separation of accelerator and target could be larger if both objects are not at the same distance to the observer. A hint that this could be the case for this source is that the center of gravity of the CO cloud is slightly shifted in velocity with respect to the H i density depression. A larger distance between the accelerator, most likely SNR G335.2+00.1, and the molecular cloud would lower the expected cosmic ray enhancement.
Even though the angular separation of the Fermi source 1FGL J1626.0−4917c and HESS J1626−490 is relatively small, these sources are not consistent within the 3σ significance level of their spatial uncertainties (see Fig. 1). Furthermore, we did not find any feature in X-rays, CO, or H i that could explain a displacement between HE and VHE gamma-ray emission. 1FGL J1626.0−4917c shows signs of a slight variability. Based on the variability index listed in the 1FGL catalog (Abdo et al. 2010), the chance of the source being a constant emitter can be estimated to <11%, which might indicate an extragalactic origin. Thus it remains unclear at this point whether these two sources are physically connected.
6. Outlook
With the improved angular resolution of next-generation Cherenkov Telescope arrays, it will be possible to study the morphology of the VHE signal and its connection to molecular gas in much more detail. This is crucial for constraining the emission region of VHE γ-rays, which strongly influences any estimation of target mass and density. For the determination of diffuse X-ray fluxes and upper limits, a large effective area combined with a good angular resolution to effectively exclude point-like sources is needed. Therefore, a much deeper exposure (~100 ks) with XMM-Newton would make it possible to significantly improve the constraints on leptonic scenarios. However, for a more likely hadronic scenario, the flux expectations in the keV band are very low, which could make approval of such a proposal very unlikely. To study the particle propagation in more detail, dedicated radio polarization observations in the MHz to GHz regime would help determine the direction and level of turbulence of the magnetic field in the SNR. VHE gamma-ray emission from molecular clouds may also exhibit localized peaks at their core regions with densities >104 cm-3 (Gabici & Aharonian 2007). To trace these regions molecular lines of NH3, CS, or SiO can be used. Respective follow-up observations at mm and sub-mm wavelengths could be crucial for characterizing the environment of particle interaction.
Acknowledgments
The XMM-Newton project is supported by the Bundesministerium für Wirtschaft und Technologie/Deutsches Zentrum für Luft- und Raumfahrt (BMWI/DLR, FKZ 50 OX 0001) and the Max-Planck Society. This publication makes use of data products from the Two Micron All Sky Survey, which is a joint project of the University of Massachusetts and the Infrared Processing and Analysis Center/California Institute of Technology, funded by the National Aeronautics and Space Administration and the National Science Foundation. The NANTEN project is financially supported from JSPS (Japan Society for the Promotion of Science) Core-to-Core Program, MEXT Grant-in-Aid for Scientific Research on Priority Areas, and SORST-JST (Solution Oriented Research for Science and Technology: Japan Science and Technology Agency).
References
- Abdo, A. A., Ackermann, M., Ajello, M., et al. 2010, ApJS, 188, 405 [NASA ADS] [CrossRef] [Google Scholar]
- Acciari, V. A., Aliu, E., Arlen, T., et al. 2009, ApJ, 698, L133 [NASA ADS] [CrossRef] [Google Scholar]
- Aharonian, F. A. 1991, Ap&SS, 180, 305 [NASA ADS] [CrossRef] [Google Scholar]
- Aharonian, F. A., & Atoyan, A. M. 1996, A&A, 309, 917 [NASA ADS] [Google Scholar]
- Aharonian, F. A., Drury, L. O., & Voelk, H. J. 1994, A&A, 285, 645 [NASA ADS] [Google Scholar]
- Aharonian, F. A., Atoyan, A. M., & Kifune, T. 1997, MNRAS, 291, 162 [NASA ADS] [CrossRef] [Google Scholar]
- Aharonian, F., Akhperjanian, A. G., Aye, K.-M., et al. 2005a, Science, 307, 1938 [NASA ADS] [CrossRef] [PubMed] [Google Scholar]
- Aharonian, F., Akhperjanian, A. G., Aye, K.-M., et al. 2005b, A&A, 435, L17 [NASA ADS] [CrossRef] [EDP Sciences] [Google Scholar]
- Aharonian, F. A., Akhperjanian, A. G., Bazer-Bachi, A. R., et al. 2005c, A&A, 442, L25 [NASA ADS] [CrossRef] [EDP Sciences] [Google Scholar]
- Aharonian, F., Akhperjanian, A. G., Bazer-Bachi, A. R., et al. 2006a, ApJ, 636, 777 [Google Scholar]
- Aharonian, F., Akhperjanian, A. G., Bazer-Bachi, A. R., et al. 2006b, Nature, 439, 695 [NASA ADS] [CrossRef] [PubMed] [Google Scholar]
- Aharonian, F., Akhperjanian, A. G., Barres de Almeida, U., et al. 2008a, A&A, 477, 353 [Google Scholar]
- Aharonian, F., Akhperjanian, A. G., Barres de Almeida, U., et al. 2008b, A&A, 483, 509 [Google Scholar]
- Aharonian, F., Akhperjanian, A. G., Bazer-Bachi, A. R., et al. 2008c, A&A, 481, 401 [NASA ADS] [CrossRef] [EDP Sciences] [MathSciNet] [PubMed] [Google Scholar]
- Albert, J., Aliu, E., Anderhub, H., et al. 2007, ApJ, 664, L87 [NASA ADS] [CrossRef] [Google Scholar]
- Arnaud, K. A. 1996, in Astronomical Data Analysis Software and Systems V, ASP Conf. Ser., 101, 17 [Google Scholar]
- Arnaud, M., Neumann, D. M., Aghanim, N., et al. 2001, A&A, 365, L80 [NASA ADS] [CrossRef] [EDP Sciences] [Google Scholar]
- Bałucińska-Church, M., Humphrey, P. J., Church, M. J., & Parmar, A. N. 2000, A&A, 360, 583 [NASA ADS] [Google Scholar]
- Brand, J., & Blitz, L. 1993, A&A, 275, 67 [NASA ADS] [Google Scholar]
- Carter, J. A., & Read, A. M. 2007, A&A, 464, 1155 [NASA ADS] [CrossRef] [EDP Sciences] [Google Scholar]
- De Luca, A., & Molendi, S. 2004, A&A, 419, 837 [NASA ADS] [CrossRef] [EDP Sciences] [Google Scholar]
- Dickey, J. M., & Lockman, F. J. 1990a, ARA&A, 28, 215 [NASA ADS] [CrossRef] [MathSciNet] [Google Scholar]
- Dickey, J. M., & Lockman, F. J. 1990b, ARA&A, 28, 215 [NASA ADS] [CrossRef] [MathSciNet] [Google Scholar]
- Ebisawa, K., Tsujimoto, M., Paizis, A., et al. 2005, ApJ, 635, 214 [NASA ADS] [CrossRef] [Google Scholar]
- Feinstein, F., Fiasson, A., Gallant, Y., et al. 2009, in AIP Conf. Ser., ed. D. Bastieri, & R. Rando, 1112, 54 [Google Scholar]
- Gabici, S., & Aharonian, F. A. 2007, Ap&SS, 309, 465 [Google Scholar]
- Gabici, S., Aharonian, F. A., & Casanova, S. 2009, MNRAS, 396, 1629 [NASA ADS] [CrossRef] [Google Scholar]
- Green, D. A. 2005, Mem. Soc. Astron. Italiana, 76, 534 [Google Scholar]
- Green, D. A. 2009, Bull. Astron. Soc. India, 37, 45 [Google Scholar]
- Green, A. J., Cram, L. E., Large, M. I., & Ye, T. 1999, ApJS, 122, 207 [NASA ADS] [CrossRef] [Google Scholar]
- Güdel, M., Audard, M., Magee, H., et al. 2001, A&A, 365, L344 [NASA ADS] [CrossRef] [EDP Sciences] [Google Scholar]
- Guseinov, O. H., Ankay, A., & Tagieva, S. O. 2004, Serbian Astron. J., 169, 65 [NASA ADS] [CrossRef] [Google Scholar]
- Hands, A. D. P., Warwick, R. S., Watson, M. G., & Helfand, D. J. 2004, MNRAS, 351, 31 [NASA ADS] [CrossRef] [Google Scholar]
- Jansen, F., Lumb, D., Altieri, B., et al. 2001, A&A, 365, L1 [NASA ADS] [CrossRef] [EDP Sciences] [Google Scholar]
- Kuchar, T. A., & Bania, T. M. 1990, ApJ, 352, 192 [NASA ADS] [CrossRef] [Google Scholar]
- Makarov, V. V. 2003, AJ, 126, 1996 [NASA ADS] [CrossRef] [Google Scholar]
- Matsunaga, K., Mizuno, N., Moriguchi, Y., et al. 2001, PASJ, 53, 1003 [NASA ADS] [Google Scholar]
- McClure-Griffiths, N. M., Dickey, J. M., Gaensler, B. M., et al. 2005, ApJS, 158, 178 [NASA ADS] [CrossRef] [Google Scholar]
- Mizuno, A., & Fukui, Y. 2004, in Milky Way Surveys: The Structure and Evolution of our Galaxy, ed. D. Clemens, R. Shah, & T. Brainerd, ASP Conf. Ser., 317, 59 [Google Scholar]
- Reach, W. T., Rho, J., Tappe, A., et al. 2006, AJ, 131, 1479 [NASA ADS] [CrossRef] [Google Scholar]
- Reimer, A., Pohl, M., & Reimer, O. 2006, ApJ, 644, 1118 [NASA ADS] [CrossRef] [Google Scholar]
- Russeil, D. 2003, A&A, 397, 133 [NASA ADS] [CrossRef] [EDP Sciences] [Google Scholar]
- Schöck, F. M., Büsching, I., de Jager, O. C., Eger, P., & Vorster, M. J. 2010, A&A, 515, A109 [NASA ADS] [CrossRef] [EDP Sciences] [Google Scholar]
- Skrutskie, M. F., Cutri, R. M., Stiening, R., et al. 2006, AJ, 131, 1163 [NASA ADS] [CrossRef] [Google Scholar]
- Strong, A. W., Moskalenko, I. V., Reimer, O., Digel, S., & Diehl, R. 2004, A&A, 422, L47 [Google Scholar]
- Strüder, L., Briel, U., Dennerl, K., et al. 2001, A&A, 365, L18 [NASA ADS] [CrossRef] [EDP Sciences] [Google Scholar]
- Turner, M. J. L., Abbey, A., Arnaud, M., et al. 2001, A&A, 365, L27 [NASA ADS] [CrossRef] [EDP Sciences] [Google Scholar]
- Voges, W., Aschenbach, B., Boller, T., et al. 1999, A&A, 349, 389 [NASA ADS] [Google Scholar]
- Whiteoak, J. B. Z., & Green, A. J. 1996, A&AS, 118, 329 [NASA ADS] [CrossRef] [EDP Sciences] [Google Scholar]
- Xiang, J., Lee, J. C., & Nowak, M. A. 2007, ApJ, 660, 1309 [NASA ADS] [CrossRef] [Google Scholar]
All Tables
All Figures
|
Fig. 1 Combined color-coded image from the PN and MOS detectors. Energy intervals for the colors are 0.5–1.0 keV (red), 1.0–2.0 keV (green), and 2.0–4.5 keV (blue). The red contours denote the 7,6,5,4σ statistical significance levels of the HESS detection of HESS J1626−490. Marked are point sources detected within the 4σ VHE contours (numbered 1 to 12 with increasing RA). The dashed ellipse (white) shows the 1σ confidence region of the positional uncertainty of the Fermi source 1FGL J1626.0−4917c. |
| In the text | |
|
Fig. 2 EPIC-PN and EPIC-MOS spectra of source No. 1 with a 3-temperature thermal plasma model (MEKAL, |
| In the text | |
|
Fig. 3 Adaptively smoothed EPIC-PN image of diffuse X-ray flux in the 3–7 keV energy band with a linear color scale (arbitrary units). The instrument FoV is shown as a dashed circle (green). The large ellipses (black) denote the extraction regions for HESS J1626−490 and the background test, respectively. The large circle (magenta) to the east gives the approximate extension of the X-ray scattering halo of 4U 1624-490. Excluded regions are shown as crossed-out areas (yellow regions crossed with red lines). |
| In the text | |
|
Fig. 4 NXB subtracted spectra from the elliptical region centered at HESS J1626−490 (black) and a region in the south of the FoV outside the 4σ contours of HESS J1626−490 (red). The stepped lines show the best-fit of a 2-temperature NEI model. |
| In the text | |
|
Fig. 5 Spectral energy distribution of HESS J1626−490, showing the HESS spectrum as data points with errors (red) (Aharonian et al. 2008a) together with the spectral uncertainty band of 1FGL J1626.0−4917c (Abdo et al. 2010). The XMM-Newton upper limit from this work is denoted by a horizontal line with an arrow (black). |
| In the text | |
|
Fig. 6 Left: Nanten12CO(J = 1–0) image of the region around HESS J1626−490 (linear scale in K km s-1) integrated over the vLSR range −31 to −18 km s-1. Overlaid are the contours of the VHE emission (blue) and of the H i cloud discussed in Sect. 4 (green). The dashed circle (light blue) denotes the position and extension of SNR G335.2+00.1. Right: Nanten12CO(J = 1–0) Galactic longitude-velocity plot (linear scale in K deg) integrated over the Galactic latitude range −0.33 to 0.14 deg. The 12CO cloud shown in the left image is marked by a dashed circle (green). |
| In the text | |
|
Fig. 7 H i SGPS Galactic longitude-velocity plot (linear scale in K deg) integrated over the Galactic latitude range −0.11 to 0.24 deg. The position and extension of the 12CO cloud is denoted by a dashed circle (black). The double arrow (green) shows the Galactic latitude and extension of SNR G335.2+00.1. |
| In the text | |
|
Fig. 8 H i SGPS images of the region around HESS J1626−490 (linear scale in K km s-1) integrated over the vLSR ranges −23 to −18 km s-1 (left) and −31 to −23 km s-1 (right), respectively. The dashed circle (white) marks the position and radio extension of SNR G335.2+00.1. Also shown are the HESS VHE contours of HESS J1626−490 (green). The arrows (white, labeled D1 and D2) mark two dips, probably due to foreground absorption. |
| In the text | |
|
Fig. 9 Three-color (rgb = 24/8/3.6 μm) image from the Spitzer GLIMPSE and MIPSGAL surveys in log scale (MJy/sr units) with lower limit clipping at (rgb = 30/60/5 MJy/sr) in Galactic coordinates. Shown are the VHE contours of HESS J1626−490 (white) and two HII regions (red, labeled R1 and R2). |
| In the text | |
Current usage metrics show cumulative count of Article Views (full-text article views including HTML views, PDF and ePub downloads, according to the available data) and Abstracts Views on Vision4Press platform.
Data correspond to usage on the plateform after 2015. The current usage metrics is available 48-96 hours after online publication and is updated daily on week days.
Initial download of the metrics may take a while.