Free Access
Fig. 5
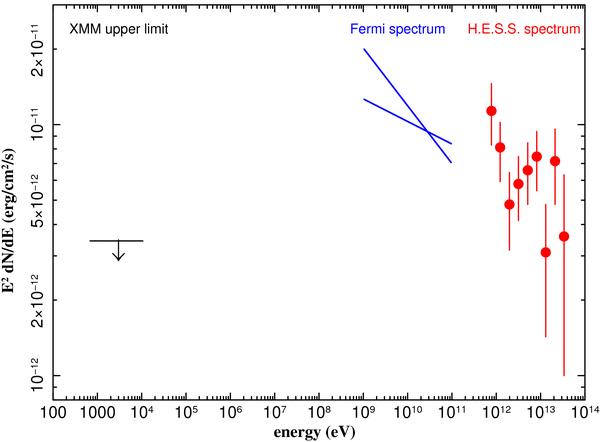
Spectral energy distribution of HESS J1626−490, showing the HESS spectrum as data points with errors (red) (Aharonian et al. 2008a) together with the spectral uncertainty band of 1FGL J1626.0−4917c (Abdo et al. 2010). The XMM-Newton upper limit from this work is denoted by a horizontal line with an arrow (black).
Current usage metrics show cumulative count of Article Views (full-text article views including HTML views, PDF and ePub downloads, according to the available data) and Abstracts Views on Vision4Press platform.
Data correspond to usage on the plateform after 2015. The current usage metrics is available 48-96 hours after online publication and is updated daily on week days.
Initial download of the metrics may take a while.