Free Access
Fig. 4
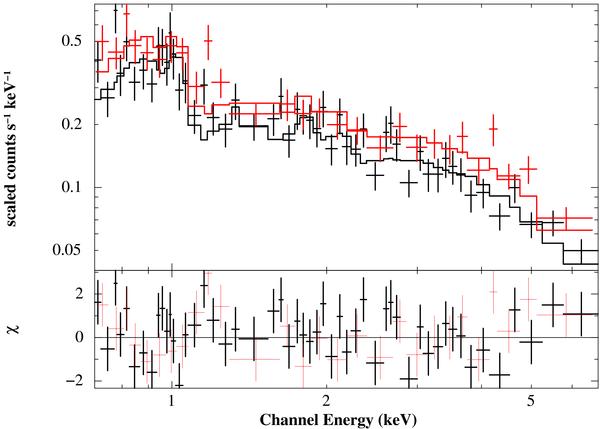
NXB subtracted spectra from the elliptical region centered at HESS J1626−490 (black) and a region in the south of the FoV outside the 4σ contours of HESS J1626−490 (red). The stepped lines show the best-fit of a 2-temperature NEI model.
Current usage metrics show cumulative count of Article Views (full-text article views including HTML views, PDF and ePub downloads, according to the available data) and Abstracts Views on Vision4Press platform.
Data correspond to usage on the plateform after 2015. The current usage metrics is available 48-96 hours after online publication and is updated daily on week days.
Initial download of the metrics may take a while.