Fig. 1
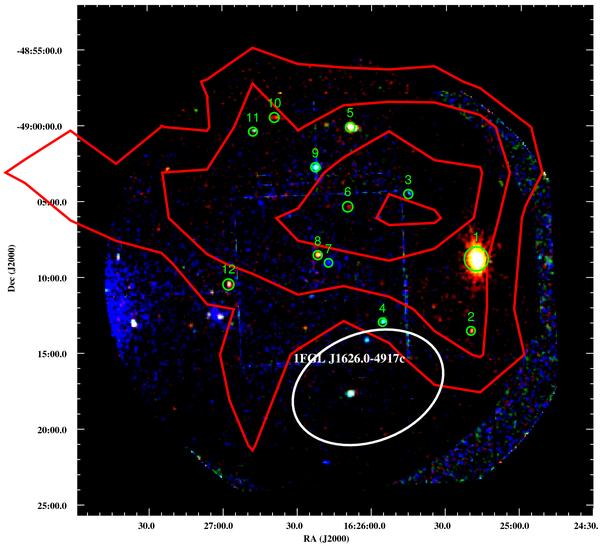
Combined color-coded image from the PN and MOS detectors. Energy intervals for the colors are 0.5–1.0 keV (red), 1.0–2.0 keV (green), and 2.0–4.5 keV (blue). The red contours denote the 7,6,5,4σ statistical significance levels of the HESS detection of HESS J1626−490. Marked are point sources detected within the 4σ VHE contours (numbered 1 to 12 with increasing RA). The dashed ellipse (white) shows the 1σ confidence region of the positional uncertainty of the Fermi source 1FGL J1626.0−4917c.
Current usage metrics show cumulative count of Article Views (full-text article views including HTML views, PDF and ePub downloads, according to the available data) and Abstracts Views on Vision4Press platform.
Data correspond to usage on the plateform after 2015. The current usage metrics is available 48-96 hours after online publication and is updated daily on week days.
Initial download of the metrics may take a while.