| Issue |
A&A
Volume 526, February 2011
|
|
|---|---|---|
| Article Number | A30 | |
| Number of page(s) | 10 | |
| Section | Extragalactic astronomy | |
| DOI | https://doi.org/10.1051/0004-6361/201015458 | |
| Published online | 16 December 2010 | |
The nature of “dark” gamma-ray bursts
1
Max-Planck-Institut für extraterrestrische Physik,
Giessenbachstrasse 1,
85748
Garching,
Germany
e-mail: jcg@mpe.mpg.de; kruehler@mpe.mpg.de;
pafonso@mpe.mpg.de; cclemens@mpe.mpg.de;
filgas@mpe.mpg.de; nardini@mpe.mpg.de;
felipe@mpe.mpg.de; arau@mpe.mpg.de;
pschady@mpe.mpg.de
2
Universe Cluster, Technische Universität München,
Boltzmannstraße 2,
85748
Garching,
Germany
3
Thüringer Landessternwarte Tautenburg,
Sternwarte 5,
07778
Tautenburg,
Germany
e-mail: klose@tls-tautenburg.de; rossi@tls-tautenburg.de
4
Clemson Univ., Dept. of Physics and Astronomy,
Clemson,
SC
29634,
USA
e-mail: dieter@clemson.edu; aupdike@clemson.edu
5
Institute of Astronomy, University of Cambridge,
Madingley Road,
Cambridge
CB3 0HA,
UK
e-mail: aky@ast.cam.ac.uk
Received:
22
July
2010
Accepted:
11
October
2010
Context. Thirteen years after the discovery of the first afterglows, the nature of dark gamma-ray bursts (GRB) still eludes explanation: while each long-duration GRB typically has an X-ray afterglow, optical/NIR emission is only seen for 40–60% of them.
Aims. Here we use the afterglow detection statistics of the systematic follow-up observations performed with GROND since mid-2007 in order to derive the fraction of “dark bursts” according to different methods, and to distinguish between various scenarios for “dark bursts”.
Methods. Observations were performed with the 7-channel “Gamma-Ray Optical and Near-infrared Detector” (GROND) at the 2.2 m MPI/ESO telescope. We used the afterglow detection rate in dependence on the delay time between GRB and the first GROND exposure.
Results. For long-duration Swift bursts with a detected X-ray afterglow, we achieve a 90% (35/39) detection rate of optical/NIR afterglows whenever our observations started within less than 240 min after the burst. Complementing our GROND data with Swift/XRT spectra we construct broad-band spectral energy distributions and derive rest-frame extinctions.
Conclusions. We detect 25–40% “dark bursts”, depending on the definition used. The faint optical afterglow emission of “dark bursts” is mainly due to a combination of two contributing factors: (i) moderate intrinsic extinction at moderate redshifts, and (ii) about 22% of “dark” bursts at redshift >5.
Key words: gamma-rays burst: general / techniques: photometric
© ESO, 2010
1. Introduction
Long-duration gamma-ray bursts (GRBs) are the high-energy signatures of the death of some massive stars, and they emit the bulk of their radiation in the ≈300–800 keV range. For understanding the physics of the GRB explosion, the impact of GRBs on their surrounding, as well as the implications of GRBs on early star formation and cosmology, it is crucial to observe their afterglow emission. While X-ray afterglows are detected basically for each burst, the low detection rate of optical/NIR afterglows has been a long standing problem in the GRB field (Paczyński 1998; Groot et al. 1998; Klose et al. 2000; Djorgovski et al. 2001; Fynbo et al. 2001; Lazzati et al. 2002; Piro et al. 2002; Klose et al. 2003; Levan et al. 2006; Jaunsen et al. 2008; Tanvir et al. 2008), and it was first discussed systematically in Fynbo et al. (2001) and Lazzati et al. (2002).
The Swift satellite (Gehrels et al. 2004) was designed to slew to GRB locations rapidly and provide positions with arcsec-accuracy through observations of the afterglows with the X-ray telescope (XRT, Burrows et al. 2005) and the UV-optical telescope (UVOT, Roming et al. 2005). While the detection of the X-ray afterglows has dramatically facilitated the discovery of many new phenomena and increased the efficiency of ground-based follow-up observations, the UVOT detection rate of afterglows is, originally somewhat surprisingly, only ~40% (Roming & Mason 2006).
The first burst in the afterglow era for which no optical (or NIR) afterglow was found was GRB 970828 (Groot et al. 1998). Originally, those GRBs with X-ray but without optical afterglows had been coined “dark GRBs” (Fynbo et al. 2001). Later, this nomenclature was made more specific by adding a time and brightness limit, e.g. fainter than R ~ 23 mag within 12 h of the burst. As the next step, the basic prediction of the fireball scenario (Mészáros & Rees 1997) was utilized and the optical-to-X-ray spectral index βOX (slope between the fluxes in the R-band and at 1 keV) was used to define dark bursts (βOX < 0.5; Jakobsson et al. 2004), or the X-ray spectral and decay indices were used alternatively to extrapolate the X-ray flux to the optical regime (Rol et al. 2005). Ultimately, by using the X-ray flux and spectral (βX) information from Swift, van der Horst et al. (2009) propose to define dark bursts as those for which βOX is shallower than (βX − 0.5).
The darkness in the optical can have several origins (e.g. Fynbo et al. 2001). The afterglow could (i) have an intrinsically low luminosity, e.g. from an optically bright vs. optically dark dichotomy; (ii) be strongly absorbed by intervening material, either very locally around the GRB or along the line-of-sight through the host galaxy, or (iii) be at high redshift (z > 6) so that Lyα blanketing and absorption by the intergalactic medium would prohibit detection in the frequently used R band (Lamb & Reichart 2000).
Before the Swift era, an analysis of a sub-sample of GRBs, namely those with particularly accurate positions provided with the Soft X-ray Camera on HETE-2, revealed optical afterglows for 10 out of 11 GRBs (Villasenor et al. 2004). This suggested that the rapid availability of precise positions plays a major role in the identification of afterglows, and that the majority of dark GRBs are neither at high redshift nor strongly absorbed, but just dim, and/or rapidly decaying. However, Swift observations have provided 500 GRB localizations at the few arcsec level within minutes of the trigger, and the fraction of non-detected afterglows is still about ~30–40%: UVOT detects about 40% of the afterglows (Roming et al. 2009), and ground-based observations recover another 20–30% (see e.g. http://www.mpe.mpg.de/~jcg/grbgen.html).
This would imply that the accuracy and timeliness of a GRB position is not the dominating factor. On the other hand, given the larger mean redshift of GRBs in the Swift era (Berger et al. 2005; Jakobsson et al. 2006), one could also argue that the mean flux of the afterglows is lower, and thus the effect of the better and faster Swift localizations on the afterglow detection rate is over-compensated by fainter afterglows with respect to the above HETE-2 sub-sample.
Here, we use the afterglow detection rate of GROND, a dedicated ground-based GRB follow-up instrument, to derive new constraints on the fraction of dark bursts. We complement the GROND data with Swift/XRT spectra to construct broad-band spectral energy distributions and to derive the rest-frame extinction. Throughout this paper, we use the definition Fν ∝ ν−β.
2. GROND observation statistics
GROND, a simultaneous 7-channel optical/near-infrared imager (Greiner et al. 2008a) mounted at the 2.2 m MPI/ESO telescope at La Silla (Chile), started operation in May 2007. GROND has been built as a dedicated GRB follow-up instrument and has observed basically every GRB visible from La Silla (weather allowing) since April 2008.
GROND observations of GRBs within the first day are fully automated (see Greiner et al. 2008a for more details). The fastest reaction on a Swift alert so far was 140 s (Swift trigger 353627); more typical times are 200–300 s for night-time bursts. The two dominant contributors for this delay are the read-out time of the interrupted exposure (particularly the Wide-Field Imager, one of two other instruments at the telescope), and the dome rotation speed. The distribution of delay times of GRBs with GROND is given in Table 1 (last column). Note that due to La Silla being located at similar geographic longitude as the South Atlantic Anomaly (where most gamma-ray detectors need to switch off their high-voltage), the fraction of night-time bursts is nearly a factor two lower than for observatories at other geographic longitudes.
It is obvious that the later after a GRB trigger the GROND observation starts, the lower is the fraction of afterglow detections (Table 1). This is expected and readily explained by the rapid fading of GRB afterglows and the limiting sensitivity of the instrument/telescope in use. What is surprising, however, is the high detection rate in the first two time bins – this will be discussed in the following. The relatively high detection rate at >24 h is biased by the Fermi/LAT bursts which are, on average, more energetic with correspondingly brighter afterglows (McBreen et al. 2010).
GROND afterglow detection fraction of long-duration bursts as a function of time delay of the start of the observation after the GRB trigger.
GRBs observed with GROND within 240 min after the Swift trigger (including 39 long- and 4 short-duration bursts).
Table 2 contains all those bursts which have been observed with GROND within less than 240 min (4 h) after the Swift trigger and which have XRT-detected afterglows (until 31 March 2010). First we note that (within this sample) there is a clear difference between the detection likelihood for long- and short-duration bursts. While we detect only 1 out of 4 short bursts, it is 35 out of 39 for long-duration bursts. This resembles the well-known fact that short-duration bursts have generally much fainter afterglows than long-duration bursts. Second, we note that a further down-selection of long-duration bursts at high Galactic latitude does not change our detection rate. This is due to GROND’s capability of imaging in all bands simultaneously, in particular also in the near-infrared. Third, we emphasize that this sample lacks any selection effects beyond requiring an X-ray afterglow.
3. Fitting broad-band spectral energy distributions
3.1. Overall properties
GROND and Swift/XRT data have been reduced in the standard manner using pyraf/IRAF (Tody 1993; Küpcü Yoldaş et al. 2008b) for the optical/NIR data and the XRT pipeline for the X-ray data. The optical/NIR imaging was calibrated against the primary SDSS standard star network, or cataloged magnitudes of field stars from the SDSS in the case of g′r′i′z′ observations or the 2MASS catalog for JHKS imaging. This results in typical absolute accuracies of ±0.03 mag in g′r′i′z′ and ±0.05 mag in JHKS. X-ray data were cleaned for time intervals of flaring activity and the early steep decay. The X-ray spectra were flux normalized to the epoch corresponding to the GROND observations using the XRT light curves from Evans et al. (2007, 2009). This common reference time was selected to be after the early optical rise observed in some light curves and is different for each burst, but typically during the first few hours after the Swift trigger.
We then combined XRT and Galactic foreground extinction (Schlegel et al. 1998) corrected GROND data to establish a broad-band spectral energy distribution (SED) – see Fig. 1.
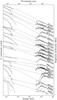 |
Fig. 1 Spectral energy distributions of a selection of the long-duration GRBs with redshift in our sample, labeled on the right side. The X-ray spectrum has been extracted from early times, but after the rapid fading and excluding flares, and then shifted in mid-time to the GROND mid-time (see text for details). The dashed lines indicate the best-fit model for each burst, with the break between the X-ray and optical/NIR always treated as a free parameter. Curvature in the X-rays is due to Galactic plus host-intrinsic absorption, and curvature in the observed optical/NIR range due to host-intrinsic extinction (data have been corrected for Galactic foreground extinction before fitting). For better visibility, the intensity scaling has been choosen to minimize overlap of the different SEDs, and thus is completely arbitrary. |
These SEDs have been fit with two alternative models: (i) a single power law with free slope and normalization, plus free source-intrinsic extinction of SMC/LMC or MW-type (for the GROND data) and Galactic plus rest-frame equivalent neutral hydrogen column density (for the X-ray data) assuming solar abundance; or (ii) a broken power law where the break energy is left free but the difference in the two slopes is fixed to 0.5, and all other parameters are left free as above. Note that fixing the break does not imply that the optical/NIR SED is not fit; instead, it is fit together with the X-ray SED (the X-ray slope in general does not dominate the SED fit). These models provide a very good fit to all but one afterglow SED (Fig. 1): For this exceptional case, GRB 080413B, the combined GROND/XRT SED requires a difference >0.5 between the low and high energy slopes of the synchrotron emission model (Filgas et al. 2010). Except for seven GRBs (080605, 080710, 080913, 081029, 081228, 090926B, 091221) all GRBs are better fit with a break between the X-ray and optical/NIR. The best-fit parameters are listed in the last four columns of Table 2. With the exception of five bursts (GRBs 070802, 080210, 080605, 080805, 090102), the SEDs of the afterglows are consistent with being reddened with an SMC extinction law.
3.2. Notes on individual GRBs
070802 has a βOX = 0.5, but since the best-fit location of
the spectral break is just bluewards of the g′-band, it still
requires a substantial AV ~ 1.2 mag. This burst is also an
example of a border-line case: its βOX just misses the “dark
burst” criterion of Jakobsson et al. (2004), but
due to its βX being slightly steeper than 1.0, it qualifies as
“dark burst” according to van der Horst et al.
(2009). 080218B: if we assume a break of 0.5 between the X-ray and optical/NIR
band, as for the majority of the bursts in our sample, the GROND upper limits allow the
following (z,AV) pairs of e.g. (3.5, 1.5) or
(5, 1.0) or (7, 0.7) or (10, 0.5) as explanations of the non-detection. 080516: with the
improved calibration, our best-fit redshift is z = 3.6 ± 0.6. Since
GROND is not sensitive to redshifts smaller than ≈3, the above redshift is consistent
with zero at the 90% confidence level. However, we use this best-fit redshift to derive
AV which therefore could be a lower limit. 080805: in this
case there are no simultaneous GROND and XRT observations of the afterglow. The flux
normalization of the XRT spectrum was obtained by back-extrapolating the XRT afterglow
light-curve to the earlier time of GROND observations. 080915 has a very faint X-ray
afterglow (Oates et al. 2008). If we assume a
break of 0.5 between the X-ray and optical/NIR band, as for the majority of the bursts in
our sample, we predict r′ ~ 23.2 mag with
AV = 0. This is brighter than our GROND detection limit
(r′ > 25.2 mag) for this burst.
Thus, various (z,AV) pairs of e.g. (3.5,
>0.5) or (5, >0.25) or (7,
>0.1) provide good explanations of the non-detection
(Fig. 3). 090429B: due to bad sky conditions, this
burst was not seen in the first night, but detected in the second night at the
2σ level in the H band, but not in J.
Since GROND is more sensitive in J as compared to H,
this is consistent with a break between J and H, and
thus with the photometric redshift determined by Cucchiara et al. (in prep.); see also
Tanvir (2010). 090904B: the object is detected
in all GROND filters except the g′-band which implies a secure
upper limit on the redshift of z < 5. However,
the g′-band non-detection is also well explained by the large
Galactic foreground reddening
(E(B − V) = 1.76 mag Schlegel et al. 1998). With no accurate redshift
available, the best-fit extinction of AV = 2 mag at
z = 0 is an upper limit. However, the large foreground extinction of
AV ~ 5 mag can be expected to come with a large (systematic)
error, which propagates also to our fit values; thus we cannot distinguish between
Galactic foreground and host extinction. 090926B: while GROND observations of this GRB
started quickly, clouds prevented continued observations after a few minutes. Further
observations were done starting 6.2 h after the burst, and additionally on 14 Feb. 2010.
The latter observation confirmed the fading of the candidate counterpart of Malesani et al. (2009), and the association to the host
galaxy as well as the redshift determination via host spectroscopy (Fynbo et al. 2009a). 091221: no spectroscopic redshift is available.
The afterglow is detected in all GROND filters, and the 3σ upper limit on
the redshift is z < 3.3. For a putative redshift
of 2, we obtain  mag
and
mag
and  1021 cm-2. 100117A: the redshift of z = 0.92 is
contained in a summary table in Berger (2010) and
referenced there as Fong et al. (in prep.). 100205A: due to cloud coverage, GROND
observations started only 2.3 h after the burst, and then were severely affected by
passing cirrus. Correspondingly, no detection was achieved, and the upper limits obtained
by GROND were about 2 mag worse than the nominal sensitivity under normal conditions
(Nicuesa Guelbenzu et al. 2010). At about the
same time (2.6 hr after the GRB), Gemini observations revealed a near-infrared counterpart
Tanvir et al. (2010) with a very red colour of
H − K = 1.6 ± 0.5 mag (AB system) (Cucchiara et al. 2010). If this colour is due to
Lyman-α absorption within the H filter bandpass, then
this would imply a redshift of 11 z 13.5. Lower-redshift solutions with
significant local (host) extinction, unusual afterglow colours, or substantial
contributions from an underlying host galaxy have not been excluded though (Cucchiara et al. 2010).
1021 cm-2. 100117A: the redshift of z = 0.92 is
contained in a summary table in Berger (2010) and
referenced there as Fong et al. (in prep.). 100205A: due to cloud coverage, GROND
observations started only 2.3 h after the burst, and then were severely affected by
passing cirrus. Correspondingly, no detection was achieved, and the upper limits obtained
by GROND were about 2 mag worse than the nominal sensitivity under normal conditions
(Nicuesa Guelbenzu et al. 2010). At about the
same time (2.6 hr after the GRB), Gemini observations revealed a near-infrared counterpart
Tanvir et al. (2010) with a very red colour of
H − K = 1.6 ± 0.5 mag (AB system) (Cucchiara et al. 2010). If this colour is due to
Lyman-α absorption within the H filter bandpass, then
this would imply a redshift of 11 z 13.5. Lower-redshift solutions with
significant local (host) extinction, unusual afterglow colours, or substantial
contributions from an underlying host galaxy have not been excluded though (Cucchiara et al. 2010).
4. Discussion
4.1. The nature of dark bursts
In order to determine which of our bursts would have been classified as dark bursts according to the Jakobsson et al. (2004) definition, we also estimate βOX (Fig. 2) using the measured R-band brightness/limit and the X-ray flux at 3 keV (both observer frame). We find a fraction of 26% (the nine GRBs 080218B, 080516, 080805, 080913, 080915, 090102, 090429B, 090812, 090926B) that would be considered “dark”. Another five bursts (070802, 080129, 080413B, 080605, 090814) have, within errors, all βOX = 0.5. According to the classification of van der Horst et al. (2009), the following nine bursts are “dark”: 070802, 080210, 080218B, 080516, 080805, 080913, 080915, 090429B and 090904B. These fractions of 25–40% are fully consistent with the hitherto known fraction of dark bursts of 25%–42% (e.g. Fynbo et al. 2009b).
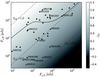 |
Fig. 2 The distribution of our sample GRBs in the plane of R-band flux over X-ray flux Jakobsson et al. (2004). For GRB 080413B we show as a thick solid line the temporal evolution of βOX with time during the first 2 days of the afterglow evolution (from top to bottom left). |
There is one other problem with all of the “dark burst” definitions, namely, the temporal evolution. Usually, a certain time interval is selected, based on the availability of optical and X-ray measurements, and one of the “darkness” tests applied. However, given the increasing sample of bursts with not just good X-ray but also good, simultaneous optical coverage, the complexity of light curves as compared to the basic fireball scenario becomes more and more evident. We have seen all kinds of different light curve behaviour, with either the optical or the X-rays decaying faster; sometimes this even changes in one burst. As a consequence, there is nothing like a single βOX per burst, but instead each burst shows a more or less pronounced evolution of βOX. As an example, the behaviour of GRB 080413B is shown in Fig. 2.
The main results of the SED fitting with respect to the “dark” burst isssue can be summarized as follows (the following properties are non-exclusive, and we use the definition of van der Horst et al. (2009) in the following): (1) Four out of the nine dark bursts are faint due to non-zero, but moderate (AV ≈ 0.2−1.5), extinction: 070802, 080210, 080516, 080805. The measured extinction in many cases appears enhanced to the observer due to a moderate redshift of the burst (see Fig. 3). (2) One burst (090904B) is behind an additional AV ~ 2 mag dust on top of the nominal AV ~ 5 Galactic foreground which could either be due to patchiness of the foreground or due to host galaxy extinction. (3) Two bursts are faint (in r′) due to high redshift (z > 5), namely GRB 080913 and 090429B. This corresponds to a fraction of 22% ± 8% of the dark bursts. (4) The remaining two of our “dark” GRBs, 080218B and 080915, are either at large redshift or moderate AV, or both (see notes above) – so they belong to one of the above two groups (1) or (3). (5) Even bursts with good evidence for a spectral break and βOX = 0.5 do require extinction in some cases, in particular if the break is near the optical (rather than X-ray) range.
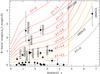 |
Fig. 3 The effect of the combination of various values of intrinsic extinction AV (lines with labels) and redshift, producing an effective dimming in the R band as given on the y-axis. The solid lines have been computed assuming a dust extinction curve as described in Reichart (1999) but with no 2175 Å bump and an opacity due to intergalactic hydrogen approximated by τ(HI) = 2.6 × (1 + z)3.3 for 700 nm/(1 + z) ≤ 121.6 nm (Valageas, Schaeffer & Silk 1999). Dots represent the GRBs of our sample for which we have an AV measurement from the GROND SED. GRBs with effective R-band reduction of > 0.5 mag are labeled; GRBs 080218B and 080915 lie above the correspondingly labeled dashed lines which correspond to the pairs of (z,AV) values described in the text. Moderate AV at moderate redshifts can easily produce a dimming of 1–3 mag in the R band. |
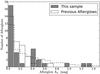 |
Fig. 4 The distribution of measured AV from our sample with redshift as compared to that of Kann et al. (2010). The dashed line is the theoretical distribution, normalized to the same number of objects in the sample, of a Monte Carlo simulation of random sightlines through an evolving galaxy model (Updike et al. 2009a). A KS-test returns a rejection probability of 54% for the null hypothesis that the two distributions are drawn from the same sample. |
4.2. Extinction
The rest-frame AV could be derived for 33 bursts of our sample (Table 2), and its distribution is compared against that of the Kann et al. (2010) collection (Fig. 4), made up of all optically bright GRBs with photometry available from the literature. We find substantially larger extinction values, in particular about twice as many bursts (~25% vs. 12%) with AV ~ 0.5 mag, and for the first time a significant fraction (10%) of bursts with AV 1 mag from a direct optical/NIR afterglow SED reddening measurement. The difference is easily understood as a selection effect (predominance of bright bursts) of the Kann et al. (2010) sample. Note, however, that this result is not due to the way in which the extinction models are fit to the data - our result is derived with the canonical SMC, LMC or MW extinction laws, in the same way as was done in Kann et al. (2010). We note in passing that using a different fitting approach (a “Drude” model) was reported to yield a factor 2–5 larger visual extinction (Liang et al. 2010).
It is also interesting to note that the bursts with the largest measured AV are those which tend to prefer extinction laws that include a 2175 Å feature. Unfortunately, statistics is poor, so one has to await for future, larger samples to verify whether or not this is a generic trend.
Despite this larger fraction of moderate to large extinction, there is still a 50% fraction of bursts with AV = 0, with errors of only ±0.02–0.05 mag (Table 2). This has also been somewhat surprising for two reasons. First, in the canonical picture of a massive progenitor with a strong wind prior to explosion, at least some extinction from the ejected material within the wind of the progenitor is expected (e.g. Waters 2010, and references therein). Second, even if the local environment of the GRB is relatively dust free, the GRB radiation has to pass through the host galaxy to reach us. Already the latter effect alone should create a mean extinction of order AV = 0.05−0.1 mag for about 30% of sources (Updike et al. 2009a), and very few with high AV; see Fig. 4. We now observe both, a larger fraction of AV = 0 objects as well as a larger fraction of AV > 1 objects as compared to this, admittedly simplistic, expectation. The reason for this discrepancy is presently unknown, but could be related to the possibility that the dust geometry is not homogeneous, but clumped. The relative overabundance of AV = 0 and AV > 1 objects would then be determined by the covering factor and the dust column through the clumps.
It is interesting to note that the AV distribution of type II-P supernovae (Smartt et al. 2009) (which comprises about 60% of all core-collapse SN), and that of stripped-envelope supernovae (Richardson et al. 2006) (which comprises 3 IIb, 11 Ib and 13 Ic) derived from a comparably sized sample as our GRBs, are consistent with being drawn from the same underlying distribution as our AV distribution of GRBs (though many of their AV values have errors consistent with AV = 0 at the 1σ level). This suggests that we sample similar environments for both populations, hinting at similar progenitor systems: all these supernovae tend to be associated with star-forming regions, so they can also be expected to be significantly extinguished in their host galaxies. There is similar evidence that the distribution of Wolf-Rayet stars is consistent with the theoretical picture that type-Ic SN result from progenitors that have been stripped of a larger part of their envelope (Leloudas et al. 2010).
4.3. Gas-to-dust ratio
Effective hydrogen absorption in excess of the Galactic foreground absorption has taken a long time to be detected significantly in GRB afterglow spectra. Originally not detected at all in the full sample of BeppoSAX bursts (De Pasquale et al. 2003), a re-analysis of the brightest 13 X-ray afterglows revealed statistically significant absorption in excess of the Galactic one for two bursts (Stratta et al. 2004). Already 8 bursts of 17 observed with Chandra or XMM-Newton up to Oct. 2004 show excess absorption (Gendre et al. 2006). In a systematic study of 93 promptly observed Swift GRBs with known redshift (up to May 2009), 85 show evidence of intrinsic X-ray absorption at the host galaxy site (Campana et al. 2010). Similarly, in our sample, we detect excess absorption in 26 out of 33 cases. This difference in the excess absorption detection rate is primarily related to the quality of the X-ray spectra, which pre-Swift was typically taken 8–12 h post trigger, by which time the signal-to-noise ratio was insufficiently high to accurately measure any intrinsic absorption.
Figure 5 shows a comparison of the effective neutral hydrogen absorption NH and visual extinction AV, both in the rest frame of the corresponding burst. As has been noted frequently in the past (e.g. Galama & Wijers 2001; Stratta et al. 2004; Schady et al. 2010), the NH-to-AV ratio is far from being similar among different bursts, and substantially larger than in our Galaxy. Note, however, that here, as has been usual in previous cases, solar metallicity has been assumed in deriving NH. Since the observed curvature in the X-ray spectra is predominantly, but not exclusively, due to absorption by oxygen, the derived effective NH is inversely proportional to the metallicity (or better O/H ratio) of the burst environment. Since this metallicity has been observed (in other GRBs) to be about 1/5 solar (though extremes of solar (Prochaska et al. 2009; Eliasdóttier et al. 2009) up to super-solar (Savaglio et al. 2010) and nearly 1/100 solar (D’Elia et al. 2007; Rau et al. 2010) do also occur), the effective NH would likely be even larger than shown in Fig. 5, if the proper line-of-sight metallicity were to be used (if it were known).
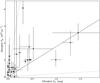 |
Fig. 5 Relation, or lack thereof, between best-fit rest-frame extinction and rest-frame neutral hydrogen absorption of our sample. The lines are the relation for our Galaxy (Predehl & Schmitt 1995), as well as 10 × and 100 × larger NH (from bottom to top). GRBs 080129 and 080516 are missing as they fall outside the plot with their large NH values. |
In contrast to our AV distribution, the distribution of NH,X from the complete Swift sample lacks a substantial fraction of zero column density (Campana et al. 2010). This has been explained by Campana et al. (2010) as evidence that the bursts originate within high-density regions of their hosts, since a random distribution in a galaxy like ours would predict a sizable fraction (~30%) with no intrinsic absorption. By combining their sample with the Lyman-α absorbers at z > 2 of Fynbo et al. (2009b) they also find, similar to earlier reports (e.g. Watson et al. 2007), that the bulk of GRBs have column densities in X-rays which are a factor ~10 higher than in the optical (NHI), which they explain by ionization of hydrogen by the high energy flux of the GRB. Since this ratio is roughly similar to that of NH,X vs. AV (Fig. 5), one could think that AV and the Lyman-α absorption are correlated. However, the three bursts with reported NHI in Fynbo et al. (2009b) (070802, 071031 and 080804) do not show any correlation, similar to the 6 bursts from the UVOT sample published by Schady et al. (2010).
4.4. Redshift distribution
The redshift distribution of our sample is 92% complete (also one of the 4 GRBs not detected by GROND has a redshift). We re-iterate that the only selection criterion was the detection of an X-ray afterglow, and do not see a bias introduced by the requirement of a rapid GROND observation (or equivalently an occurrence during Chilean night time). A comparison to the distribution of all known long-duration bursts (about 50% complete; Fig. 6) reveals the former to have a flatter distribution, with a somewhat higher number of z > 4 bursts. However, a KS-test shows that this is not statistically significant, and both distributions are consistent with being drawn from the same sample within 1σ.
The presence of GRBs 080913 and 090429B in our sample corresponds to a fraction of 5.5 ± 2.8% of bursts at redshifts z > 5, and the strict upper limit would be 12.8% if all three GRBs without redshift would be at z > 5. A larger sample size with a similarly good completeness level would be required to derive fractions with errors less than the present ~50% level.
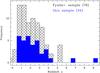 |
Fig. 6 Redshift distribution of our GROND sub-sample (blue) vs. that of the hitherto most complete sample of (Fynbo et al. 2009b) (bursts with upper limits have been omitted). |
5. Conclusions
The majority of afterglow SEDs show a spectral break between the X-ray and optical/NIR range that can be described with a slope difference of 0.5, consistent with the basic fireball scenario. This spectral break implies a R-band flux of about 3–4 mag fainter than obtained from an extrapolation of the X-ray spectrum. This effect is dealt with in all the recent definitions of “darkness” (e.g. Pedersen et al. 2006), and our finding of a dominance of SED breaks is consistent with the large number of bursts seen at βO < 1.
The faint optical afterglow emission of “dark bursts”, where we used the definition of van der Horst et al. (2009), is due to a mixture of moderate intrinsic extinction at moderate redshifts, and a fraction of bursts at redshift >5 (about 25% of the dark bursts).
This finding is in line with previous investigations (Melandri et al. 2008; Cenko et al. 2009b; Perley et al. 2009; Fynbo et al. 2009b). In particular, Cenko et al. (2009b) used a similar approach as ours, namely a sample of 29 bursts for which follow-up observations with the robotic Palomar 60 inch telescope began within 1 hr after the burst trigger. They recovered 80% of the optical afterglows, as compared to our 90% with a ~60% fraction of redshifts (as compared to our 92%). A search for host galaxies was then performed for bursts without afterglow and/or redshift of this sample to assess the degeneracy between high-z/low-AV vs. low-z/high-AV (Perley et al. 2009). In combination, and assuming further that the extinction measured along the line-of-sight to GRBs is proportional to the extinction of the host emission, these authors reach the similar conclusion that extinction is responsible in large part for the “dark bursts”. Some of their AV values, however, have been derived by assuming a SED slope in the optical, rather than measuring it. Given the prevalence of breaks (see above), this is risky.
In contrast, we emphasize here, that we (1) measure the optical/NIR SED, and (2) make no assumptions on the host properties. Thus, our sample of bursts is the first with properly measured AV values which neither requires a relative shifting of different filter measurements, as often done in the past nor suffers from the small wavelength coverage. Our only assumption is that whenever the data prefer a break in the SED between X-rays and optical/NIR, we only allow a slope difference of 0.5. GROND observations start removing the bias of previous studies to bright bursts, i.e. low-AV and low-z, and start to detect and reliably measure these higher-AV values directly. From individual bursts not in this sample there is evidence that bursts with even AV ~ 3−5 exist (e.g. GRB 080607, Prochaska et al. 2009; GRB 070306, Jaunsen et al. 2008) – though these are admittedly rare occasions which require larger samples to include them.
Facilities: Max Planck:2.2m (GROND), Swift
Acknowledgments
We thank S. Savaglio for useful comments. T.K. acknowledges support by the DFG cluster of excellence “Origin and Structure of the Universe”, and A.U. is grateful for travel funding support through MPE. F.O.E. acknowledges funding of his Ph.D. through the Deutscher Akademischer Austausch-Dienst (DAAD), S.K. and A. Rossi acknowledge support by DFG grant Kl 766/13-2 and A. Rossi additionally from the BLANCEFLOR Boncompagni-Ludovisi, née Bildt foundation. M.N. acknowledges support by DFG grant SA 2001/2-1. Part of the funding for GROND (both hardware as well as personnel) was generously granted from the Leibniz-Prize to Prof. G. Hasinger (DFG grant HA 1850/28-1). This work made use of data supplied by the UK Swift Science Data Centre at the University of Leicester.
References
- Afonso, P., Krühler, T., Klose, S., et al. 2008a, GCN #8731 [Google Scholar]
- Afonso, P., Klose, S., Krühler, T., et al. 2008b, GCN #8745 [Google Scholar]
- Afonso, P., Krühler, T., Greiner, J., et al. 2008c, GCN #8752 [Google Scholar]
- Afonso, P., Krühler, T., Klose, S., et al. 2009, GCN #8771 [Google Scholar]
- Afonso, P., Filgas, R., Greiner, J., et al. 2010, GCN #10493 [Google Scholar]
- Berger, E. 2010, ApJ, 722, 1946 [NASA ADS] [CrossRef] [Google Scholar]
- Berger, E., & Murphy, D. 2007, GCN #6695 [Google Scholar]
- Berger, E., & Rauch, M. 2008, GCN #8542 [Google Scholar]
- Berger, E., Kulkarni, S. R., Fox, D. B., et al. 2005, ApJ 634, 501 [NASA ADS] [CrossRef] [Google Scholar]
- Berger, E., Fox, D. B., Cucchiara, A., et al. 2008, GCN #8335 [Google Scholar]
- Burrows, D. N., Hill, J. E., Nousek, J. A., et al. 2005, SSR, 120, 165 [Google Scholar]
- Campana, S., Thöne, C. C., de Ugarte Postigo, A., et al. 2010, MN, 402, 2429 [Google Scholar]
- Cenko, S. B., Cobb, B. E., Perley, D. A., et al. 2009a, GCN #8933 [Google Scholar]
- Cenko, S. B., Keleman, J., Harrison, F. A., et al. 2009b, ApJ, 693, 1484 [NASA ADS] [CrossRef] [Google Scholar]
- Chen, H.-W., Helsby, J., Shectman, S., Thompson, I., & Crane, J. 2009, GCN #10038 [Google Scholar]
- Chornock, R., Perley, D. A., Cenko, S. B., et al. 2009a, GCN #8994 [Google Scholar]
- Chornock, R., Perley, D. A., & Cobb, B. E. 2009b, GCN #10100 [Google Scholar]
- Clemens, C., Küpcü Yoldaş, A., Greiner, J., et al. 2008a, GCN #7545 [Google Scholar]
- Clemens, C., Krühler, T., Greiner, J., et al. 2008b, GCN #7834 [Google Scholar]
- Clemens, C., Löw, S., Greiner, J., et al. 2008c, GCN #7948 [Google Scholar]
- Clemens, C., Löw, S., Greiner, J., et al. 2008d, GCN #8437 [Google Scholar]
- Covino, S., D’Avanzo, P., Klotz, A., et al. 2008, MN, 388, 347 [Google Scholar]
- Cucchiara, A., Fox, D. B., Cenko, S. B., et al. 2008, GCN #8713 [Google Scholar]
- Cucchiara, A., Levan, A., Tanvir, N., et al. 2009a, GCN #9286 [Google Scholar]
- Cucchiara, A., Fox, D., Levan, A., & Tanvir, N. 2009b, GCN #10202 [Google Scholar]
- Cucchiara, A., Fox, D. B., Tanvir, N. R., et al. 2010, GCN #10374 [Google Scholar]
- D’Avanzo, P., D’Elia, V., & Covino, S. 2008, GCN #8350 [Google Scholar]
- D’Elia, V., Fiore, F., Meurs, E. J. A., et al. 2007, A&A, 467, 629 [NASA ADS] [CrossRef] [EDP Sciences] [Google Scholar]
- D’Elia, V., Covino, S., D’Avanzo, P., et al. 2008, GCN #8438 [Google Scholar]
- Della Valle, M., Benetti, S., Mazzali, P., et al. 2008, CBET 1602 [Google Scholar]
- De Pasquale, M., Piro, L., Perna, R., et al. 2003, ApJ, 592, 1018 [NASA ADS] [CrossRef] [Google Scholar]
- de Ugarte Postigo, A., Jakobsson, P., Malesani, D., et al. 2009a, GCN #8766 [Google Scholar]
- de Ugarte Postigo, A., Gorosabel, J., Fynbo, J. P. U., Wiersema, K., & Tanvir, N. 2009b, GCN #9771 [Google Scholar]
- de UgartePostigo, A., Goldoni, P., Thöne, C. C., et al. 2010, A&A, 513, 42 [Google Scholar]
- Djorgovski, S. G., Frail, D. A., Kulkarni, S. R., et al. 2001, ApJ, 562, 654 [NASA ADS] [CrossRef] [Google Scholar]
- Eliasdóttier, Á., Fynbo, J. P. U., Hjorth, J., et al. 2009, ApJ, 697, 1725 [NASA ADS] [CrossRef] [Google Scholar]
- Evans, P. A., Beardmore, A. P., Page, K. L., et al. 2007, A&A, 469, 379 [NASA ADS] [CrossRef] [EDP Sciences] [Google Scholar]
- Evans, P. A., Beardmore, A. P., Page, K. L., et al. 2009, MNRAS, 397, 1177 [NASA ADS] [CrossRef] [Google Scholar]
- Filgas, R., Küpcü Yoldaş, A., Greiner, J., et al. 2008a, GCN #7740 [Google Scholar]
- Filgas, R., Küpcü Yoldaş, A., Greiner, J., et al. 2008b, GCN #7747 [Google Scholar]
- Filgas, R., Krühler, T., Yoldaş, A., Klose, S., & Greiner, J. 2009a, GCN #10039 [Google Scholar]
- Filgas, R., Updike, A., & Greiner, J. 2009b, GCN #10098 [Google Scholar]
- Filgas, R., Afonso, P., Klose, S., & Greiner, J. 2009c, GCN #10286 [Google Scholar]
- Filgas, R., Krühler, T., & Greiner, J. 2009d, GCN #10299 [Google Scholar]
- Filgas, R., Krühler, T., Greiner, J., et al. 2010, A&A, in press [Google Scholar]
- Fox, A. J., Ledoux, C., Vreeswijk, P. M., Smette, A., & Jaunsen, A. O. 2008, A&A, 491, 189 [NASA ADS] [CrossRef] [EDP Sciences] [Google Scholar]
- Fynbo, J. U., Jensen, B. L., Gorosabel, J., et al. 2001, A&A, 369, 373 [NASA ADS] [CrossRef] [EDP Sciences] [Google Scholar]
- Fynbo, J. U. P., Malesani, D., & Milvang-Jensen, B. 2008, GCN #7949 [Google Scholar]
- Fynbo, J. U. P., Malesani, D., Jakobsson, P., & D’Elia, V. 2009a, GCN #9947 [Google Scholar]
- Fynbo, J. U. P., Jakobsson, P., Prochaska, J. X., et al. 2009b, ApJS, 185, 526 [NASA ADS] [CrossRef] [Google Scholar]
- Galama, T. J., & Wijers, R. A. M. J. 2001, ApJ, 549, 209 [Google Scholar]
- Gehrels, N., Chincarini, G., Giommi, P., et al. 2004, ApJ, 621, 558 [Google Scholar]
- Gehrels, N., Ramirez-Ruiz, E., & Fox, D. B. 2009, ARA&A, 47, 567 [NASA ADS] [CrossRef] [Google Scholar]
- Gendre, B., Corsi, A., & Piro, L. 2006, A&A, 455, 803 [NASA ADS] [CrossRef] [EDP Sciences] [Google Scholar]
- Gendre, B., Pelisson, S., Boer, M., Basa, S., & Mazure, A. 2008a, A&A, 492, L1 [NASA ADS] [CrossRef] [EDP Sciences] [Google Scholar]
- Gendre, B., Galli, A., & Boer, M. 2008b, ApJ, 683, 620 [NASA ADS] [CrossRef] [Google Scholar]
- Gendre, B., Klotz, A., Palazzi, E., et al. 2010, MN, 405, 2372 [Google Scholar]
- Greiner, J., Clemens, C., Krühler, T., et al. 2007, GCN #6449 [Google Scholar]
- Greiner, J., Bornemann, W., Clemens, C., et al. 2008a, PASP, 120, 405 [NASA ADS] [CrossRef] [Google Scholar]
- Greiner, J., Krühler, T., Rossi, A., et al. 2008b, GCN #8223 [Google Scholar]
- Greiner, J., Krühler, T., Fynbo, J. P.U, et al. 2009a, ApJ, 693, 1610 [NASA ADS] [CrossRef] [Google Scholar]
- Greiner, J., Krühler, T., McBreen, S., et al. 2009b, ApJ, 693, 1912 [NASA ADS] [CrossRef] [Google Scholar]
- Groot, P. J., Galama, T. J., van Paradijs, J., et al. 1998, ApJ, 493, L27 [NASA ADS] [CrossRef] [Google Scholar]
- Guidorzi, C., Clemens, C., Kobayashi, S., et al. 2009, A&A, 499, 439 [NASA ADS] [CrossRef] [EDP Sciences] [Google Scholar]
- Jakobsson, P., Hjorth, J., Fynbo, J. P. U., et al. 2004, ApJ, 617, L21 [NASA ADS] [CrossRef] [Google Scholar]
- Jakobsson, P., Fynbo, J. P. U., Ledoux, C., et al. 2006, A&A, 460, L13 [NASA ADS] [CrossRef] [EDP Sciences] [Google Scholar]
- Jakobsson, P., Vreeswijk, P. M., Malesani, D., et al. 2008a, GCN #7286 [Google Scholar]
- Jakobsson, P., Fynbo, J. P. U., Malesani, D., Hjorth, J., & Milvang-Jensen, B. 2008b, GCN #7757 [Google Scholar]
- Jakobsson, P., Vreeswijk, P. M., Xu, D., & Thöne, C. C. 2008c, GCN #7832 [Google Scholar]
- Jakobsson, P., Fynbo, J. P. U., Vreeswijk, P. M., et al. 2008d, GCN #8077 [Google Scholar]
- Jakobsson, P., de Ugarte Postigo, A., Gorosabel, J., et al. 2009, GCN #9797 [Google Scholar]
- Jaunsen, A. O., Rol, E., Watson, D. J., et al. 2008, ApJ, 681, 453 [NASA ADS] [CrossRef] [Google Scholar]
- Kann, D. A., Klose, S., Zhang, B., et al. 2010, ApJ, 720, 1513 [NASA ADS] [CrossRef] [Google Scholar]
- Klose, S., Stecklum, B., & Masetti, N. 2000, ApJ, 545, 271 [NASA ADS] [CrossRef] [Google Scholar]
- Klose, S., Henden, A. A., Greiner, J., et al. 2003, ApJ, 592, 1025 [NASA ADS] [CrossRef] [Google Scholar]
- Kouveliotou, C., Meegan, C. A., Fishman, G. J., et al. 1993, ApJ, 413, L101 [NASA ADS] [CrossRef] [Google Scholar]
- Krühler, T., Küpcü Yoldaş, A., Greiner, J., et al. 2008a, GCN #7586 [Google Scholar]
- Krühler, T., Greiner, J., Küpcü Yoldaş, A., et al. 2008b, GCN #7599 [Google Scholar]
- Krühler, T., Küpcü Yoldaş, A., Greiner, J., et al. 2008c, ApJ, 685, 376 [NASA ADS] [CrossRef] [Google Scholar]
- Krühler, T., Schrey, F., Greiner, J., et al. 2008d, GCN #8060 [Google Scholar]
- Krühler, T., Schrey, F., Greiner, J., et al. 2008e, GCN #8075 [Google Scholar]
- Krühler, T., Greiner, J., McBreen, S., et al. 2009a, ApJ, 697, 758 [NASA ADS] [CrossRef] [Google Scholar]
- Krühler, T., Greiner, J., Afonso, P., et al. 2009b, A&A, 508, 593 [NASA ADS] [CrossRef] [EDP Sciences] [Google Scholar]
- Krühler, T., Schady, P., Greiner, J., et al. 2010, A&A, in press [Google Scholar]
- Küpcü Yoldaş, A., Yoldaş, A., Greiner, J., & Klose, S. 2008a, GCN #7283 [Google Scholar]
- Küpcü Yoldaş, A., Krühler, T., Greiner, J., et al. 2008b, AIP Conf. Proc., 1000, 227 [Google Scholar]
- Lamb, D. Q., & Reichart, D. E. 2000, ApJ, 536, 1 [Google Scholar]
- Lazzati, D., Covino, S., & Ghisellini, G. 2002, MN, 330, 583 [Google Scholar]
- Ledoux, C., Jakobsson, P., Jaunson, A. O., et al. 2007, GCN #7023 [Google Scholar]
- Leloudas, G., Sollerman, J., Levan, A. J., et al. 2010, A&A, 518, A29 [NASA ADS] [CrossRef] [EDP Sciences] [Google Scholar]
- Levan, A. J., Fruchter, A., & Rhoads, J. 2006, ApJ, 647, 471 [NASA ADS] [CrossRef] [Google Scholar]
- Levan, A. J., Graham, J., Fruchter, A., et al. 2010, GCN #10349 [Google Scholar]
- Liang, S. L., & Li, A. 2010, ApJ, 710, 648 [NASA ADS] [CrossRef] [Google Scholar]
- Löw, S., Krühler, T., Greiner, J., et al. 2008, GCN #8540 [Google Scholar]
- Malesani, D., Fynbo, J. P. U., Jakobsson, P., et al. 2008, GCN #7544 [Google Scholar]
- Malesani, D., Fynbo, J. P. U., & D’Elia, V. 2009, GCN #9944 [Google Scholar]
- McBreen, S., Krühler, T., Rau, A., et al. 2010, A&A, 516, A71 [NASA ADS] [CrossRef] [EDP Sciences] [Google Scholar]
- Melandri, A., Mundell, C. G., Kobayashi, S., et al. 2008, ApJ, 686, 1209 [NASA ADS] [CrossRef] [Google Scholar]
- Mészáros, P., & Rees, M. J. 1997, ApJ, 476, 232 [NASA ADS] [CrossRef] [Google Scholar]
- Nardini, M., Ghisellini, G., Ghirlanda, G., et al. 2006, A&A, 451, 821 [NASA ADS] [CrossRef] [EDP Sciences] [Google Scholar]
- Nicuesa Guelbenzu, A., Krühler, T., Rossi, A., & Greiner, J. 2010, GCN #10383 [Google Scholar]
- Oates, S. R., Ukwatta, T. N., Evans, P., & Breeveld, A. 2008, GCN Report #168.1 [Google Scholar]
- Olivares, F., Küpcü Yoldaş, A., Greiner, J., et al. 2009a, GCN #9283 [Google Scholar]
- Olivares, F., Afonso, P., Krühler, T., & Greiner, J. 2009b, GCN #9901 [Google Scholar]
- Paczyński, B. 1998, ApJ, 494, L45 [NASA ADS] [CrossRef] [Google Scholar]
- Pedersen, K., Hurley, K., Hjorth, J., et al. 2006, ApJ, 636, 381 [NASA ADS] [CrossRef] [Google Scholar]
- Perley, D. A., Chornock, R., Bloom, J. S., et al. 2008, GCN #7962 [Google Scholar]
- Perley, D. A., Cenko, S. B., Bloom, J. S., et al. 2009, AJ, 138, 1690 [NASA ADS] [CrossRef] [Google Scholar]
- Piro, L., Frail, D. A., Gorosabel, J., et al. 2002, ApJ, 577, 680 [NASA ADS] [CrossRef] [Google Scholar]
- Predehl, P., & Schmitt, J. H. M. M. 1995, A&A, 293, 889 [NASA ADS] [Google Scholar]
- Prochaska, J. X., Thöne, C. C., & Malesani, D. 2007a, GCN #6698 [Google Scholar]
- Prochaska, J. X., Perley, D. A., & Modjaz, M. 2007b, GCN #6864 [Google Scholar]
- Prochaska, J. X., Sheffer, Y., Perley, D. A., et al. 2009, ApJ, 691, L27 [NASA ADS] [CrossRef] [Google Scholar]
- Rau, A., Savaglio, S., Krühler, T., et al. 2010, ApJ, 720, 862 [NASA ADS] [CrossRef] [Google Scholar]
- Reichart, D. E. 1999, ApJ, 553, 235 [Google Scholar]
- Richardson, D., Branch, D., & Baron, E. 2006, AJ, 131, 2233 [NASA ADS] [CrossRef] [Google Scholar]
- Rol, E., Wijers, R. A. M. J., Kouveliotou, C., et al. 2005, ApJ, 624, 868 [NASA ADS] [CrossRef] [Google Scholar]
- Roming, P. W. A., & Mason, K. O. 2006, in Gamma-Ray Bursts in the Swift Era, Washington, Dec. 2005, ed. S. S. Holt, N. Gehrels, & J. A. Nousek, AIP Conf. Proc., 836, 224 [Google Scholar]
- Roming, P. W. A., Kennedy, T. E., Mason, K. O., et al. 2005, SSR, 120, 95 [Google Scholar]
- Roming, P. W. A., Koch, T. S., Oates, S. R., et al. 2009, ApJ, 690, 163 [NASA ADS] [CrossRef] [Google Scholar]
- Rossi, A., Greiner, J., Küpcü Yoldaş, A., & Yoldaş, A. 2008a, GCN #7319 [Google Scholar]
- Rossi, A., Filgas, R., Krühler, T., et al. 2008b, GCN #7756 [Google Scholar]
- Rossi, A., Greiner, J., Krühler, T., et al. 2008c, GCN #8218 [Google Scholar]
- Rossi, A., Krühler, T., Greiner, J., et al. 2008d, GCN #8268 [Google Scholar]
- Rossi, A., Krühler, T., Greiner, J., & Yoldaş, A. 2009a, GCN #9408 [Google Scholar]
- Rossi, A., Olivares, F., & Greiner, J. 2009b, GCN #9456 [Google Scholar]
- Rykoff, E. S., & Rujopakarn, W. 2008, GCN #7593 [Google Scholar]
- Savaglio, S., Rau, A., Greiner, J., et al. 2010, submitted [Google Scholar]
- Schady, P., Page, M. J., Oates, S. R., et al. 2010, MN, 401, 2773 [Google Scholar]
- Schlegel, D., Finkbeiner, D., & Davis, M. 1998, ApJ, 500, 525 [NASA ADS] [CrossRef] [Google Scholar]
- Smartt, S. J., Eldridge, J. J., Crockett, R. M., & Maund, J. R. 2009, MN, 395, 1409 [Google Scholar]
- Stratta, G., Fiore, F., Antonelli, L. A., et al. 2004, ApJ, 608, 846 [NASA ADS] [CrossRef] [Google Scholar]
- Tanvir, N. R., Levan, A. J., Rol, E., et al. 2008, MN, 388, 1743 [Google Scholar]
- Tanvir, N. R., Levan, A. J., Cucchiara, A., et al. 2010a, GCN #10366 [Google Scholar]
- Tanvir, N. R. 2010, in Deciphering the ancient Universe with GRBs, ed. N. Kawai, & S. Nagataki (Kyoto), in press [Google Scholar]
- Thöne, C. C., de Cia, A., Malesani, D., & Vreeswijk, P. M. 2008a, GCN #7587 [Google Scholar]
- Thöne, C. C., Malesani, D., Vreeswijk, P. M., et al. 2008b, GCN #7602 [Google Scholar]
- Thöne, C. C., de Ugarte, A., Vreeswijk, P. M., et al. 2008c, GCN #8058 [Google Scholar]
- Thöne, C. C., Jakobsson, P., de Cia, A., et al. 2009, GCN #9409 [Google Scholar]
- Tody, D. 1993, ASP Conf. Ser., 52, 173 [Google Scholar]
- Updike, A., Afonso, P., Clemens, C., et al. 2008, GCN #8693 [Google Scholar]
- Updike, A., Hartmann, D. H., Greiner, J., & Klose, S. 2009a, in Gamma-Ray Bursts, Proc. 6th Huntsville Symp., Oct. 2008, ed. C. Meegan, N. Gehrels, & C. Kouveliotou, AIP Conf. Proc., 1133, 257 [Google Scholar]
- Updike, A., Klose, S., Clemens, C., et al. 2009b, GCN #8983 [Google Scholar]
- Updike, A., Rau, A., Krühler, T., Olivares, F., & Greiner, J. 2009c, GCN #9773 [Google Scholar]
- Updike, A., Olivares, F., Afonso, P., et al. 2009d, GCN #9794 [Google Scholar]
- Updike, A., Rossi, A., Rau, A., et al. 2009e, GCN #10195 [Google Scholar]
- Valageas, P., Schaeffer, R., & Silk, J. 1999, A&A, 345, 691 [NASA ADS] [Google Scholar]
- van der Horst, A. J., Kouveliotou, C., Gehrels, N., et al. 2009, ApJ, 699, 1087 [NASA ADS] [CrossRef] [Google Scholar]
- Vergani, S. D., D’Avanzo, P., Malesani, D., et al. 2010, GCN #10495 [Google Scholar]
- Villasenor, J., Ricker, G., Vanderspek, R., et al. 2004, in Proc. 35th COSPAR Sci. Assembly, Paris, 1225 [Google Scholar]
- Vreeswijk, P. M., Thöne, C. C., Malesani, D., et al. 2008, GCN #7601 [Google Scholar]
- Waters, L. B. F. M. 2010, in Hot and Cool: Bridging Gaps in Massive Star Evolution, ed. C. Leitherer et al., ASP Conf. Ser., 425, 267 [Google Scholar]
- Watson, D., Hjorth, J., Fynbo, J. P. U., et al. 2007, ApJ, 660, L101 [NASA ADS] [CrossRef] [Google Scholar]
- Yuan, F., Schady, P., Racusin, J. L., et al. 2010, ApJ, 711, 870 [NASA ADS] [CrossRef] [Google Scholar]
All Tables
GROND afterglow detection fraction of long-duration bursts as a function of time delay of the start of the observation after the GRB trigger.
GRBs observed with GROND within 240 min after the Swift trigger (including 39 long- and 4 short-duration bursts).
All Figures
|
Fig. 1 Spectral energy distributions of a selection of the long-duration GRBs with redshift in our sample, labeled on the right side. The X-ray spectrum has been extracted from early times, but after the rapid fading and excluding flares, and then shifted in mid-time to the GROND mid-time (see text for details). The dashed lines indicate the best-fit model for each burst, with the break between the X-ray and optical/NIR always treated as a free parameter. Curvature in the X-rays is due to Galactic plus host-intrinsic absorption, and curvature in the observed optical/NIR range due to host-intrinsic extinction (data have been corrected for Galactic foreground extinction before fitting). For better visibility, the intensity scaling has been choosen to minimize overlap of the different SEDs, and thus is completely arbitrary. |
| In the text | |
|
Fig. 2 The distribution of our sample GRBs in the plane of R-band flux over X-ray flux Jakobsson et al. (2004). For GRB 080413B we show as a thick solid line the temporal evolution of βOX with time during the first 2 days of the afterglow evolution (from top to bottom left). |
| In the text | |
|
Fig. 3 The effect of the combination of various values of intrinsic extinction AV (lines with labels) and redshift, producing an effective dimming in the R band as given on the y-axis. The solid lines have been computed assuming a dust extinction curve as described in Reichart (1999) but with no 2175 Å bump and an opacity due to intergalactic hydrogen approximated by τ(HI) = 2.6 × (1 + z)3.3 for 700 nm/(1 + z) ≤ 121.6 nm (Valageas, Schaeffer & Silk 1999). Dots represent the GRBs of our sample for which we have an AV measurement from the GROND SED. GRBs with effective R-band reduction of > 0.5 mag are labeled; GRBs 080218B and 080915 lie above the correspondingly labeled dashed lines which correspond to the pairs of (z,AV) values described in the text. Moderate AV at moderate redshifts can easily produce a dimming of 1–3 mag in the R band. |
| In the text | |
|
Fig. 4 The distribution of measured AV from our sample with redshift as compared to that of Kann et al. (2010). The dashed line is the theoretical distribution, normalized to the same number of objects in the sample, of a Monte Carlo simulation of random sightlines through an evolving galaxy model (Updike et al. 2009a). A KS-test returns a rejection probability of 54% for the null hypothesis that the two distributions are drawn from the same sample. |
| In the text | |
|
Fig. 5 Relation, or lack thereof, between best-fit rest-frame extinction and rest-frame neutral hydrogen absorption of our sample. The lines are the relation for our Galaxy (Predehl & Schmitt 1995), as well as 10 × and 100 × larger NH (from bottom to top). GRBs 080129 and 080516 are missing as they fall outside the plot with their large NH values. |
| In the text | |
|
Fig. 6 Redshift distribution of our GROND sub-sample (blue) vs. that of the hitherto most complete sample of (Fynbo et al. 2009b) (bursts with upper limits have been omitted). |
| In the text | |
Current usage metrics show cumulative count of Article Views (full-text article views including HTML views, PDF and ePub downloads, according to the available data) and Abstracts Views on Vision4Press platform.
Data correspond to usage on the plateform after 2015. The current usage metrics is available 48-96 hours after online publication and is updated daily on week days.
Initial download of the metrics may take a while.