Fig. 2
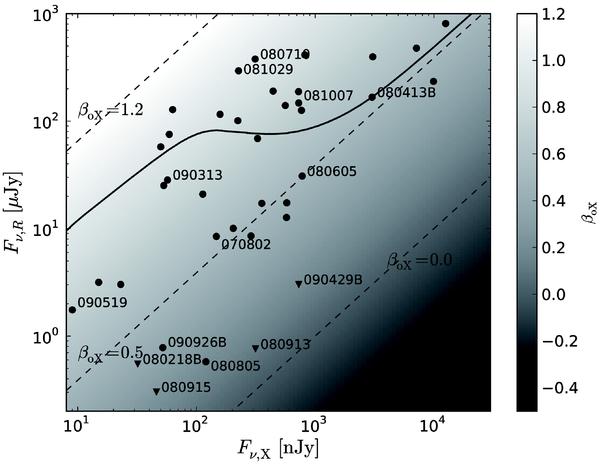
The distribution of our sample GRBs in the plane of R-band flux over X-ray flux Jakobsson et al. (2004). For GRB 080413B we show as a thick solid line the temporal evolution of βOX with time during the first 2 days of the afterglow evolution (from top to bottom left).
Current usage metrics show cumulative count of Article Views (full-text article views including HTML views, PDF and ePub downloads, according to the available data) and Abstracts Views on Vision4Press platform.
Data correspond to usage on the plateform after 2015. The current usage metrics is available 48-96 hours after online publication and is updated daily on week days.
Initial download of the metrics may take a while.