Fig. 4
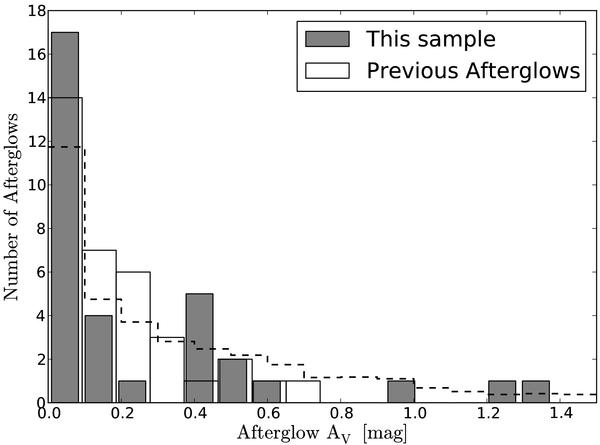
The distribution of measured AV from our sample with redshift as compared to that of Kann et al. (2010). The dashed line is the theoretical distribution, normalized to the same number of objects in the sample, of a Monte Carlo simulation of random sightlines through an evolving galaxy model (Updike et al. 2009a). A KS-test returns a rejection probability of 54% for the null hypothesis that the two distributions are drawn from the same sample.
Current usage metrics show cumulative count of Article Views (full-text article views including HTML views, PDF and ePub downloads, according to the available data) and Abstracts Views on Vision4Press platform.
Data correspond to usage on the plateform after 2015. The current usage metrics is available 48-96 hours after online publication and is updated daily on week days.
Initial download of the metrics may take a while.