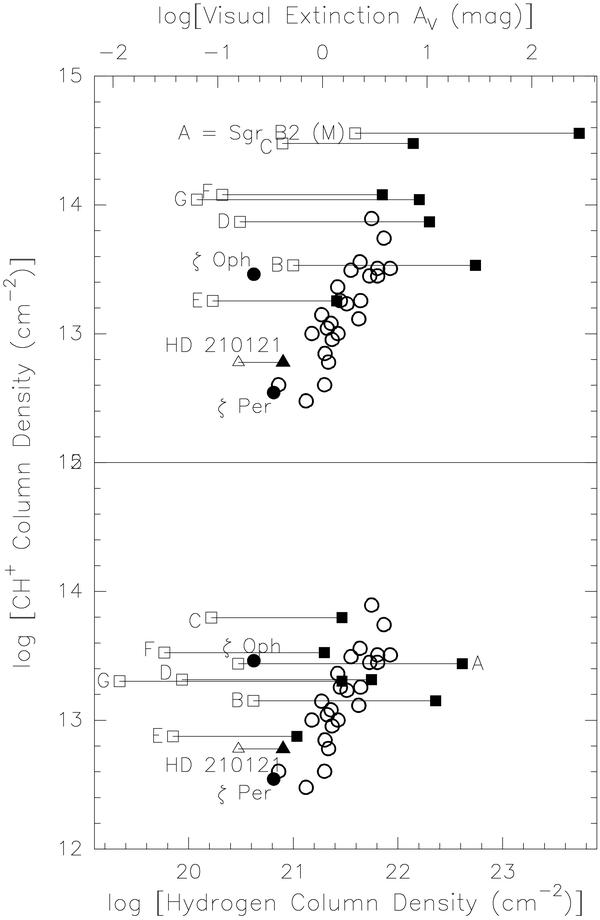
Fig. 9

CH+ column density versus hydrogen column density. The ordinate gives the CH+ column density for the seven different velocity intervals listed in Table 7. The capital letters designate the entries in table (top to bottom). The open circles represent data taken from the diffuse/translucent cloud sample of Gredel (1997). The squares connected by lines mark the CH+ column densities determined in this work. For the open squares it is assumed that all the absorption is from atomic gas; the abscissa corresponds to the HI column density (Table 6), whereas for the filled squares it is assumed that all the absorption is from molecular gas; the abscissa corresponds to the H2 column density (Table 6). For the upper panel, column densities were calculated from the absorption over the whole velocity range of each interval, whereas in the lower panel average column densities normalized to a typical line width of 4.3 km s-1 were used (see text).
Current usage metrics show cumulative count of Article Views (full-text article views including HTML views, PDF and ePub downloads, according to the available data) and Abstracts Views on Vision4Press platform.
Data correspond to usage on the plateform after 2015. The current usage metrics is available 48-96 hours after online publication and is updated daily on week days.
Initial download of the metrics may take a while.


