Fig. 3
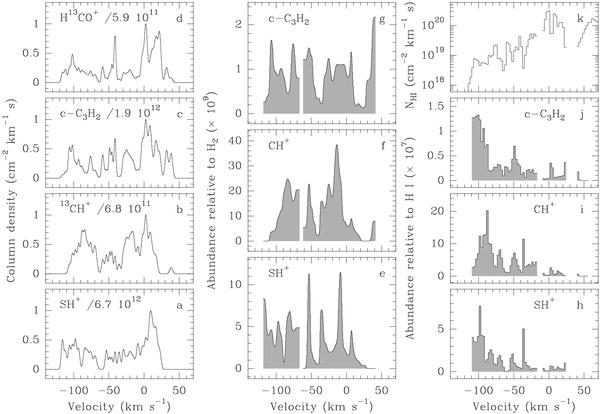
a)–d) Column density profiles computed by adding the Gaussian velocity absorption components listed in Table 3. The components with upper limit were not included. e)–g) Abundance profiles relative to H2. The H2 column density was computed from the HCO+ column density assuming an HCO+ abundance of 5 × 10⁻⁹. h)–j) Abundance profiles relative to H i. k) The H i column density was computed from comparing an H i absorption with an H i emission profile (see text).
Current usage metrics show cumulative count of Article Views (full-text article views including HTML views, PDF and ePub downloads, according to the available data) and Abstracts Views on Vision4Press platform.
Data correspond to usage on the plateform after 2015. The current usage metrics is available 48-96 hours after online publication and is updated daily on week days.
Initial download of the metrics may take a while.