| Issue |
A&A
Volume 524, December 2010
|
|
|---|---|---|
| Article Number | A32 | |
| Number of page(s) | 14 | |
| Section | Astrophysical processes | |
| DOI | https://doi.org/10.1051/0004-6361/201015332 | |
| Published online | 22 November 2010 | |
Searching for chameleon-like scalar fields with the ammonia method⋆,⋆⋆
II. Mapping of cold molecular cores in NH3 and HC3N lines
1
INAF - Osservatorio Astronomico di Trieste,
via G. B. Tiepolo 11
34131
Trieste
Italy
e-mail: This email address is being protected from spambots. You need JavaScript enabled to view it.
2
Key Laboratory for Research in Galaxies and Cosmology, Shanghai
Astronomical Observatory, CAS, 80
Nandan Road, Shanghai
200030, PR
China
3
Ioffe Physical-Technical Institute, Polytekhnicheskaya Str. 26, 194021
St. Petersburg,
Russia
4
Institute for Applied Physics, Uljanov Str. 46, 603950
Nizhny Novgorod,
Russia
5
Max-Planck-Institut für Radioastronomie,
Auf dem Hügel 69,
53121
Bonn,
Germany
6
Hamburger Sternwarte, Universität Hamburg,
Gojenbergsweg 112,
21029
Hamburg,
Germany
7
Petersburg Nuclear Physics Institute,
188300
Gatchina,
Russia
Received: 4 July 2010
Accepted: 5 August 2010
Abstract
Context. In our previous work we found a statistically significant offset ΔV ≈ 27 m s-1 between the radial velocities of the HC3N J = 2−1 and NH3 (J,K) = (1,1) transitions observed in molecular cores from the Milky Way. This may indicate that the electron-to-proton mass ratio, μ ≡ me/mp, increases by ~3 × 10⁻⁸ when measured under interstellar conditions with matter densities of more than 10 orders of magnitude lower than with laboratory (terrestrial) environments.
Aims. We map four molecular cores L1498, L1512, L1517, and L1400K selected from our previous sample to estimate systematic effects in ΔV due to possible velocity gradients or other sources across the cloud and to check the reproducibility of the velocity offsets on the year-to-year time base.
Methods. We use the ammonia method, which involves observations of inversion lines of NH3 complemented by rotational lines of other molecular species and allows us to test changes in μ caused by a higher sensitivity of the inversion frequencies to the μ-variation than with the rotational frequencies.
Results. We find that in two cores L1498 and L1512 the NH3 (1, 1) and HC3N (2–1) transitions closely trace the same material and show an offset of ΔV ≡ Vlsr(HC3N) – Vlsr(NH3) = 26.9 ± 1.2stat ± 3.0sys m s-1 throughout the entire clouds. The offsets measured in L1517B and L1400K are 46.9 ± 3.3stat ± 3.0sys m s-1 and 8.5 ± 3.4stat ± 3.0sys m s-1, respectively, and are, probably, subject to Doppler shifts due to spatial segregation of HC3N versus NH3. We also determine frequency shifts caused by external electric and magnetic fields and by the cosmic black body radiation-induced Stark effect and find that they are less than 1 m s-1.
Conclusions. The measured velocity offset in L1498 and L1512, when interpreted in terms of Δμ/μ ≡ (μobs − μlab)/μlab, gives Δμ/μ = (26 ± 1stat ± 3sys) × 10-9. Although this estimate is based on a limited number of sources and molecular pairs used in the ammonia method, it demonstrates a high accuracy with which the fundamental physics can be tested by means of radio observations. The non-zero signal in Δμ/μ should be further examined as larger and more accurate data sets become available.
Key words: line: profiles / ISM: molecules / radio lines: ISM / techniques: radial velocities / elementary particles
Based on observations obtained with the 100-m telescope at Effelsberg/Germany, which is operated by the Max-Planck Institut für Radioastronomie on behalf of the Max-Planck-Gesellschaft (MPG).
Tables 2–5 are only available in electronic form at http://www.aanda.org
© ESO, 2010
1. Introduction
The present paper continues our study (Levshakov et al. 2008; Molaro et al. 2009; Levshakov et al. 2010a, hereafter Paper I) of differential measurements of the electron-to-proton mass ratio, μ = me/mp, by means of high-resolution spectral observations (FWHM ~ 30−40 m s-1) of narrow emission lines (FWHM < 200 m s-1) of N-bearing molecules arising in cold and dense molecular clouds (Tkin ~ 10 K, n ~ 104−105 cm-3). This study is aimed, in general, at testing the Einstein equivalence principle of local position invariance (LPI), which states that outcomes of physical nongravitational experiments should be independent of their position in space-time (e.g., Dent 2008). However, the violation of LPI is anticipated in nonstandard physical theories associated with varying fundamental constants and, in particular, in those dealing with dark energy.
A concept of dark energy with negative pressure appeared in physics long before the discovery of the accelerating universe through observations of nearby and distant supernovae type Ia (Perlmutter et al. 1998; Riess et al. 1998). Early examples of dark energy in the form of a scalar field with a self-interaction potential can be found in a review by Peebles & Ratra (2003). To explain the nature of dark energy, many sophisticated models have been suggested (see, e.g., Caldwell et al. 1998), and among them the scalar fields that are ultralight in the cosmic vacuum but that possess a high mass locally when they are coupled to ordinary matter by the so-called chameleon mechanism (Khoury & Weltman 2004a,b; Brax et al. 2004; Avelino 2008; Burrage et al. 2009; Davis et al. 2009; Brax 2009; Upadhye et al. 2010; Brax & Zioutas 2010). A subclass of such models considered by Olive & Pospelov (2008) predicts that fundamental physical quantities, such as elementary particle masses and low-energy coupling constants, may also depend on the local matter density.
In the standard model of particle physics there are two fundamental parameters with the dimension of mass – the Higgs vacuum expectation value (VEV ~ 200 GeV), which determines the electroweak unification scale, and the quantum chromodynamics (QCD) scale ΛQCD ~ 220 MeV, which characterizes the strength of the strong interaction. The masses of the elementary particles such as the electron me and the quarks mq are proportional to the Higgs VEV, and the mass of the composite particle proton mp is proportional to ΛQCD. Therefore, by probing the dimensionless mass ratio μ = me/mp we can experimentally test the ratio of the electroweak scale to the strong scale at different physical conditions (Chin et al. 2009).
In this regard, the masses of the elementary particles mediated by the chameleon-like scalar fields should depend on the local density of baryons and electrons. Among the observationally accessible media the most dramatic difference of local densities occurs between terrestrial laboratories and cosmic space. For instance, a typical interstellar molecular cloud with the kinetic temperature Tkin ~ 10 K and the gas number density nH2 ~ 105 cm-3 has the local density of ρspace ≈ 3 × 10-19 g cm-3. Laboratory vacuum spectrographs usually operate in the pressure range from 1 to 10 mtorr and at the temperature regime of Tkin ~ 10−40 K (e.g., Willey et al. 2002; Ronningen & De Lucia 2005; Ross & Willey 2005). This gives ρlab ≈ 3 × 10⁻⁹ g cm-3 if Tkin = 10 K, P = 1 mtorr, and the vacuum chamber is filled by H2. In this case, the ratio ρlab/ρspace exceeds 1010. Besides, the size of the vacuum chamber is ~10 cm, and its walls are naturally made of extremely heavy materials; i.e., the chameleon fields in the chamber are subject to high-density boundary conditions.
It follows from the above considerations that the ratio μ = me/mp measured in low-density environments of the interstellar and/or intergalactic medium may differ from its terrestrial (laboratory) value. To estimate the fractional changes in μ, Δμ/μ ≡ (μobs − μlab)/μlab, the so-called ammonia method was elaborated by Flambaum & Kozlov (2007, hereafter FK), which involves observations of inversion lines of NH3 complemented by rotational lines of other molecular species. The inversion transitions of ammonia and its isotopologues strongly depend on μ (van Veldhoven et al. 2004; FK; Kozlov et al. 2010). For NH3, the fractional change in frequency is Δνinv/νinv = 4.46 Δμ/μ, whereas for rotational lines, Δνrot/νrot = Δμ/μ. Therefore, the comparison of radial velocities of NH3 inversion lines, Vinv, with radial velocities of rotational transitions, Vrot, provides a sensitive limit to the variation of μ (FK):  (1)where c is the speed of light. Thus, by measuring the line shifts in cosmic objects where the local matter density is significantly lower than in laboratory experiments, one can probe whether the mass-ratio μ is position-invariant or not. Such tests will complement current cosmological probes of dark energy and its couplings to matter.
NH3 was detected in numerous molecular clouds within the Milky Way (e.g., Jijina et al. 1999) and even at significant redshifts (Henkel et al. 2005, 2008). In particular, observations of two molecular absorption-line systems at redshift z = 0.68 and z = 0.89 towards, respectively, the gravitationally lensed quasars B0218+357 and PKS 1830–211 yielded constraints on Δμ/μ down to 1 ppm (FK; Murphy et al. 2008; Menten et al. 2008; Henkel et al. 2009)1. However, Δμ/μ can be probed at orders of magnitude more sensitive levels if nearby Galactic clouds are studied. Then a spectral resolution of FWHM ~ 30 m s-1 allows us to measure the line position with uncertainties of a few m s-1. In 2008–2009, we observed 41 molecular cores in the disk of the Milky Way in three molecular transitions NH3 (J,K) = (1,1), HC3N J = 2−1, and N2H+J = 1−0 at the radio telescopes in Medicina (32-m), Nobeyama (45-m), and Effelsberg (100-m) and obtained a statistically significant positive velocity offset between the rotational HC3N (2–1), N2H+ (1−0) and inversion NH3 (1, 1) lines. Since these transitions show good correlation in their spatial distributions, such an offset might indicate that μ increases at low interstellar densities compared with its terrestrial value (Paper I). The most accurate estimate was obtained from the Effelsberg dataset consisting of twelve pairs of NH3 and HC3N lines: ΔV = 23 ± 4stat ± 3sys m s-1, which translates into Δμ/μ = 22 ± 4stat ± 3sys ppb. Because of a rounded value for the fast Fourier transform spectrometer (FFTS) channel separation (Δν = 1.220 kHz for NH3 and Δν = 1.221 kHz for HC3N instead of 1.220703125 kHz) not taken into account in Paper I, the corrected Δμ/μ is to be 26 ± 4stat ± 3sys ppb.
These observations were carried out in a single position mode; i.e., we observed only the central parts of molecular cores showing strongest NH3 emission. The aim was to find suitable targets for the most precise measurements of the velocity offsets ΔV between rotational and inversion transitions. In the present paper, we report on new observations where we measure ΔV at different positions across individual clouds in order to test the reproducibility of the velocity offsets in the presence of the large-scale velocity gradients. For this purpose, from the list of molecular cores observed in our previous study with the Effelsberg telescope, we selected the objects that comply with the following criteria: (i) profiles of the NH3 (1, 1) and HC3N (2–1) hyperfine structure (hfs) transitions are symmetric and well-described by a single-component Gaussian model; and (ii) the line widths are thermally dominated; i.e., the parameter β = σv(NH3)/σv(HC3N) ≥ 1, where σv is the velocity dispersion. The chosen targets are molecular cores L1498, L1512, L1517B, and L1400K, which have already been extensively studied in many molecular lines (e.g. Benson & Myers 1989; Lee et al. 2001; Lee et al. 2003; Tafalla et al. 2004, 2006; Crapsi et al. 2005). In the present paper we describe the high-precision measurements of the radial velocities of NH3 (1, 1) and HC3N (2–1) hyperfine transitions in these clouds from 31 lines of sight in total.
2. Observations
Source positions, offsets (Δα,Δδ) and date of observations.
Our observations targeted a sample of well-studied nearby molecular cores that are essentially devoid of associated IR sources (so-called starless cores with narrow emission lines). All of our objects lie in the Taurus-Auriga-Perseus molecular complex, i.e., at the distance of about 140 pc (L1498, L1512, L1517BC) and 170 pc (L1400K) from the solar system (Jijina et al. 1999). Observations used the 100-m Effelsberg radio telescope in January 2010. The positions observed are listed in Table 1. All sources, except L1517B, have the same central coordinates as used in Paper I. For L1517B, the central position is shifted at (Δα,Δδ) = (15′′,15′′) with respect to the previous coordinates, and the source is called L1517BC. The (J,K) = (1, 1) inversion line of ammonia (NH3) at 23.694 GHz and the J = 2−1 rotation line of cyanoacetylene (HC3N) at 18.196 GHz were measured with a K-band HEMT (high electron mobility transistor) dual channel receiver2, yielding spectra with an angular resolution of HPBW ~ 40′′ in two orthogonally oriented linear polarizations. Averaging the emission from both channels gives typical system temperatures of 100–150 K for NH3 and 80–100 K for HC3N on a main beam brightness-temperature scale.
The measurements were carried out in frequency-switching mode using a frequency throw of 5 MHz. The backend was an FFTS operated with its minimum bandwidth of 20 MHz providing simultaneously 16 384 channels for each polarization. The resulting channel separations are 15.4 m s-1 for NH3 and 20.1 m s-1 for HC3N. We note, however, that the true velocity resolution is about twice lower, FWHM ~ 30 m s-1 and 40 m s-1, respectively (Klein et al. 2006).
The sky frequencies were reset at the onset of each scan and the Doppler tracking was used continuously to track Doppler shifts during the observations. In the Effelsberg driving program, the position of the center of gravity of Earth is taken from the JPL ephemerides, including the influence of the Moon, and the rotation of Earth at the telescope position is added to this center of gravity. The velocity of the source with respect to local standard of rest (LSR), Vlsr, is corrected for these motions and the corrected value of Vlsr determines the current sky frequency. The stability of the LO-frequency during 5-min exposures was about 10-14.
Observations started by measuring the continuum emission of calibration sources (NGC 7027, W3(OH), 3C 286) and continued by performing pointing measurements toward a source close to the spectroscopic target. Spectral line measurements were interspersed with pointing measurements at least once per hour. The calibration is estimated to be accurate to ± 15% and the pointing accuracy to be superior to 10 arcsec. Each molecular transition was observed in a set of four sequential 5 min exposures, which were repeated twice at 18 GHz to compensate for the nonoperating channel Rx1. Thus, the total exposure time at one coordinate point was one hour. Some points were observed several times to control the accuracy of the ΔV measurements. All spectra were obtained with a comparable noise level, which is indicated by the rms values in Table 1. The position offsets within each individual cloud are shown in Fig. 1.
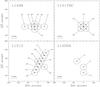 |
Fig. 1 Maps of L1498, L1512, L1517BC, and L1400K showing positions where the radial velocity differences, ΔV, between the HC3N (2–1) 18.196 GHz line and the NH3 (1, 1) 23.694 GHz line have been measured at the Effelsberg 100-m radio telescope. On each panel the numbers are the mean velocity shifts ΔV (in m s-1) between the corresponding ΔVs and ΔVa values listed in Tables 2–5. The circles show the half-power beam width at 23 GHz, whereas the linear scale is indicated by the horizontal bars. Reference positions are given in Table 1. |
3. Analysis
We used the CLASS reduction package3 for standard data reduction. After corrections for the rounded frequencies (see Sect. 1), the individual exposures were co-added to increase the signal-to-noise ratio, S/N. The spectra were folded to remove the effects of the frequency switch, and base lines were determined for each spectrum. The resolved hfs components show no kinematic substructure and consist of an apparently symmetric peak profile without broadened line wings or self-absorption features, as shown in Fig. 2 where the observed profiles of the NH3 (1, 1) and HC3N (2–1) lines toward L1498 are plotted. The line parameters, such as the total optical depth in the transition, τtot (i.e., the peak optical depth if all hyperfine components were placed at the same velocity), the radial velocity, Vlsr, the line broadening Doppler parameter, b, and the amplitude, A, were obtained through the fitting of the one-component Gaussian model to the observed spectra as described in Paper I: ![Mathematical equation: \begin{equation} T(v) = A \cdot \left[ 1 - \exp(-t(v)) \right]\, , \label{eq2} \end{equation}](/articles/aa/full_html/2010/16/aa15332-10/aa15332-10-eq80.png) (2)with
(2)with ![Mathematical equation: \begin{equation} t(v) = \tau \cdot \sum^k_{i=1}\, a_i\, \exp \left[ -{(v - v_i - V_{\rm lsr})^2}/{b^2} \right],\label{eq3} \end{equation}](/articles/aa/full_html/2010/16/aa15332-10/aa15332-10-eq81.png) (3)which transforms for optically thin transitions into
(3)which transforms for optically thin transitions into ![Mathematical equation: \begin{equation} T(v) = A' \cdot \sum^k_{i=1}\, a_i\, \exp \left[ -{(v - v_i - V_{\rm lsr})^2}/{b^2} \right]. \label{eq4} \end{equation}](/articles/aa/full_html/2010/16/aa15332-10/aa15332-10-eq82.png) (4)The sum in (3) and (4) runs over the k = 18 and k = 6 hfs components of the NH3 (J,K) = (1,1) and HC3N J = 2−1 transitions, respectively.
(4)The sum in (3) and (4) runs over the k = 18 and k = 6 hfs components of the NH3 (J,K) = (1,1) and HC3N J = 2−1 transitions, respectively.
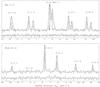 |
Fig. 2 Spectra of NH3 (1, 1) and HC3N (2−1) lines toward the molecular core L1498 obtained at the Effelsberg 100-m radio telescope. The offset (Δα,Δδ) = (0′′,0′′). The histograms show the data averaged over two spectral channels. The fits are shown with solid curves. The vertical tick-marks indicate the positions and the relative strengths of the hyperfine structure components for local thermodynamical equilibrium and optically thin emission. The residual spectra are plotted below each profile. The fitting parameters are presented in Table 2. |
The rest-frame frequencies of the NH3 hfs components are taken from Kukolich (1967) and listed in Table 2 (Paper I). We checked these frequencies using the last JPL model4, which takes the fit to all published ammonia data into account. The difference between various estimates does not exceed 0.05 kHz. In addition, Lapinov et al. (in prep.) carried out new laboratory measurements of the frequencies of the NH3 (1, 1) hfs components, and their results coincide with Kukolich’s frequencies within the 0.2 kHz range.
The rest-frame frequencies of the HC3N (2–1) hfs components listed in Table 3 (Paper I) are based on Lapinov (2008, private comm.) calculations that combine all available laboratory measurements. These frequencies agree with the data from the Cologne Database for Molecular Spectroscopy (Müller et al. 2005) within a 1σ uncertainty interval, but Lapinov’s values have a slightly higher precision: εν ≃ 0.17 kHz versus 0.2 to 0.7 kHz by Müller et al. The recent laboratory measurements of the HC3N (2–1) frequencies by Lapinov et al. (in prep.) did not show any systematic shifts between the previously obtained and new measured values: all frequencies agree within 0.2 kHz. At the moment the accuracy with which the frequencies of NH3 (1, 1) and HC3N (2–1) are known is the highest among all observable molecular transitions, with the uncertainties εv(NH3) ≃ 0.6 m s-1 (≃50 Hz) and εv(HC3N) ≃ 2.8 m s-1 (≃170 Hz).
We also estimated the kinetic temperature, Tkin, and the nonthermal (turbulent) velocity dispersion, σturb, based on the line broadening Doppler parameters,  , of the NH3 (1, 1) and HC3N (2–1) lines. Here σv is the line of sight velocity dispersion of the molecular gas within a given cloud. If the two molecular transitions trace the same material and have the same nonthermal velocity component, then σv is the quadrature sum of the thermal σth and turbulent σturb velocity dispersions. In this case a lighter molecule with a mass ml should have a wider line width than with a heavier molecule with mh > ml.
For thermally dominated line widths (β > 1, see Sect. 1) and co-spatially distributed species one has the following relations (e.g., Fuller & Myers 1993):  (5)and
  (6)where k is Boltzmann’s constant, and the thermal velocity dispersion, σth, is given by
  (7)However, HC3N is usually distributed in a larger volume of the molecular core than NH3: in general, N-bearing molecules trace the inner core, whereas C-bearing molecules occupy the outer part (e.g., Di Francesco et al. 2007). Such a chemical differentiation and velocity gradients within the core may cause a larger nonthermal component in the velocity distribution of HC3N. If both molecules are shielded well from the external incident radiation, and the gas temperature mainly come from the heating by cosmic rays, then a formal application of Eqs. (5) and (6) to the apparent line widths provides a lower limit on Tkin and an upper limit on σturb.
We now consider the relative radial velocities of HC3N and NH3, ΔV = Vrot(HC3N) – Vinv(NH3). As discussed in Paper I, the velocity offset ΔV can be represented by the sum of two components,  (8)where ΔVμ is the shift due to a putative μ-variation, and ΔVn is the Doppler noise – a random component caused by possible spatial segregation of HC3N versus NH3 and their different irregular Doppler shifts. The Doppler noise can mimic or obliterate a real signal, hence should be minimized. This can be achieved either by detailed mapping of the velocity field in molecular lines that closely trace each other as performed in the present study, or by averaging over a large data sample as realized in Paper I.
4. Results
Equations (2)–(4) define our model of the hfs line profiles. The model parameters were determined by using a nonlinear least-squares method (LSM). The best-fit values of the radial velocity Vlsr and the Doppler width b are given in Tables 2–5, Cols. 3–5. An example of the fit is shown in Fig. 2. The residuals depicted below the profiles are normally distributed with zero mean and dispersion equal to the noise dispersion in the observed spectrum. While dealing with NH3, we calculated two sets of the fitting parameters: (i) based on the analysis of only optically thin satellite lines with ΔF1 ≠ 0 (Col. 3); and (ii) obtained from the fit to the entirety of the NH3 (1, 1) spectrum including the main transitions with ΔF1 = 0, which have optical depths τ≳1 (Col. 4), as can be inferred from the relative intensities of the hfs components. The corresponding radial velocity offsets are marked by ΔVs and ΔVa. All hfs transitions of the HC3N (2–1) line from our sample are optically thin (τ≲1), and their Vlsr and b values are listed in Col. 5. The calculated limiting values of the kinetic temperature Tkin (lower limit) and the nonthermal rms velocity dispersion σturb (upper limit) of the material presumably traced by the NH3 and HC3N emission are given in Cols. 8 and 9. Column 10 presents the S/N per spectral channel at the maximum intensity peak of NH3/HC3N.
The 1σ errors of the fitting parameters were calculated from the diagonal elements of the covariance matrix at the minimum of χ2. In addition, the error of the radial velocity Vlsr was calculated independently by the Δχ2 method. However, because of the spectral leakage (Klein et al. 2006), the fluxes in neighboring spectral channels are correlated (correlation coefficient r ≃ 0.61), and these errors must be further corrected. The correlation length of ξ = 2 spectral channels can be deduced from the analysis of the autocorrelation function (ACF) of the intensity fluctuations in the spectral regions free of emission lines (computational details are given in Levshakov et al. 1997, 2002). The data become less correlated (ξ = 1, r ≃ 0.36) after averaging over two neighboring spectral channels. The LSM is known to be an unbiased and minimum variance estimator (Gauss-Markov theorem) irrespective of the distribution of the measurements, including correlated data (Aitken 1934). This means that the best-fit model parameters deduced from both the strongly and less correlated spectra should coincide. Numerical tests confirm this assumption: from both spectra we obtained exactly the same Vlsr and b values, but for strongly correlated data, the errors representing the Δχ2 = 1 ellipsoid were a factor of ~1.3 smaller than the errors based on less correlated data. Thus, errors given in parentheses in Tables 2–5, Cols. 3–5, represent calculated values multiplied by this factor. These errors were further transformed into uncertainties of the quantities listed in Cols. 6–9. We also checked both folded and unfolded spectra and found that the measured velocity offsets are not affected by the folding procedure.
Since HC3N was observed with one K-band channel (Rx2) and NH3 with both Rx1 and Rx2, we compared the Rx2 data of HC3N with NH3 from the same channel and found that changes in the radial velocities were insignificant, within a 1σ uncertainty range.
Besides the formal statistical (model fitting) uncertainties, there can be additional errors caused by instrumental imperfections. To control this type of error, we carried out repeated observations at 10 offsets having the same coordinates: #3, 8 (L1498), 1, 10, 12, 13 (L1512), 1, 6 (L1517BC), and 1, 2 (L1400K) in Table 1. The ΔV dispersions resulting from these repeated measurements (Tables 2-5) are σ(ΔVs) = 1.6 m s-1 and σ(ΔVa) = 2.0 m s-1. These dispersions are systematically lower than the reported 1σ errors of ΔVs and ΔVa, which ensures that we are not missing any significant instrumental errors at the level of a few m s-1.
The comparison of the velocity dispersions determined from the NH3 (1, 1) and HC3N (2–1) lines (Tables 2-5) does not show any significant variations with position within each molecular core. All data are consistent with thermally dominated line broadening; i.e., as expected,  for both sets “s” and “a” of the data points. In particular, the latter set gives the following weighted mean values: βL1498 = 1.24(3), βL1512 = 1.32(5), βL1517BC = 1.11(1), and βL1400K = 1.23(4). The maximum contribution of the nonthermal motions to the velocity dispersion is observed in the L1517BC core. The weighted mean values of the velocity dispersions
  for NH3 range between σL1512 = 78(1) m s-1 and σL1400K = 86(1) m s-1, and for HC3N between σL1512 = 59(2) m s-1 and σL1517BC = 74(1) m s-1. This can be compared with the speed of sound inside a thermally dominated region of a cold molecular core that is defined as (e.g., Shu 1977)
  (9)where m0 is the mean molecular mass. With m0 ≈ 2.3 amu for molecular clouds, one has
  m s-1, which shows that at the typical kinetic temperature of 10 K, the nonthermal velocities are in general subsonic, and that the selected targets do represent the quiescent material at different distances from the core centers.
The nonthermal velocity dispersions derived from the apparent line widths depend on the adopted gas temperature. The gas temperature in a molecular cloud is determined by the balance between heating and cooling. If the only source of heating is the cosmic rays and the cooling comes from the line radiation mainly from CO, then a lower bound on the kinetic temperature is about 8 K (Goldsmith & Langer 1978). In cloud cores where the gas is well-shielded from the background ionizing radiation, the gas temperature is about 10 K (Goldsmith 2001). In particular, just this value is measured in the L1498, L1517B, and L1512 cores considered here (Benson & Myers 1989; Lee et al. 2003; Tafalla et al. 2004).
In the L1498 cloud, we obtain a lower limit on the kinetic temperature Tkin = 7.1 ± 0.5 K (average over 8 points), which is slightly lower than Tkin = 10 K measured by a different method from the relative population of the (J,K) = (2,2) and (1, 1) levels of NH3 described by the rotational temperature  (Tafalla et al. 2004). For L1512, the temperature averaged over 11 points (Table 3) is Tkin = 9.6 ± 0.6 K, which is consistent with the value of 10 K. The kinetic temperatures in the L1517BC core is well below the Tafalla et al. value of 9.5 K in all scanned points, which means that the nonthermal velocity dispersions of NH3 and HC3N differ significantly and that both species do not trace the same material. The three scanned points in the L1400K core show Tkin = 8.3 ± 3.2 K – close to the expected value. (Measurements of the gas temperature in this core were not performed in previous studies). We note, however, that, when the linewidths of NH3 and HC3N are comparable, the estimate by means of Eq. (5) becomes unstable and leads to unphysical results (e.g., points #6, 8 in Table 3). In general, the spatial fluctuations of Tkin do not exceed a few kelvin implying the uniform heating and the absence of the localized heat sources. The kinetic temperature tends to rise with the distance from the core center (points #7 in Table 2, #11 in Table 3, and #4 in Table 4), which is in line with the results of Tafalla et al. (2004).
The radial velocity profiles along the different diagonal cuts toward the selected targets are depicted in Figs. 3 and 4. The diagonal cut in L1498 between r = −80′′ and r = 40′′ (Fig. 3a) exhibits coherently changing velocities of Vlsr(HC3N) and Vlsr(NH3) (except the point r = 40′′ at the core edge) with a turn at r = 20′′. The velocity gradient is small, |∇Vlsr| ≈ 0.5 km s-1 pc-1. This picture coincides with the previously obtained results based on observations of CO, CS, N2H+, and NH3 in this core and was interpreted as an inward flow (Lee et al. 2001; Tafalla et al. 2004). Taken together, all available observation classify the L1498 cloud as one of the most quiet molecular cores. Thus, we can expect that the Doppler noise (irregular random shifts in the radial velocities between different transitions) is minimal in this core.
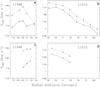 |
Fig. 3 The line-of-sight velocities of NH3 (J,K) = (1,1) (squares) and HC3N J = 2−1 (triangles) at different radial distances along the main diagonal cuts (panels a) and b)) and in the perpendicular directions (panels c) and d)) of the molecular cores L1498 and L1512 shown in Fig. 1. The reference point in panels a) and b) is (Δα,Δδ) = (0′′,0′′), but it is (20′′,0′′) in panel c) and (−10′′,20′′) in d). The radial distances of the points from the circular sector with the central angle 0o ≤ ψ < 180° are positive, whereas those from the sector 180° ≤ ψ < 360° are negative. The mean values of Vlsr are depicted for multiple observations at the same coordinate. The error bars show the 1σ uncertainties. |
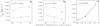 |
Fig. 4 The line-of-sight velocities of NH3 (J,K) = (1,1) (squares) and HC3N J = 2−1 (triangles) at different radial distances along the perpendicular diagonal cuts of the molecular core L1517BC (panels a) and b)), and along three points of L1400K (panel c)) shown in Fig. 1. The origin of coordinates is (Δα,Δδ) = (0′′,0′′) in each panel. The radial distances of the points from the circular sector with the central angle 0° ≤ ψ < 180° are positive, whereas those from the sector 180° ≤ ψ < 360° are negative. For multiple observations at the same coordinate the mean values of Vlsr are depicted. The error bars show the 1σ uncertainties. |
In the L1512 core, the Vlsr(NH3) and Vlsr(HC3N) distributions are almost parallel (Figs. 3b, d). The same kinematic picture was obtained for this core by Lee et al. (2001) from observations of CS and NH3 lines and interpreted as a simple rotation around the center. The velocity gradients derived from both the NH3 and HC3N lines are similar, ∇Vlsr ≈ 1.5 km s-1 pc-1, and consistent with the gradient based on N2H+ measurements by Caselli et al. (2002). This means that NH3, HC3N, and N2H+ trace the same gas, so the Doppler shifts ΔV between them should be insignificant.
In the core L1517BC, which is known to be very compact (Lee et al. 2001), we only observed a small central part 30′′ × 30′′ where the velocities of NH3 and HC3N along two perpendicular cuts (Fig. 4a, b) do not change much: ∇Vlsr(NH3) ≈ 0.3 km s-1 pc-1, ∇Vlsr(HC3N) ≈ 0.8 km s-1 pc-1 (panel a), and ∇Vlsr(NH3) ≈ ∇Vlsr(HC3N) ≈ −0.8 km s-1 pc-1 (panel b). However, a wider area (≈ 80′′ × 80′′) observation of this core revealed an outward gas motion at the core periphery with a higher velocity gradient, ∇Vlsr(N2H+) ≈ 1.1 km s-1 pc-1 (Tafalla et al. 2004), which is consistent with earlier results on NH3 observations by Goodman et al. (1993). This can lead to an additional shift in the radial velocity of HC3N line since, in general, the C-bearing molecules occupy a lower density gas (n ~ 103 cm-3) in the envelope of the molecular core. A higher nonthermal velocity dispersion of the HC3N line than for NH3 has already been mentioned above in regard to the temperature measurements in this core.
In the L1400K core, we only observed three positions. Both molecules trace the same gradient of ∇Vlsr ≈ 1.9 km s-1 pc-1, which is in line with ∇Vlsr(N2H+) = 1.8 ± 0.1 km s-1 pc-1 derived by Caselli et al. (2002). The mapping in different molecular lines by Tafalla et al. (2002) revealed that L1400K deviates significantly from spherical symmetry and exhibits quite a complex kinematic structure. In particular, distributions of N2H+ and NH3 do not coincide: N2H+ has an additional component to the west from the center. This explains why Crapsi et al. (2005) report a blue-ward skewness for this core, θ = −0.42 ± 0.10, of the N2H+ (1–0) hfs profiles, whereas in our observations the NH3 (1, 1) hfs transitions are fully symmetric: at the central position, the skewness of the resolved and single hfs component  of NH3 is θ = −0.1 ± 0.3.
The mean values of the velocity offsets ΔV between HC3N and NH3 measured across each of 4 cores are presented in Table 6. For each individual molecular core, we calculated the unweighted and weighted mean ΔV (weights inverse proportional to the variances) by averaging over available offsets for two datasets: based on only optically thin hfs transitions of NH3 (marked by index s) and on the all transitions including the strong main components of NH3 (marked by index a). We also used a robust redescending M-estimate (maximum-likelihood) for the mean and the normalized median absolute deviation (1.483·MAD) for the scale of the distribution as described in the appendix of Paper I. These statistics work well for inhomogeneous data sets with outliers and deviations from normality. The median values, which are robust estimates independent of the assumed distribution of data, are also presented to demonstrate the consistency of different calculations of the mean ΔV values.
Mean velocity offsets ΔV (in m s-1) between the HC3N (2–1) and NH3 (1, 1) lines, where the values in parentheses are the 1σ uncertainties.
We obtain very similar velocity shifts ⟨ ΔVa ⟩ = 25.8 ± 1.7 m s-1 and 28.0 ± 1.8 m s-1 (M-estimates) for, respectively, the cores L1498 and L1512 where the minimal level of the Doppler noise is expected. A higher shift ⟨ ΔVa ⟩ = 46.9 ± 3.3 m s-1 is observed in the L1517BC core – again in accord with the revealed kinematic structure of this core, which allows us to expect a higher radial velocity for the HC3N line. On the other hand, a lower value ⟨ ΔVa ⟩ = 8.5 ± 3.4 m s-1 in L1400K may come from irregular kinematic structure of the core center, which could increase the radial velocity of the NH3 line. Thus, as the reference velocity offset, we choose the most robust M-estimate of the mean value from the L1498 and L1512 cores: ⟨ ΔVa ⟩ = 26.9 ± 1.2stat m s-1. Taking into account that the uncertainty of the HC3N (2–1) rest frequency is about 3 m s-1, whereas that of NH3 (1, 1) is less than 1 m s-1, we finally have ⟨ ΔVa ⟩ = 26.9 ± 1.2stat ± 3.0sys m s-1. When it is interpreted in terms of the electron-to-proton mass ratio variation, as defined in Eq. (1), this velocity offset provides Δμ/μ = 26 ± 1stat ± 3sys ppb.
In Fig. 5, we compare the velocity offsets ΔV obtained in our observations with the 100-m Effelsberg telescope in Feb. 2009 and Jan. 2010. For L1498, L1512 and L1517BC, the reproducibility is very good, whereas the results differ significantly for L1400K. The reason for this discrepancy is unclear.
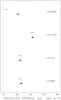 |
Fig. 5 Comparison of the relative radial velocities between the HC3N (2–1) and NH3 (1, 1) lines measured at the same coordinates in Feb. 2009 (filled circles) and in Jan. 2010 (open circles). The 2009 data are corrected by 4 m s-1 as described in Sect. 1. For L1517B the offset (Δα,Δδ)2010 = (15′′,15′′) corresponds to the offset (Δα,Δδ)2009 = (0′′,0′′). The mean value is depicted for multiple observations at the same coordinate. The error bars show the 1σ uncertainties. |
5. Discussion
5.1. Kinematic velocity shifts
In two molecular cores, L1498 and L1512, with lowest Doppler noise, we register very close values of the velocity offset ΔV ~ 27 m s-1 between the rotational transition HC3N (2–1) and inverse transition NH3 (1, 1), and these values coincide with the most accurate estimate obtained from the Effelsberg dataset on 12 molecular clouds in the Milky Way (Paper I). Two other cores, L1517B and L1400K, exhibit velocity shifts that are either higher (~47 m s-1 in L1517B) or lower (~9 m s-1 in L1400K) than the mean value, but the positive (L1517B) and negative (L1400K) deflections from the mean can be explained from the observed kinematics in these cores.
The rotational transition HC3N (2–1) was chosen for several reasons: its laboratory frequency is known with an accuracy of ~3 m s-1, it closely traces the NH3 (1, 1) emission, and its frequency of 18.2 GHz is close to 23.7 GHz of NH3 (1, 1) yielding the similar angular resolution for both species. However, it is well known that the C-bearing molecules freeze out in the central core parts, whereas the N-bearing molecules survive. Thus, if observing the NH3 and HC3N molecules, we cannot completely reject the possibility that the velocity shifts between them are of kinematic nature.
It is clear that the simultaneous observation of the NH3 (1, 1) inverse transition and rotational transitions of some N-bearing molecules, such as N2H+ (1–0) and N2D+ (1–0) would give a more stringent test. The main obstacle of this way is that the laboratory frequencies of N2H+ and N2D+ are known with accuracy not better than 14 m s-1 (Paper I, Sect. 4.2). Using the N2H+ rest frequency from the Cologne Database for Molecular Spectroscopy (CDMS; Müller et al. 2005) and observing with the Nobeyama 45-m telescope, we obtained a velocity shift between N2H+ and NH3 of 23.0 ± 3.4 m s-1 in L1498, 24.5 ± 4.3 m s-1 in L1512, and 21.0 ± 5.1 m s-1 in L1517B (Paper I). We note that similar shifts are indicated for the central parts of L1498 and L1517B in Fig. 11 from Tafalla et al. (2004), who observed these targets with the 30-m IRAM telescope and used the N2H+ rest frequency that is very close to the CDMS value.
In the prestellar core L183, Pagani et al. (2009) observed N2H+ (1–0) and N2D+ (1–0) and found that the two lines are systematically shifted with respect to NH3 (1, 1) along two perpendicular cuts. The velocity offset is about 28 m s-1, when adopting the CDMS catalog rest frequencies (Paper I; Molaro et al. 2009), but ΔV ≈ 40 m s-1 if the frequency of N2H+ is taken from Caselli et al. (1995).
Thus, almost the same velocity offset between the NH3 inversion transition and rotational lines from different molecular species (HC3N, N2H+, N2D+), different targets, and different telescopes is observed. Tentatively, this supports our initial hypothesis that the equivalence principle of local position invariance may break in low-density environment. Obviously, for more definite conclusions, new laboratory measurements of the rest frequencies and new observations involving other targets and other rotational transitions are required.
In this context we note that the matter density in diffuse interstellar clouds, where the UV lines of the molecular hydrogen H2 are observed, is about 5 orders of magnitude lower than in molecular cores. This implies that the expected value of Δμ/μ based on the H2 line position measurements should not be less than 3 × 10⁻⁸. This makes future experiments with CODEX and ESPRESSO spectrograph for extremely stable Doppler measurements (Pasquini et al. 2009) very important since current limits on Δμ/μ obtained with the UVES/VLT and HERES/Keck are at the level of a few ppm (e.g., Malec et al. 2010).
5.2. Frequency shifts caused by external fields
In this section we consider possible systematic effects caused by external fields. We start with a static electric field, then consider a thermal background radiation, and finally discuss a static magnetic field. We deduce all estimates for the inversion transition in ammonia. Rotational transitions can be treated in a similar way.
5.2.1. Stark effect induced by static electric fields
Static electromagnetic fields are always present and can affect the observed frequencies of microwave transitions in the laboratory and in astrophysical environments (see, e.g., Bethlem et al. 2008). The static Stark displacement of the inversion frequency in NH3 is given by Townes & Schawlow (1955) ![Mathematical equation: \begin{equation} \delta \omega_\mathrm{inv} =2\frac{\langle {\cal D}\rangle^2 {\cal F}^2}{\hbar^2 \omega_\mathrm{inv}} =2\left[\frac{M K}{J(J+1)}\right]^2 \frac{{\cal D}^2 {\cal F}^2}{\hbar^2 \omega_\mathrm{inv}}\cdot \label{stark1} \end{equation}](/articles/aa/full_html/2010/16/aa15332-10/aa15332-10-eq194.png) (10)Here ħ = h/2π is the reduced Planck constant,
(10)Here ħ = h/2π is the reduced Planck constant,  the electric dipole amplitude for the NH3 (1, 1) inversion transition,
  D the molecular dipole moment, ℱ the electric field strength, and J, M, and K are, respectively, the molecular angular momentum and its projections on the external electric field and on the molecular axis. Averaging over the projection of M, one finds5
 (11)where δVSt is the line-of-sight velocity offset caused by the Stark effect. The largest offset occurs for the K = J transitions. In this case the shift of δVSt = 1 m s-1 requires a field of ℱ ≈ 2 V cm-1. For laboratory conditions, this is a large enough field to be easily controlled. For dense interstellar molecular clouds, such a field would accelerate electrons to ultrarelativistic energies (~1010 eV) within their mean free path (ℓe ~ 5 × 10¹⁴/nH2 cm). Thus, we conclude that static electric fields cannot cause any systematic effects on this scale.
The collision shift when molecules get close to each other and the NH3 (1, 1) inversion line is shifted because the electric dipole-induced interactions between collision partners is also less than 1 m s-1 for the physical conditions realized in the most accurate laboratory studies with molecular fountains and in cold interstellar molecular cores (Bethlem et al. 2008).
5.2.2. Stark effect induced by black body radiation
Now we estimate the frequency shift due to the black body radiation (BBR) at any given radiation temperature T. According to Farley & Wing (1981), the BBR-induced Stark shift is given by  (12)where k is the Boltzmann constant, and c the speed of light. In Eq. (12), we consider that the levels of the inversion doublet are shifted from each other and sum over Cartesian components of the BBR field. The universal function φ has the form
  (13)and is restricted to the interval −2 < φ < 3. At the radiation temperature T≳3 K, we are interested in the limit y ≡ (ħωinv/kT) ≪ 1, where
  (14)By using this expression and averaging again over the projection of M, we obtain
  (15)We see that the BBR shift grows with temperature, and it is higher for a warm laboratory environment than with the interstellar 3 K background field. However, even for T ~ 300 K, the BBR shift for the inversion transition is negligible, δωinv/ωinv ~ 1.5 × 10⁻¹³. The BBR shift for the J = 2−1 rotational transition of the HC3N molecule is the same order of magnitude.
5.2.3. Zeeman effect induced by static magnetic fields
Finally, we estimate the effect of a static magnetic field. Dense molecular cores have weak magnetic fields with typical strengths of B ~ 10 μG or less (Crutcher et al. 2010). For example, CCS Zeeman observations of L1498 set an upper limit on B = 48 ± 31 μG for the line-of-sight component of the magnetic field (Levin et al. 2001). The line shapes can be sensitive to random motions at the Alfvén velocity associated with the magnetic field B,  . (Here B is the strength in G of the line-of-sight component of the magnetic vector, ρ the ion density in g cm-3, and vA in cm s-1). The presence of the magnetic field can be felt by the neutral material through collisions with charged particles. If we assume that in our observations the nonthermal line widths stem from Alfvénic turbulent motions whose kinetic energy is equal to the static magnetic field energy, so that
  , then an order-of-magnitude estimate of the magnetic field strength at nH2 ~ 105 cm-3 and vturb < 90 m s-1 (see Sect. 3) provides an upper limit on B < 20 μG. Since in this estimate we substitute the ion density by the total gas density, the strength of the static magnetic field in the interiors of L1498, L1512, L1517B, and L1400K should be considerably lower than this upper limit. This is more than five orders of magnitude less than the unscreened Earth’s magnetic field, which is about half a Gauss at the surface of the Earth. Typical laboratory magnetic shields reduce the Earth’s field by 2–3 orders of magnitude to an mG level.
The order-of-magnitude estimate of the Zeeman splitting for NH3, where magnetic interaction is dominated by 3 protons since the nitrogen g-factor is small (≈ 0.4), can be obtained as follows. For a single proton, we have  (16)where μn is the nuclear magneton, gp = 5.6 the proton g-factor, Iz the proton spin, and B is the strength of the magnetic field. Roughly, the maximum shift is realized when all three proton spins are aligned (ortho-NH3), so we can use the above equation and put Iz = Iz,1 + Iz,2 + Iz,3 = 3/2. With μn = 5.05 × 10⁻²⁴ erg G-1 and B = 10-3 G, we obtain δωinv ≈ 6 Hz. Since the (J,K) = (1,1) line belongs to the para-species of the ammonia molecule, where the proton spins are not aligned, the expected frequency shift is even lower for the transition observed by us.
One should also keep in mind that the Zeeman shifts turn to zero after averaging over magnetic quantum number M. Therefore, in the first approximation, magnetic fields induce a line broadening, but not a frequency shift. Thus, the systematic shift of the ammonia inversion transition of about ~2 kHz detected in the starless molecular cores cannot be explained by a static magnetic field effect.
We conclude that static fields and thermal background radiation produce systematic velocity shifts much less than 1 m s-1. Thus, field effects do not contribute significantly to the systematic error of our observations.
6. Conclusions
The present paper continues our studies where we use the ammonia inversion transition in conjunction with low-lying rotational transitions of other molecules to probe the dependence of the electron-to-proton mass ratio μ on the ambient matter density. As experimental tests, we suggest observing dense prestellar molecular cores located in the disk of the Milky Way. Here we report on mapping of four molecular cores (L1498, L1512, L1517B, and L1400K) in two molecular transitions of NH3 (J,K) = (1,1) and HC3N J = 2−1 with high-spectral resolution at the 100-m Effelsberg telescope. The main results are as follows:
-
1.
The completely resolved hfs components of theNH3 (1, 1) and HC3N (2–1)transitions allowed us to determine the line centers with aprecision of ~1 m s-1, which is comparable to laboratory uncertainties for the rest frequencies of these transitions.
-
2.
In the two cores with lowest Doppler noise, L1498 and L1512, we obtained a statistically significant positive velocity offset between the rotational HC3N and inversion NH3 transitions of 26.9 ± 1.2stat ± 3.0sys m s-1. In two other cores, L1517B and L1400K, the velocity offsets are, respectively, higher and lower, but these deflections can be explained by the observed kinematic structure in L1517B and L1400K. When we assumed that the measured velocity offset is caused by the electron-to-proton mass ratio variation, then Δμ/μ = 26 ± 1stat ± 3sys ppb. The nonzero Δμ implies that at deep interstellar vacuum the electron-to-proton mass ratio increases by ~3 × 10⁻⁸ as compared with its terrestrial value.
-
3.
The reproducibility of the velocity offset at the same facility (Effelsberg telescope) on a year-to-year base is very good, except for the L1400K target where the central point is probably an outlier.
-
4.
We have shown that the effects of static electric and magnetic fields and the BBR-induced Stark shifts are not more than 1 m s-1, and they can be neglected in the total error budget.
-
5.
The results obtained tentatively support the hypothesis that the equivalence principle may break in a low-density environment. This may be the consequence of the chameleon-like scalar field. New laboratory measurements of the rest frequencies and new observations involving other rotational transitions and other targets (e.g., Levshakov et al. 2010b) are required to reach more definite conclusions.
Online material
Online material
Molecular core L1498.
Hereafter, 1 ppm = 10-6, and 1 ppb = 10-9.
At 18 GHz we used only one channel Rx2 since Rx1 was not operating during our observations.
The projection of M ranges between − J and J. Assuming equal population of these levels (all of them have the same energy), we have 
Acknowledgments
We are grateful to the staff of the Effelsberg radio observatory for assistance in our observations and to Drs. Peter Müller, Jürgen Neidhöfer, and Johann Schramml for explaining the technical details for the 100-m telescope instrumentation. The project has been supported in part by DFG Sonderforschungsbereich SFB 676 Teilprojekt C4, the RFBR grants No. 09-02-12223, 09-02-00352, and 08-02-92001, the Federal Agency for Science and Innovations grant NSh-3769.2010.2, the Program IV.12/2.5 of the Physical Department of the RAS, and by the Chinese Academy of Sciences visiting professorship for senior international scientists grant No. 2009J2-6.
References
- Aitken, A. C. 1934, Proc. R. Soc. Edinburg A, 55, 42 [Google Scholar]
- Avelino, P. P. 2008, Phys. Rev. D, 78, 3516 [NASA ADS] [Google Scholar]
- Benson, P. J., & Myers, P. C. 1989, ApJS, 71, 89 [NASA ADS] [CrossRef] [Google Scholar]
- Bethlem, H. L., Kajita, M., Satakov, B., Meijer, G., & Ubachs, W. 2008, Eur. Phys. J. Special Topics 163, 55 [NASA ADS] [CrossRef] [EDP Sciences] [Google Scholar]
- Brax, P. 2009 [arXiv:0912.3610] [Google Scholar]
- Brax, P., & Zioutas, K. 2010 Phys. Rev. D, 82, 043007 [Google Scholar]
- Brax, P., van de Bruck, C., Davis, A.-C., Khoury, J., & Weltman, A. 2004, Phys. Rev. D, 70, 123518 [NASA ADS] [CrossRef] [MathSciNet] [Google Scholar]
- Burrage, C., Davis, A.-C., & Shaw, D. J. 2009, Phys. Rev. D, 79, 044028 [NASA ADS] [CrossRef] [Google Scholar]
- Caldwell, R. R., Dave, R., & Steinhardt, P. J. 1998, Phys. Rev. Lett., 80, 1582 [Google Scholar]
- Caselli, P., Meyers, P. S., & Thaddeus, P. 1995, ApJ, 455, L77 [NASA ADS] [CrossRef] [Google Scholar]
- Caselli, P., Benson, P. J., Myers, P. C., & Tafalla, M. 2002, ApJ, 572, 238 [NASA ADS] [CrossRef] [Google Scholar]
- Chin, C., Flambaum, V. V., & Kozlov, M. G. 2009, NJPh, 11, 055048 [NASA ADS] [Google Scholar]
- Crapsi, A., Caselli, P., Walmsley, C. M., et al. 2005, ApJ, 619, 379 [Google Scholar]
- Crutcher, R. M., Hakobian, N., & Troland, T. H. 2010, MNRAS, 402, L64 [NASA ADS] [Google Scholar]
- Davis, A.-C., Schelpe, C. A. O., & Shaw, D. J. 2009, Phys. Rev. D, 80, 064016 [NASA ADS] [CrossRef] [Google Scholar]
- Dent, T. 2008, EPJST, 163, 297 [Google Scholar]
- Di Francesco, J., Evans, N. J., II, Caselli, P., et al. 2007, in Protostars and Planets V., ed. B. Reipurth, D. Jewitt, & K. Keil (Tucson: Uni. Arizona Press), 17 [Google Scholar]
- Farley, J. W., & Wing, W. H. 1981, Phys. Rev. A, 23, 2397 [NASA ADS] [CrossRef] [Google Scholar]
- Flambaum, V. V., & Kozlov, M. G. 2007, Phys. Rev. Lett., 98, 240801 [FK] [NASA ADS] [CrossRef] [PubMed] [Google Scholar]
- Fuller, G. A., & Myers, P. C. 1993, ApJ, 418, 273 [NASA ADS] [CrossRef] [Google Scholar]
- Goldsmith, P. F. 2001, ApJ, 557, 736 [NASA ADS] [CrossRef] [MathSciNet] [Google Scholar]
- Goldsmith, P. F., & Langer, W. D. 1978, ApJ, 222, 881 [NASA ADS] [CrossRef] [Google Scholar]
- Goodman, A. A., Benson, P. J., Fuller, G. A., & Myers, P. C. 1993, ApJ, 406, 528 [NASA ADS] [CrossRef] [Google Scholar]
- Henkel, C., Jethava, N., Kraus, A., et al. 2005, A&A 440, 893 [NASA ADS] [CrossRef] [EDP Sciences] [Google Scholar]
- Henkel, C., Braatz, J. A., Menten, K. M., & Ott, J. 2008, A&A, 485, 451 [NASA ADS] [CrossRef] [EDP Sciences] [Google Scholar]
- Henkel, C., Menten, K. M., Murphy, M. T., et al. 2009, A&A, 500, 725 [NASA ADS] [CrossRef] [EDP Sciences] [Google Scholar]
- Jijina, J., Hyers, P. C., & Adams, F. C. 1999, ApJS, 125, 161 [NASA ADS] [CrossRef] [Google Scholar]
- Khoury, J., & Weltman, A. 2004a, Phys. Rev. Lett., 93, 171104 [NASA ADS] [CrossRef] [PubMed] [Google Scholar]
- Khoury, J., & Weltman, A. 2004b, Phys. Rev. D 69, 044026 [Google Scholar]
- Klein, B., Philipp, S. D., Güsten, R., Krämer, I., & Samtleben, D. 2006, Proc. SPIE, 6275, 627511 [CrossRef] [Google Scholar]
- Kozlov, M. G., Lapinov, A. V., & Levshakov, S. A. 2010, J. Phys. B: At. Mol. Opt. Phys., 43, 074003 [NASA ADS] [CrossRef] [Google Scholar]
- Kukolich, S. G. 1967, Phys. Rev., 156, 83 [NASA ADS] [CrossRef] [Google Scholar]
- Lee, C. W., Myers, P. C., & Tafalla, M. 2001, ApJS, 136, 703 [NASA ADS] [CrossRef] [Google Scholar]
- Lee, J.-E., Evans, N. J., II,Shirley, Y. L., & Tatematsu, K. 2003, ApJ, 583, 789 [NASA ADS] [CrossRef] [Google Scholar]
- Levin, S. M., Langer, W. D., Velusamy, T., Kuiper, T. B. H., & Crutcher, R. M. 2001, ApJ, 555, 850 [NASA ADS] [CrossRef] [Google Scholar]
- Levshakov, S. A., Kegel, W. H., & Mazets, I. E. 1997, MNRAS, 288, 802 [NASA ADS] [CrossRef] [Google Scholar]
- Levshakov, S. A., Dessauges-Zavadsky, M., D’Odorico, S., & Molaro, P. 2002, ApJ, 565, 696 [NASA ADS] [CrossRef] [Google Scholar]
- Levshakov, S. A., Molaro, P., & Kozlov, M. G. 2008 [arXiv:0808.0583] [Google Scholar]
- Levshakov, S. A., Molaro, P., Lapinov, A. V., et al. 2010a, A&A, 512, 44 [Paper I] [Google Scholar]
- Levshakov, S. A., Molaro, P., & Reimers, D. 2010b, A&A, 516, 113 [Google Scholar]
- Malec, A. L., Buning, R., Murphy, M. T., et al. 2010, MNRAS, 403, 1541 [NASA ADS] [CrossRef] [Google Scholar]
- Menten, K. M., R. Güsten, Leurini, S., et al. 2008, A&A 492, 725 [NASA ADS] [CrossRef] [EDP Sciences] [Google Scholar]
- Molaro, P., Levshakov, S. A., & Kozlov, M. G. 2009, Nucl. Phys. Proc. Suppl., 194, 287 [NASA ADS] [CrossRef] [Google Scholar]
- Murphy, M. T., Flambaum, V. V., Muller, S., & Henkel, C. 2008, Science, 320, 1611 [NASA ADS] [CrossRef] [PubMed] [Google Scholar]
- Müller, H. S. P., Schlöder, F., Stutzki, J., & Winnewisser, G. 2005, J. Mol. Struct., 742, 215 [NASA ADS] [CrossRef] [Google Scholar]
- Olive, K. A., & Pospelov, M. 2008, Phys. Rev. D, 77, 043524 [NASA ADS] [CrossRef] [Google Scholar]
- Pagani, L., Daniel, F., & Dubernet, M.-L. 2009, A&A, 494, 719 [NASA ADS] [CrossRef] [EDP Sciences] [Google Scholar]
- Pasquini, L., Manescau, A., Avila, G., et al., 2009, Science with the VLT in the ELT Era, Astrophys. Space Sci. Proceed. (The Netherlands: Springer), 395 [Google Scholar]
- Peebles, P. J. E., & Ratra, B. 2003, Rev. Mod. Phys., 75, 559 [NASA ADS] [CrossRef] [MathSciNet] [Google Scholar]
- Perlmutter, S., Aldering, G., della Valle, M., et al. 1998, Nature, 391, 51 [CrossRef] [Google Scholar]
- Riess, A. G., Filippenko, A. V., Challis, P., et al. 1998, AJ, 116, 1009 [NASA ADS] [CrossRef] [Google Scholar]
- Ronningen, T. J., & De Lucia, F. C. 2005, JChPh, 122, 184319 [NASA ADS] [Google Scholar]
- Ross, K. A., & Willey, D. R. 2005, JChPh, 122, 204308 [NASA ADS] [Google Scholar]
- Tafalla, M., Myers, P. C., Caselli, P., Walmsley, C. M., & Comito, C. 2002, ApJ, 569, 815 [NASA ADS] [CrossRef] [Google Scholar]
- Tafalla, M., Myers, P. C., Caselli, P., & Walmsley, C. M. 2004, A&A, 416, 191 [NASA ADS] [CrossRef] [EDP Sciences] [Google Scholar]
- Tafalla, M., Santiago, J., Myers, P. C., et al. 2006, A&A, 455, 577 [NASA ADS] [CrossRef] [EDP Sciences] [Google Scholar]
- Townes, C., & Schawlow, A. 1955, Microwave Spectroscopy (New York: McGraw-Hill) [Google Scholar]
- Shu, F. H. 1977, ApJ, 214, 488 [NASA ADS] [CrossRef] [Google Scholar]
- Upadhye, A., Steffen, J. H., & Weltman, A. 2010, Phys. Rev. D, 81, 015013 [NASA ADS] [CrossRef] [Google Scholar]
- van Veldhoven, J., Küpper, J., Bethlem, H. L., et al. 2004, Eur. Phys. J. D, 31, 337 [NASA ADS] [CrossRef] [EDP Sciences] [Google Scholar]
- Willey, D. R., Timlin, R. E., Jr., et al. 2002, ApJS, 139, 191 [NASA ADS] [CrossRef] [Google Scholar]
All Tables
Mean velocity offsets ΔV (in m s-1) between the HC3N (2–1) and NH3 (1, 1) lines, where the values in parentheses are the 1σ uncertainties.
All Figures
|
Fig. 1 Maps of L1498, L1512, L1517BC, and L1400K showing positions where the radial velocity differences, ΔV, between the HC3N (2–1) 18.196 GHz line and the NH3 (1, 1) 23.694 GHz line have been measured at the Effelsberg 100-m radio telescope. On each panel the numbers are the mean velocity shifts ΔV (in m s-1) between the corresponding ΔVs and ΔVa values listed in Tables 2–5. The circles show the half-power beam width at 23 GHz, whereas the linear scale is indicated by the horizontal bars. Reference positions are given in Table 1. |
| In the text | |
|
Fig. 2 Spectra of NH3 (1, 1) and HC3N (2−1) lines toward the molecular core L1498 obtained at the Effelsberg 100-m radio telescope. The offset (Δα,Δδ) = (0′′,0′′). The histograms show the data averaged over two spectral channels. The fits are shown with solid curves. The vertical tick-marks indicate the positions and the relative strengths of the hyperfine structure components for local thermodynamical equilibrium and optically thin emission. The residual spectra are plotted below each profile. The fitting parameters are presented in Table 2. |
| In the text | |
|
Fig. 3 The line-of-sight velocities of NH3 (J,K) = (1,1) (squares) and HC3N J = 2−1 (triangles) at different radial distances along the main diagonal cuts (panels a) and b)) and in the perpendicular directions (panels c) and d)) of the molecular cores L1498 and L1512 shown in Fig. 1. The reference point in panels a) and b) is (Δα,Δδ) = (0′′,0′′), but it is (20′′,0′′) in panel c) and (−10′′,20′′) in d). The radial distances of the points from the circular sector with the central angle 0o ≤ ψ < 180° are positive, whereas those from the sector 180° ≤ ψ < 360° are negative. The mean values of Vlsr are depicted for multiple observations at the same coordinate. The error bars show the 1σ uncertainties. |
| In the text | |
|
Fig. 4 The line-of-sight velocities of NH3 (J,K) = (1,1) (squares) and HC3N J = 2−1 (triangles) at different radial distances along the perpendicular diagonal cuts of the molecular core L1517BC (panels a) and b)), and along three points of L1400K (panel c)) shown in Fig. 1. The origin of coordinates is (Δα,Δδ) = (0′′,0′′) in each panel. The radial distances of the points from the circular sector with the central angle 0° ≤ ψ < 180° are positive, whereas those from the sector 180° ≤ ψ < 360° are negative. For multiple observations at the same coordinate the mean values of Vlsr are depicted. The error bars show the 1σ uncertainties. |
| In the text | |
|
Fig. 5 Comparison of the relative radial velocities between the HC3N (2–1) and NH3 (1, 1) lines measured at the same coordinates in Feb. 2009 (filled circles) and in Jan. 2010 (open circles). The 2009 data are corrected by 4 m s-1 as described in Sect. 1. For L1517B the offset (Δα,Δδ)2010 = (15′′,15′′) corresponds to the offset (Δα,Δδ)2009 = (0′′,0′′). The mean value is depicted for multiple observations at the same coordinate. The error bars show the 1σ uncertainties. |
| In the text | |
Current usage metrics show cumulative count of Article Views (full-text article views including HTML views, PDF and ePub downloads, according to the available data) and Abstracts Views on Vision4Press platform.
Data correspond to usage on the plateform after 2015. The current usage metrics is available 48-96 hours after online publication and is updated daily on week days.
Initial download of the metrics may take a while.