Fig. 1
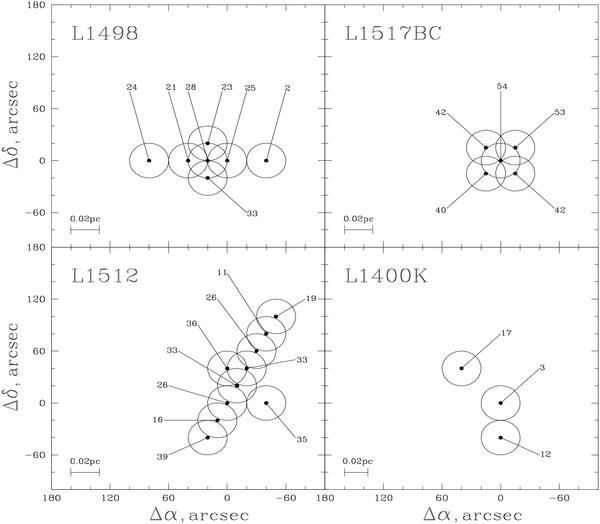
Maps of L1498, L1512, L1517BC, and L1400K showing positions where the radial velocity differences, ΔV, between the HC3N (2–1) 18.196 GHz line and the NH3 (1, 1) 23.694 GHz line have been measured at the Effelsberg 100-m radio telescope. On each panel the numbers are the mean velocity shifts ΔV (in m s-1) between the corresponding ΔVs and ΔVa values listed in Tables 2–5. The circles show the half-power beam width at 23 GHz, whereas the linear scale is indicated by the horizontal bars. Reference positions are given in Table 1.
Current usage metrics show cumulative count of Article Views (full-text article views including HTML views, PDF and ePub downloads, according to the available data) and Abstracts Views on Vision4Press platform.
Data correspond to usage on the plateform after 2015. The current usage metrics is available 48-96 hours after online publication and is updated daily on week days.
Initial download of the metrics may take a while.