| Issue |
A&A
Volume 524, December 2010
|
|
|---|---|---|
| Article Number | A64 | |
| Number of page(s) | 37 | |
| Section | Catalogs and data | |
| DOI | https://doi.org/10.1051/0004-6361/201015249 | |
| Published online | 24 November 2010 | |
The Palermo Swift-BAT hard X-ray catalogue
III. Results after 54 months of sky survey⋆
1
INAF, Istituto di Astrofisica Spaziale e Fisica Cosmica di Palermo, via U.
La Malfa 153,
90146
Palermo,
Italy
e-mail: cusumano@ifc.inaf.it
2
Institut für Astronomie und Astrophysik Tübingen (IAAT),
72076
Tübingen,
Germany
3
ISDC Data Centre for Astrophysics, Chemin d’Écogia 16,
1290
Versoix,
Switzerland
4
Università degli studi di Milano-Bicocca, Dipartimento di
Fisica, Piazza delle Scienze
3, 20126
Milan,
Italy
5
INAF – Osservatorio Astronomico di Brera, via Bianchi 46,
23807
Merate,
Italy
6
ASI Science Data Center, via Galileo Galilei,
00044
Frascati,
Italy
7
INAF, Istituto di Astrofisica Spaziale e Fisica Cosmica di
Bologna, via Gobetti 101, 40129
Bologna,
Italy
8
Dipartimento di Astronomia, Università di Bologna,
via Ranzani 1, 40127
Bologna,
Italy
Received: 21 June 2010
Accepted: 26 August 2010
Aims. We present the Second Palermo Swift-BAT hard X-ray catalogue obtained by analysing data acquired in the first 54 months of the Swift mission.
Methods. Using our software dedicated to the analysis of data from coded mask telescopes, we analysed the BAT survey data in three energy bands (15–30 keV, 15–70 keV, 15–150 keV), obtaining a list of 1256 detections above a significance threshold of 4.8 standard deviations. The identification of the source counterparts is pursued using two strategies: the analysis of field observations of soft X-ray instruments and cross-correlation of our catalogue with source databases.
Results. The survey covers 50% of the sky to a 15–150 keV flux limit of 1.0 × 10⁻¹¹ erg cm-2 s-1 and 9.2 × 10⁻¹² erg cm-2 s-1 for |b| < 10° and |b| > 10°, respectively. The Second Palermo Swift-BAT hard X-ray catalogue includes 1079 (~86%) hard X-ray sources with an associated counterpart (26 with a double association and 2 with a triple association) and 177 BAT excesses (~14%) that still lack a counterpart. The distribution of the BAT sources among the different object classes consists of ~19% Galactic sources, ~57% extragalactic sources, and ~10% sources with a counterpart at softer energies whose nature has not yet been determined. About half of the BAT associated sources lack a counterpart in the ROSAT catalogues. This suggests that either moderate or strong absorption may be preventing their detection in the ROSAT energy band. The comparison of our BAT catalogue with the Fermi Large Area Telescope First Source Catalogue identifies 59 BAT/Fermi correspondences: 48 blazars, 3 Seyfert galaxies, 1 interacting galaxy, 3 high mass X-ray binaries, and 4 pulsars/supernova remnants. This small number of correspondences indicates that different populations make the sky shine in these two different energy bands.
Key words: catalogs / surveys / X-rays: general
Catalogue is also available in electronic firm at the CDS via anonymous ftp to cdsarc.u-strasbg.fr (130.79.128.5) or via http://cdsarc.u-strasbg.fr/viz-bin/qcat?J/A+A/524/A64
© ESO, 2010
1. Introduction
The Burst Alert Telescope (BAT, Barthelmy et al. 2005) onboard the Swift observatory (Gehrels et al. 2004) is a coded-aperture imaging camera operating in the 15–150 keV energy range with a large field of view (1.4 steradian half coded) and a point spread function (PSF) of 17 arcmin (full width half maximum). The telescope is mainly devoted to the monitoring of a large fraction of the sky for the occurrence of gamma ray bursts (GRBs). While waiting for new GRBs, BAT continuously collects spectral and imaging information about the sky, covering a fraction of between 50% and 80% of the sky every day, providing the opportunity for a substantial gain in our knowledge of the Galactic and extragalactic sky in the hard X-ray domain and increasing the sample of objects that contribute to the luminosity in this energy range. The first results of the BAT survey were presented in Markwardt et al. (2005), Ajello et al. (2008a), Ajello et al. (2008b), Tueller et al. (2008), Tueller et al. (2010), Cusumano et al. (2010), and Maselli et al. (2010). The First Palermo Swift-BAT hard X-ray catalogue (Cusumano et al. 2010) contains a list of 754 hard X-ray sources with an associated counterpart detected in the first 39 months of the Swift mission. Among them, ~69% are extragalactic, ~27% are Galactic objects, ~4% are already known X-ray or γ-ray emitters whose nature has not yet been determined.
In this paper, we provide the Second Palermo Swift-BAT hard X-ray catalogue obtained from the analysis of the data relative to the first 54 months of the Swift mission and including 1256 BAT high-energy sources. The paper is organised as follows: in Sect. 2, we describe the screening and the analysis of the BAT survey data and the global survey properties; in Sect. 3, we illustrate our analysis strategy; in Sect. 4, we describe the counterpart association strategy; the 54-month catalogue and its properties are described in Sects. 5 and 6. Then, in Sect. 7 we summarise our results.
The cosmology adopted in this work assumes H0 = 70 km s-1 Mpc-1, k = 0, Ωm = 0.3, and Λ0 = 0.7. Quoted errors are at 1σ confidence level, unless otherwise specified.
2. The BAT survey data
The results presented in this paper were obtained by analising the first 54 months of BAT survey data, from 2004 December to the end of 2009 May. The data were retrieved from the Swift public archive1 in the form of detector plane histograms (DPH): three-dimensional arrays (two spatial dimensions, one spectral dimension) that collect count-rate data in 5-min time bins for 80 energy channels.
To process the survey data, we developed and applied a code that performs screening, mosaicking, and source detection on data from coded mask instruments. This code is described in detail in Segreto et al. (2010). To screen out poor quality files from the data set, we rejected the DPHs:
-
with unstable spacecraft attitude (i.e., with a significantvariation in pointing coordinates);
-
produced near the SAA and characterized by a count rate much higher than the average value;
-
affected by inaccurate position reconstruction; this was verified through a pre-analysis procedure where the position of the sources detected in single DPHs was checked against a list of hard X-ray sources and transients (see Cusumano et al. 2010, for details);
-
that were very noisy, i.e., with a standard deviation in the count rate (subtracted of both bright sources and background) significantly larger (a factor of 2) than that expected from statistics.
After the screening based on these criteria, the usable archive has a total nominal exposure time of ~100 Ms, corresponding to ~92% of the total survey exposure time during the period under investigation.
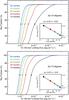 |
Fig. 1 Fraction of the sky (top: |b| < 10°, bottom: |b| > 10°) covered by the BAT survey as a function of the 15–150 keV detection limiting flux for a detection threshold of 4.8 standard deviations. Different colours refer to different survey epochs. The insets show the limiting flux achieved for 50% of the sky as a function of time; the best fit is a power law consistent with t-0.5. |
Figure 1 shows the sky coverage, defined as the fraction of the sky covered by the survey as a function of the 15–150 keV detection limiting flux, at different survey epochs starting from the beginning of the mission. The limiting flux of a given sky direction is calculated by multiplying the local image noise by a detection threshold of 4.8 standard deviations. We derived the sky fraction for two sky regions (top panel: |b| < 10°, bottom panel: |b| > 10°). The 54-month BAT survey covers 50% of the sky to a flux limit of 1.0 × 10⁻¹¹ erg cm-2 s-1 and 9.2 × 10⁻¹² erg cm-2 s-1 for |b| < 10° and |b| > 10°, respectively. The insets in Fig. 1 show the limiting flux achieved for 50% of the sky as a function of the cumulative observing time of the screened BAT survey data; the data are modelled well with a power law (N × tα, where N = (7.5 ± 0.3) × 10-11 erg cm-2 s-1 and α = −0.49 ± 0.02 for |b| < 10° and N = (6.4 ± 0.2) × 10-11 erg cm-2 s-1 and α = −0.49 ± 0.01 for |b| > 10°), both being consistent with the t-0.5 behaviour expected if the statistical errors dominate over the systematic ones.
The minimum detection limiting flux is not fully uniform on the sky. Figure 2 shows the limiting flux map in Galactic Aitoff projection, with the ecliptic coordinates grid superimposed. The Galactic centre and the ecliptic plane are characterized by a poorer sensitivity because of high contamination from intense Galactic sources and to the observing constraints on the Swift spacecraft. The highest flux sensitivity is achieved close to the ecliptic poles, where a detection flux limit of ~6.2 × 10⁻¹² erg cm-2 s-1 is reached; the lowest flux sensitivity is in the region of the Galactic centre with a detection flux limit of ~3 × 10-11 erg cm-2 s-1.
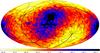 |
Fig. 2 Map of the limiting flux of the 54-month BAT survey in the 15–150 keV band, projected in Galactic Aitoff coordinates, with the ecliptic coordinates grid superimposed. The colour bar shows the scale in erg cm-2 s-1. |
We produced all-sky maps in three energy bands (15–30 keV, 15–70 keV and 15–150 keV) using the HEALPIX-based all-sky spherical grid projection (Górski et al. 2005) with a pixel size of ≈2.5 arcmin radius.
For each of these energy ranges, we derived a signal-to-noise ratio (S/N) map as the ratio of the mosaic intensity to the associated statistical error. Figure 3 shows the distribution of the significance in the 15–150 keV energy range. This distribution is well described by a Gaussian curve with zero mean and unitary variance, except for the positive tail caused by hard X-ray emitters. The same result was also obtained for the significance maps in the other two energy ranges.
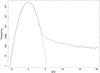 |
Fig. 3 Distribution of pixel significance in the BAT all-sky map. The continuous curve is the result of a Gaussian fit obtained by excluding the distribution tail. The best-fit model parameters are consistent with a mean and standard deviation of 0.0 and 1.0, respectively. |
3. Detection strategy
The source detection was performed by searching for local excesses in the S/N maps, then refining their position and peak significance using a local bidimensional fit. Detections with peak significance greater than 4.8 standard deviations were included in our list of detected sources.
Adopting this threshold, we expected ~15 spurious detections on each all-sky map: this number was evaluated by applying the detection algorithm to several all-sky maps obtained from simulated empty field observations. Therefore, the total number of spurious detections was between 15 and 45 (~1% to ~3% of the total number of our detections, see below), the best case occurring if each noise fluctuation above the threshold appeared simultaneously in all the three bands, the worst case occurring if each fluctuation appeared only in one energy band.
The final catalogue is built by cross-correlating and merging the detection catalogues obtained in the three energy bands: source candidates detected in the sky maps of different energy bands were merged and reported in the final catalogue as a single source candidate if their positions were consistent within the relevant error box (95% containment radius, Segreto et al. 2010).
We obtained a list of 1256 source candidates detected in at least one of the three energy bands: 806 sources were detected in all the three energy bands, 230 in two energy bands, and 220 in only one of the three energy bands (74, 59, and 87 in the 15–150 keV, 15–30 keV, and 15–70 keV map, respectively). We assume the most accurate source coordinates to be those obtained in the sky map with the highest detection significance.
4. Association strategy
To find the most likely counterpart to the detected BAT hard X-ray excesses, we applied two different strategies: an analysis of archival soft X-ray observations (strategy A) and a cross-correlation with a list of possible counterparts (strategy B).
4.1. Strategy A
We analysed all the available soft X-ray archival observations whose field of view covers the position of the BAT source candidates. We first considered the huge set of Swift-XRT observations, many of which were performed for this purpose. A total of 751 sky positions of the BAT source candidates were covered by XRT observations. We applied a blind detection algorithm to the XRT images using ximage v4.0. We assumed that an XRT source was the counterpart of a BAT detection if its position was within a 6 arcmin radius error circle (99.7% confidence level for a source detection at 4.8 standard deviations, Segreto et al. 2010) and its rate was higher than 8 × 10⁻³ count s-1 in the 0.2–10 keV energy range or higher than 8 × 10⁻⁴ count s-1 in the 3–10 keV energy range (criterion 1). These two thresholds were derived by assuming that a source is detected at about the survey limiting flux (~10-11 erg cm-2 s-1, see Fig. 1) and extrapolating the XRT count rate to a power-law spectral energy distribution of photon index 1 < Γ < 3 and an absorbing column 1020 cm-2 < Nh < 1024 cm-2 and allow us to associate either faint or very absorbed sources with the BAT detection. We found that 595 BAT excesses could be associated with a single XRT source, while 60 BAT excesses could be associated with more than one XRT source (42 with a double association and 18 with a triple association). In the latter cases, we associate to the BAT excess the XRT source with either a 0.2–10 keV or 3–10 keV count rate at least a factor of 5 brighter than the other candidates in the field (criterion 2). This criterion leaves only 8 BAT excesses with a double XRT association, which are reported in the catalogue. The number of XRT counterpart candidates rejected after applying this criterion is 42 + 18 × 2 − 8 = 70. For 96 of the BAT source candidates covered by an XRT observation, we were unable to detect any soft X-ray counterpart.
To evaluate the number of expected spurious associations, we collected a large sample (365) of XRT observations of GRB fields, using only late follow-ups (where the GRB afterglow had faded) with a similar exposure time distribution as the XRT pointings of the BAT sources. We searched for sources within a 6.0 arcmin error circle centred on the nominal pointing position in each of these fields (excluding any GRB residual afterglow) and satisfying criterion 1. We detected 33 sources that, normalized to the number of XRT follow-ups (33 × 751/365 ≃ 68), is consistent with the number (70) of XRT sources that survived criterion 1 but were rejected by criterion 2. Therefore, the number of expected spurious associations can be assumed to be negligible.
For the BAT positions not covered by XRT observations, we searched for pointed archival observations with other X-ray instruments, in the following order: Beppo-SAX, ASCA, Newton-XMM, Chandra, ROSAT. We did not use ROSAT observations performed during the ROSAT All Sky Survey campaign: the list of sources extracted from this campaign (Voges et al. 1999) was used in strategy B (see Sect. 4.2). A threshold criterion analogous to that applied to the Swift-XRT observations was used to select the most reliable association. The rate thresholds for criterion 1 for each instrument were derived by converting the Swift-XRT count rate threshold to the relevant equivalent count rate assuming a power law with a photon index Γ = 2 and an absorbing column of 1021 cm-2. For ROSAT, only a 0.2–2.4 keV rate threshold was applied. A total of 288 of the BAT source candidates positions not observed with Swift-XRT were covered by observations of these other X-ray telescopes. We identified 275 unambiguous associations and 5 double possible associations. To resolve the ambiguity in these cases, we applied criterion 2 as for XRT, finding no BAT excesses with more than one possible source association. Since we applied the same threshold criteria as for Swift-XRT, we can confidently assume a negligible number of spurious associations.
Finally, the identification of the soft X-ray counterpart was performed by searching in the SIMBAD2 and NED3 databases within the soft X-ray error box. In the few cases where the soft X-ray counterpart is an unknown source, we report it in our catalogue as a new source with a name composed by the PBCX acronym (Palermo BAT Catalogue X-ray source) followed by its soft X-ray coordinates with the precision of 1.5 arcsec in RA and 1 arcsec in Dec.
With strategy A we were able to associate 920 BAT excesses to a single softer counterpart and 8 BAT excesses to a double softer counterpart. 328 BAT excesses still lacking an association.
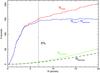 |
Fig. 4 Cumulative distribution of the number of BAT excesses not associated with strategy A having at least one of the strategy B list sources (see Sect. 4) within a given distance (red stepped line). The green continuous line represents the number of spurious associations evaluated using Eq. (1), while the black dashed line is the mean number of spurious associations evaluated by using a control sample of sky positions generated by scrambling the coordinates of the BAT excesses. The blue stepped line represents the true associations obtained as the difference between the red stepped line and the green continuous line. The vertical dotted line marks the radius (6.8 arcmin) that produces 5% of spurious associations. |
4.2. Strategy B
To find an association for the 328 BAT excesses still lacking an association, we adopted the following strategy. We compiled a list of possible counterparts (hereafter strategy B source list: SBSL) merging the following catalogues:
-
high and low mass X-ray binaries, cataclysmic variables,supernova remnants and pulsars, Seyfert galaxies, unclassifiedAGNs, cluster of galaxies, interacting galaxies, LINERs, andγ-ray sources, whose lists were extracted from the SIMBAD database on January 2010;
-
the Roma-BZCAT (Massaro et al. 2009);
-
the ROSAT All Sky Survey (RASS) Bright source catalogue (Voges et al. 1999).
The resulting catalogue contains NSBSL = 60 829 sources.
The number Ncross(R) of BAT excesses for which at least one SBSL source was within a specified distance R is represented by the red stepped line in Fig. 4.
Assuming that Ntrue of the NBAT = 328 BAT excesses have a counterpart in a generic catalogue of Ncat sources evenly distributed across the sky with a density λ = Ncat/4π, the number of expected spurious associations Nspurious generated by the NBAT − Ntrue sources without a counterpart in the catalogue is expressed by

To a first approximation we assumed that SBSL is uniformly distributed across the sky, so we apply the above expression with Ncat = NSBSL. Since Ntrue is not known in advance, we used the following procedure: we increased Ntrue with a unitary step and evaluated the difference between Ncross(R) and Nspurious(R). After increasing the correlation radius, this curve flattens because no further true associations are obtained. This happens for Ntrue ~ 195. The blue stepped line in Fig. 4 shows Ncross(R) − Nspurious(R) and the green continuous line represents Nspurious(R).
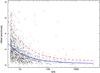 |
Fig. 5 Offset between the BAT position and the counterpart position as a function of the detection significance. A few values are far from the overall distribution either because they are in crowded fields and their reconstructed sky position is contaminated by the PSF of the nearest sources (red stars) or because they are extended sources (green circles). The solid blue line represents the fit to the data (excluding the outliers) with a power law. The dashed red line represents the 95% containment radius. |
As a further check, we defined a control sample, by generating 1000 lists of 328 − Ntrue = 133 sky positions: to preserve the Galactic coordinate distribution we scrambled the arrays of Galactic latitude and longitude of the BAT coordinate excesses and then extracted 133 couples of coordinates from these scrambled arrays. The mean number of spurious associations was then evaluated as a function of the association radius (Fig. 4, dashed line). This curve is in perfect agreement with the analytical one (green continuous line) out to ~8 arcmin and increases in size more slowly at larger distance. We verified that this difference is due to the inhomogeneity in SBSL and in particular to the clustering of sources in regions covered by deep optical surveys.
The ratio of Nspurious(R) to Ncross(R) is an estimate of the fraction of spurious association as a function of the association radius. We decided to accept a maximum of 5% of spurious associations that corresponds to an association radius of 6.8 arcmin. With this strategy, we associate 151 BAT sources with counterparts (131 with a single counterpart, 18 with a double counterpart, and 2 with a triple counterpart). The expected number of spurious associations is 6.8 ± 2.5.
As a result of these two association procedures, we found that 1079 BAT sources have at least an associated counterpart (1051 with a single counterpart, 26 with a double counterpart, and 2 with a triple counterpart) and that 177 sources still lack a counterpart. The probability of spurious association is negligible for sources associated with strategy A and 5% for those associated with strategy B.
In Fig. 5, we plot the offsets of each BAT source excess with respect to its associated counterpart versus (vs.) the detection significance (S/N). The offset of a few sources is far from the overall distribution: points indicated by a star (sources number 286, 328, 796, 856, 860, 869, 870, 902, 928, 949, 950, 954, 955, 956, 963, 977, and 979 in Table 2) are in crowded fields, and the reconstructed sky position is contaminated by the PSF of the nearest sources; those marked with a circle are extended sources (Coma cluster and Abell 2256). The distribution (excluding the outliers) can be modelled with a power law plus a constant giving the following best fit equation: ![\begin{equation} {\rm Offset(')} = (7.2\pm 1.2)\times {\rm [S/N]}^{-0.76\pm0.10} +(0.21\pm0.03), \end{equation}](/articles/aa/full_html/2010/16/aa15249-10/aa15249-10-eq52.png) (2)where the constant represents the systematic offset. At the detection threshold of 4.8 standard deviations, the average offset is 2.4 arcmin. The dashed red line in Fig. 5 represents the 95% containment radius evaluated as described in Segreto et al. (2010),
(2)where the constant represents the systematic offset. At the detection threshold of 4.8 standard deviations, the average offset is 2.4 arcmin. The dashed red line in Fig. 5 represents the 95% containment radius evaluated as described in Segreto et al. (2010), ![\begin{equation} \rm {\it R}_{95}(') = 12.5 \times [S/N]^{-0.68} + 0.54 \end{equation}](/articles/aa/full_html/2010/16/aa15249-10/aa15249-10-eq53.png) (3)where S/N is the detection significance.
(3)where S/N is the detection significance.
5. The 54-month catalogue
The complete catalogue of the sources detected in the first 54 months of BAT survey data is reported in Table 2. The table contains the following information:
-
Second Palermo BAT catalogue (2PBC) name of the source(Col. 2), built from the BAT coordinates with theprecision of 1.5 arcmin on RA and 1 arcmin on Dec.
-
Counterpart association (Col. 3) and source type (Col. 4) coded according to the nomenclature used in SIMBAD. For the blazars included in the Roma-BZCAT (Massaro et al. 2009), we report the nomenclature used in that catalogue: BZB for BL Lac objects, BZQ for flat-spectrum radio quasars, and BZU for blazars of uncertain type.
-
The RA and Dec of the BAT source in decimal degrees (Cols. 5, 6) measured in the energy band with the highest detection significance.
-
The 95% error radius (Col. 7) and offset with respect to the counterpart position (Col. 8).
-
Source significance (Col. 9) obtained in the energy band with the highest significance (a flag in Col. 19 indicates the energy range with the maximum significance).
-
Flux and errors (Cols. 10 and 11) in the 15–150 keV band averaged over the entire survey period. To produce spectra for the detected sources, we created all-sky maps in eight energy bands (15–20 keV, 20–24 keV, 24–35 keV, 35–45 keV, 45–60 keV, 60–75 keV, 75–100 keV, and 100–150 keV) from which we extracted the rates and their errors from the pixel corresponding to the most likely position of each BAT source (Sect. 3). These spectra were analysed using the BAT spectral redistribution matrix4 and the fluxes in the 15–150 keV were evaluated by fitting the spectra with a simple power law.
-
Hardness ratio (HR, Col. 12) and error (Col. 13) obtained as the ratio of the counts in the 35–150 keV band to those in the 15–150 keV band.
-
Redshift of the extragalactic sources (Col. 14) from the SIMBAD database (or NED, for the few cases that were not reported in SIMBAD).
-
Rest-frame luminosity (in units of log[erg s-1]) in the 15–150 keV band (Col. 15) calculated, when the redshift is available, using the expression
 (4)where F15 − 150 is the observed flux in the 15–150 keV band, Γ is the photon index obtained from the spectral fit, DL is the luminosity distance of the source, and z is its redshift. For sources with redshift < 0.01, we used the distance reported in the Nearby Galaxies Catalogue (NBG, Tully 1988) or NED, for the few cases that were not reported in the NBG catalogue.
 -
Variability index (Col. 16). In this second catalogue, we added a characterization of the time behaviour of the BAT-detected sources: the light curve of each source was binned at 7-days and the variability was investigated using a simple χ2 test. The rate in the jth 7-day time bin (Rj) is evaluated by weighting the rates of the light curve at maximum resolution by the inverse square of the corresponding statistical error
 (5)where ri are the rates observed in the light curve at maximum resolution, and eri are the corresponding statistical errors. The error in Rj is
  . The variability index is defined as
 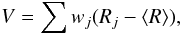 (6)where
 ![$w_j=[ER_J^2+(f\times R_j)^2]^{-1}$](/articles/aa/full_html/2010/16/aa15249-10/aa15249-10-eq68.png) and ⟨ R ⟩ = ∑ wjRj/ ∑ wj. A systematic error of f × Rj with f = 5% was added in quadrature to the statistical error of each bin, to obtain a variability index V ~ 1 for Crab, Vela Pulsar, and PSR 0540-69.
and ⟨ R ⟩ = ∑ wjRj/ ∑ wj. A systematic error of f × Rj with f = 5% was added in quadrature to the statistical error of each bin, to obtain a variability index V ~ 1 for Crab, Vela Pulsar, and PSR 0540-69. -
Flag column (Col. 17) with information on: energy band with the highest significance (A), flag for already known hard X-ray sources (B), position with respect to the Galactic plane (C), and strategy used for the identification (D, see Sect. 4).
-
Flag column (Col. 18) with information on the cross correlation between the BAT sources and the ROSAT, INTEGRAL, and Fermi catalogues. A BAT source is associated with a ROSAT source if the BAT counterpart lies within the 3σ error box of a source reported in the RASS bright and faint source catalogues (Voges et al. 1999, 2000). The cross-correlations of the BAT catalogue with the ISGRI sources and the Fermi sources were performed using the INTEGRAL General Reference Catalogue V.315 and the Fermi Large Area Telescope First Source Catalogue6 (Abdo et al. 2010), respectively, requiring that the sources had the same associated counterpart.
6. Statistical properties of the catalogue
Table 1 compares the numbers of counterparts associated with the sources detected in the 54-month all-sky mosaic among the different object classes, with similar results for the 39-month catalogue. Percentages are evaluated for both catalogues relative to the total number of BAT-detected sources. The sample consists of ~ 19% Galactic sources, ~ 56% extragalactic sources, and ~ 10% sources with a counterpart at softer energies whose nature has not yet been determined. We also found that ~ 15% of sources have no association at other wavelengths. The distribution of the associated sources among the different classes is almost identical to that of the 39-month catalogue. There is a significant difference for the fraction of unassociated sources, which is a factor ~ 1.6 lower than in the 39-month catalogue. This is because a Swift-XRT follow-up campaign was requested for the unassociated sources of the 39-month catalogue and the ROSAT catalogue was used in the association strategy of the 54-month catalogue. In contrast, we have a much higher fraction of unclassified sources ( ~ 10%), most of which are ROSAT sources of unknown nature. Figure 6 shows the map of the detected sources, colour-coded according to the object class and size-coded according to the 15–150 keV source flux (A), the hardness ratio (B), and the variability index (C), respectively.
Classification of the counterparts associated with the sources detected in the 54-month BAT survey.
Figure 7 shows the HR distribution for each class of objects. As expected, the HR distribution for BZB is softer than for BZQ: this difference arises because the 15–150 keV band samples the high energy tail of the synchrotron peak for BZB and the rising part of the Compton peak for BZQ. Blazars of uncertain classification (BZU) show an intermediate HR distribution. Clusters of galaxies fall in a very narrow region of soft HR: we verified that their spectral distribution is consistent with the tail of a thermal emission with kT ~ 10 keV, except for one object (CIZA J0635.0+2231), with HR = 0.26, where we find evidence of hard non-thermal emission that may be related to the AGN content of the cluster. The catalogue lists 67 objects classified as normal galaxies. The HR distribution of these sources peaks at ~0.4 in a similar way to the other classes of active galaxies. This suggests that these objects may also contain an active nucleus.
The HR distribution of the sources with uncertain classifications and of unassociated sources suggests that most of these are of extragalactic nature.
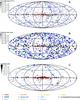 |
Fig. 6 Map of the sources (in Galactic coordinates) detected in the BAT survey data. The object class is colour-coded according to the legend. The size of the symbol is proportional to A) the 15–150 keV source flux; B) the hardness ratio obtained as the ratio of the counts in the 35–150 keV band to those in the 15–150 keV band; C) the variability index (as defined in Sect. 5). |
Figure 8 shows the distribution of the redshift (top panel) and luminosity (bottom panel) of the Seyfert 1 and Seyfert 2 galaxies included in the 54-month catalogue. The median of the redshift distribution is higher for Seyfert 1s (z˜Sy1 = 0.040) than for Seyfert 2s (z˜Sy2 = 0.025). The luminosity distribution shows that Seyfert 1s are intrinsically more luminous than Seyfert 2s.
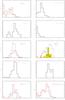 |
Fig. 7 Hardness ratio (35–150 keV)/(15–150 keV) distributions for the different classes of objects detected in the 54 months of BAT survey. |
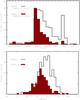 |
Fig. 8 Redshift distribution (top) and luminosity distribution (bottom) of the Seyfert galaxies. |
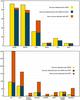 |
Fig. 9 Comparison between the sources in our catalogue and those detected with ISGRI and reported in the INTEGRAL General Reference Catalogue V31. Top: Galactic sources. Bottom: extragalactic sources. |
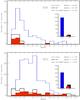 |
Fig. 10 Redshift distribution of the BZB (top) and BZQ (bottom) sources. The red line, the black dashed line, and the shaded blue area refer to blazars detected by Fermi, Swift-BAT, and common to both catalogues, respectively. The insets show the total number of blazars in each sample. |
6.1. The 54-month BAT catalogue and the INTEGRAL-ISGRI catalogue
We compared the sources detected in the 54-month BAT all-sky mosaic with those detected by INTEGRAL-ISGRI and reported in the INTEGRAL General Reference Catalogue V.31. The results are plotted in Fig. 9. For each object class, we report the sources detected by each of the two telescopes, highlighting those detected only by BAT. While ISGRI dedicated most of the first years of its mission to a deep scan of the Galactic plane, BAT has taken advantage of its larger (with respect to ISGRI) field of view and different pointing strategy to achieve a uniform exposure of the whole sky. Within the Galactic sample, the number of low mass and high mass X-ray binaries is marginally higher in the ISGRI catalogue, although 10 sources are detected only with BAT. These sources have a transient behaviour and are captured by BAT thanks to its larger field of view or because they are located in regions of low ISGRI exposure. BAT also detects a much larger sample (nearly a factor of 2) of cataclysmic variables, which are located mostly outside the Galactic plane. The BAT extragalactic sample is a factor of between 2 and 3 larger than the ISGRI sample, depending on the object class. This is expected because of the lower limiting flux reached by BAT outside the Galactic plane.
6.2. The 54-month BAT catalogue and the Fermi Large Area Telescope First Source Catalogue
We compared our BAT catalogue with the Fermi Large Area Telescope First Source Catalogue (Abdo et al. 2010) by searching for BAT sources whose position falls inside the error box of each Fermi source7.
We found 59 BAT/Fermi correspondences to be associated with the same counterpart: 16 BZBs, 27 BZQs, 5 BZUs, 3 Seyfert galaxies, 1 interacting galaxy, 3 high mass X-ray binaries, and 4 pulsars/supernova remnants. Moreover, there are 4 BAT/Fermi correspondences with different counterpart association, and 10 BAT/Fermi correspondences for which the Fermi source has not been associated with any counterpart. These 14 sources have been flagged with “?” in Col. 18 of Table 2.
The largest sample of common sources is the blazar sample. In line with our association strategy, we considered only Fermi blazars with a correspondence in the BZCAT. Figure 10 shows the redshift distributions of the selected common samples, superimposed on the redshift distributions of the whole Fermi and BAT blazar samples. The median of the redshift distribution for BZB is a factor of 2 higher for the Fermi sample than the BAT one, while the common sample has value in between these two. The median of the BAT and Fermi BZQ redshift distributions are very similar. The most distant blazar, 87GB 224928.1+22014 at z ~ 3.667, is detected only by BAT.
7. Conclusions
We have analysed the BAT hard X-ray survey data of the first 54 months of the Swift mission. The 4.8σ 15–150 keV survey flux limit achieved on 50% of the sky is ~0.9 × 10⁻¹¹ erg cm-2 s-1 (0.43 mCrab).
We have compiled all-sky maps for three energy bands (15–30 keV, 15–70 keV, and 15–150 keV) and searched for excesses above a significance threshold of 4.8 standard deviations. The final catalogue, obtained by cross-correlating and merging the lists of excesses detected in the three energy bands, contains 1256 source candidates. For each of them, we have searched for counterparts at lower energies using two different strategies. First we have analysed archival soft X-ray observations covering the position of the BAT excesses, applying count rate thresholds to select the most likely counterparts (strategy A). With this strategy, we have been able to associate 920 BAT excesses with a single softer counterpart; for 8 BAT excesses, we found two possible counterparts. The BAT excesses lacking any association after strategy A were cross-correlated with a list of possible counterparts compiled by merging several source lists (X-ray binaries, cataclysmic variables, supernova remnants, pulsars, cluster of galaxies, different classes of active galaxies, already known soft X-ray and γ-ray sources). This second strategy (strategy B) enabled us to associate 151 BAT sources with counterparts (18 with a double association, 2 with a triple association). The final catalogue contains 1079 BAT sources with at least one associated counterpart and 177 unassociated sources (~14%). The latter will be the subject of a follow-up campaign with Swift-XRT in the immediate future. The sources among the different object classes consist of ~19% Galactic sources, ~57% extragalactic sources, and ~10% sources with a counterpart at softer energies whose nature has not yet been determined.
The counterpart of 563 of the 1079 BAT sources with at least one associated counterpart is coincident with a bright ROSAT source, while 83 BAT sources have a counterpart consistent with the position of a faint ROSAT source. The remaining BAT counterparts (640) do not have any ROSAT correspondence. This
may be the signature of either moderate or strong absorption preventing detection in the ROSAT energy band.
Compared to the INTEGRAL-IBIS telescope, BAT has detected a much larger number of extragalactic sources. This difference is mainly due to the different field of view of the two telescopes and their different observing strategies.
The comparison of our BAT catalogue with the Fermi Large Area Telescope First Source Catalogue (Abdo et al. 2010) has established that 59 BAT/Fermi sources are associated with the same counterpart: 16 BZBs, 27 BZQs, 5 BZUs, 3 Seyfert galaxies, 1 interacting galaxy, 3 high mass X-ray binaries, and 4 pulsars/supernova remnants. These small number of correspondences clearly indicates that the sky at these two different energy ranges is populated by different source types.
BAT 54-month catalogue. Sources detected for the first time as hard X-ray emitters are reported in bold face.
Acknowledgments
This research has made use of NASA’s Astrophysics Data System Bibliographic Services, of the SIMBAD database, operated at CDS, Strasbourg, France, as well as of the NASA/IPAC Extragalactic Database (NED), which is operated by the Jet Propulsion Laboratory, California Institute of Technology, under contract with the National Aeronautics and Space Administration. This work was supported by contract ASI/INAF I/011/07/0.
References
- Abdo, A. A., Ackermann, M., Ajello, M., et al. 2010, ApJS, 187, 460 [NASA ADS] [CrossRef] [Google Scholar]
- Ajello, M., Greiner, J., Kanbach, G., et al. 2008a, ApJ, 678, 102 [NASA ADS] [CrossRef] [Google Scholar]
- Ajello, M., Rau, A., Greiner, J., et al. 2008b, ApJ, 673, 96 [NASA ADS] [CrossRef] [Google Scholar]
- Barthelmy, S. D., Barbier, L. M., Cummings, J. R., et al. 2005, Space Sci. Rev., 120, 143 [NASA ADS] [CrossRef] [Google Scholar]
- Cusumano, G., La Parola, V., Segreto, A., et al. 2010, A&A, 510, A48 [NASA ADS] [CrossRef] [EDP Sciences] [Google Scholar]
- Gehrels, N., Chincarini, G., Giommi, P., et al. 2004, ApJ, 611, 1005 [NASA ADS] [CrossRef] [Google Scholar]
- Górski, K. M., Hivon, E., Banday, A. J., et al. 2005, ApJ, 622, 759 [NASA ADS] [CrossRef] [Google Scholar]
- Markwardt, C. B., Tueller, J., Skinner, G. K., et al. 2005, ApJ, 633, L77 [NASA ADS] [CrossRef] [Google Scholar]
- Maselli, A., Cusumano, G., Massaro, E., et al. 2010, A&A, accepted [Google Scholar]
- Massaro, E., Giommi, P., Leto, C., et al. 2009, A&A, 495, 691 [NASA ADS] [CrossRef] [EDP Sciences] [Google Scholar]
- Segreto, A., Cusumano, G., Ferrigno, C., et al. 2010, A&A, 510, A47 [NASA ADS] [CrossRef] [EDP Sciences] [Google Scholar]
- Tueller, J., Mushotzky, R. F., Barthelmy, S., et al. 2008, ApJ, 681, 113 [NASA ADS] [CrossRef] [Google Scholar]
- Tueller, J., Baumgartner, W. H., Markwardt, C. B., et al. 2010, ApJS, 186, 378 [NASA ADS] [CrossRef] [Google Scholar]
- Tully, R. B. 1988, Nearby Galaxies Catalogue (NBG) (Cambridge University Press) [Google Scholar]
- Voges, W., Aschenbach B., Boller, T., et al. 1999, A&A, 349, 389 [NASA ADS] [Google Scholar]
- Voges, W., Aschenbach B., Boller, T., et al. 2000, IAUC, 7432, 1 [Google Scholar]
All Tables
Classification of the counterparts associated with the sources detected in the 54-month BAT survey.
BAT 54-month catalogue. Sources detected for the first time as hard X-ray emitters are reported in bold face.
All Figures
|
Fig. 1 Fraction of the sky (top: |b| < 10°, bottom: |b| > 10°) covered by the BAT survey as a function of the 15–150 keV detection limiting flux for a detection threshold of 4.8 standard deviations. Different colours refer to different survey epochs. The insets show the limiting flux achieved for 50% of the sky as a function of time; the best fit is a power law consistent with t-0.5. |
| In the text | |
|
Fig. 2 Map of the limiting flux of the 54-month BAT survey in the 15–150 keV band, projected in Galactic Aitoff coordinates, with the ecliptic coordinates grid superimposed. The colour bar shows the scale in erg cm-2 s-1. |
| In the text | |
|
Fig. 3 Distribution of pixel significance in the BAT all-sky map. The continuous curve is the result of a Gaussian fit obtained by excluding the distribution tail. The best-fit model parameters are consistent with a mean and standard deviation of 0.0 and 1.0, respectively. |
| In the text | |
|
Fig. 4 Cumulative distribution of the number of BAT excesses not associated with strategy A having at least one of the strategy B list sources (see Sect. 4) within a given distance (red stepped line). The green continuous line represents the number of spurious associations evaluated using Eq. (1), while the black dashed line is the mean number of spurious associations evaluated by using a control sample of sky positions generated by scrambling the coordinates of the BAT excesses. The blue stepped line represents the true associations obtained as the difference between the red stepped line and the green continuous line. The vertical dotted line marks the radius (6.8 arcmin) that produces 5% of spurious associations. |
| In the text | |
|
Fig. 5 Offset between the BAT position and the counterpart position as a function of the detection significance. A few values are far from the overall distribution either because they are in crowded fields and their reconstructed sky position is contaminated by the PSF of the nearest sources (red stars) or because they are extended sources (green circles). The solid blue line represents the fit to the data (excluding the outliers) with a power law. The dashed red line represents the 95% containment radius. |
| In the text | |
|
Fig. 6 Map of the sources (in Galactic coordinates) detected in the BAT survey data. The object class is colour-coded according to the legend. The size of the symbol is proportional to A) the 15–150 keV source flux; B) the hardness ratio obtained as the ratio of the counts in the 35–150 keV band to those in the 15–150 keV band; C) the variability index (as defined in Sect. 5). |
| In the text | |
|
Fig. 7 Hardness ratio (35–150 keV)/(15–150 keV) distributions for the different classes of objects detected in the 54 months of BAT survey. |
| In the text | |
|
Fig. 8 Redshift distribution (top) and luminosity distribution (bottom) of the Seyfert galaxies. |
| In the text | |
|
Fig. 9 Comparison between the sources in our catalogue and those detected with ISGRI and reported in the INTEGRAL General Reference Catalogue V31. Top: Galactic sources. Bottom: extragalactic sources. |
| In the text | |
|
Fig. 10 Redshift distribution of the BZB (top) and BZQ (bottom) sources. The red line, the black dashed line, and the shaded blue area refer to blazars detected by Fermi, Swift-BAT, and common to both catalogues, respectively. The insets show the total number of blazars in each sample. |
| In the text | |
Current usage metrics show cumulative count of Article Views (full-text article views including HTML views, PDF and ePub downloads, according to the available data) and Abstracts Views on Vision4Press platform.
Data correspond to usage on the plateform after 2015. The current usage metrics is available 48-96 hours after online publication and is updated daily on week days.
Initial download of the metrics may take a while.