Fig. 4
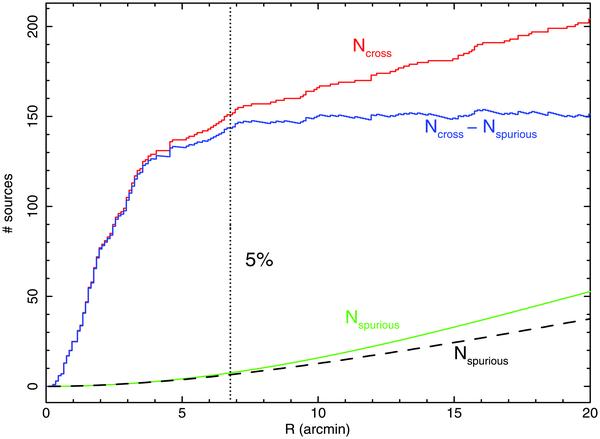
Cumulative distribution of the number of BAT excesses not associated with strategy A having at least one of the strategy B list sources (see Sect. 4) within a given distance (red stepped line). The green continuous line represents the number of spurious associations evaluated using Eq. (1), while the black dashed line is the mean number of spurious associations evaluated by using a control sample of sky positions generated by scrambling the coordinates of the BAT excesses. The blue stepped line represents the true associations obtained as the difference between the red stepped line and the green continuous line. The vertical dotted line marks the radius (6.8 arcmin) that produces 5% of spurious associations.
Current usage metrics show cumulative count of Article Views (full-text article views including HTML views, PDF and ePub downloads, according to the available data) and Abstracts Views on Vision4Press platform.
Data correspond to usage on the plateform after 2015. The current usage metrics is available 48-96 hours after online publication and is updated daily on week days.
Initial download of the metrics may take a while.