Fig. 5
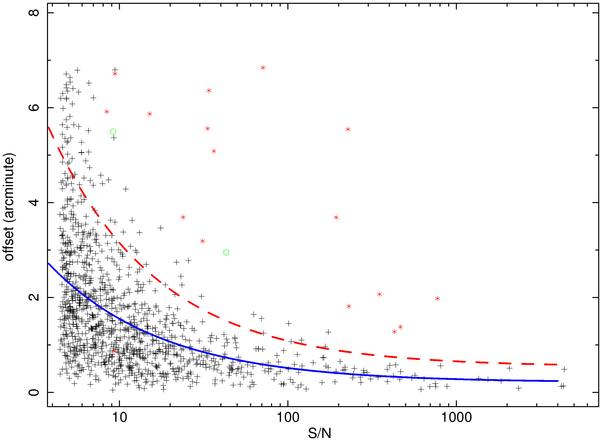
Offset between the BAT position and the counterpart position as a function of the detection significance. A few values are far from the overall distribution either because they are in crowded fields and their reconstructed sky position is contaminated by the PSF of the nearest sources (red stars) or because they are extended sources (green circles). The solid blue line represents the fit to the data (excluding the outliers) with a power law. The dashed red line represents the 95% containment radius.
Current usage metrics show cumulative count of Article Views (full-text article views including HTML views, PDF and ePub downloads, according to the available data) and Abstracts Views on Vision4Press platform.
Data correspond to usage on the plateform after 2015. The current usage metrics is available 48-96 hours after online publication and is updated daily on week days.
Initial download of the metrics may take a while.