Fig. 6
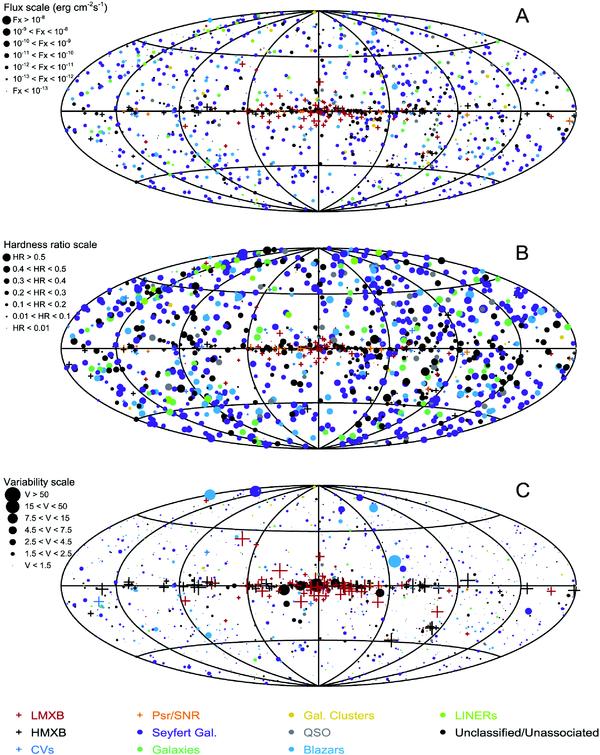
Map of the sources (in Galactic coordinates) detected in the BAT survey data. The object class is colour-coded according to the legend. The size of the symbol is proportional to A) the 15–150 keV source flux; B) the hardness ratio obtained as the ratio of the counts in the 35–150 keV band to those in the 15–150 keV band; C) the variability index (as defined in Sect. 5).
Current usage metrics show cumulative count of Article Views (full-text article views including HTML views, PDF and ePub downloads, according to the available data) and Abstracts Views on Vision4Press platform.
Data correspond to usage on the plateform after 2015. The current usage metrics is available 48-96 hours after online publication and is updated daily on week days.
Initial download of the metrics may take a while.