| Issue |
A&A
Volume 524, December 2010
|
|
|---|---|---|
| Article Number | A82 | |
| Number of page(s) | 9 | |
| Section | Stellar atmospheres | |
| DOI | https://doi.org/10.1051/0004-6361/200912612 | |
| Published online | 25 November 2010 | |
The Quintuplet cluster
II. Analysis of the WN stars⋆
1
Universität Potsdam, Institut für Physik und Astronomie,
14476
Potsdam,
Germany
e-mail: liermann@mpifr-bonn.mpg.de
2
Universitäts-Sternwarte München, 81679
München,
Germany
Received: 1 June 2009
Accepted: 30 July 2010
Based on K-band integral-field spectroscopy, we analyze four Wolf-Rayet stars of the nitrogen sequence (WN) found in the inner part of the Quintuplet cluster. All WN stars (WR 102d, WR 102i, WR 102hb, and WR 102ea) are of spectral subtype WN9h. One further star, LHO 110, is included in the analysis which has been classified as Of/WN? previously but turns out to be most likely a WN9h star as well. The Potsdam Wolf-Rayet (PoWR) models for expanding atmospheres are used to derive the fundamental stellar and wind parameters. The stars turn out to be very luminous, log (L/L⊙) > 6.0, with relatively low stellar temperatures, T∗ ≈ 25−35 kK. Their stellar winds contain a significant fraction of hydrogen, up to XH ~ 0.45 (by mass). We discuss the position of the Galactic center WN stars in the Hertzsprung-Russell diagram and find that they form a distinct group. In this respect, the Quintuplet WN stars are similar to late-type WN stars found in the Arches cluster and elsewhere in the Galaxy. Comparison with stellar evolutionary models reveals that the Quintuplet WN stars should have been initially more massive than 60 M⊙. They are about 2.4 − 3.6 million years old, and might still be central hydrogen burning objects. The analysis of the spectral energy distributions of the program stars results in a mean extinction of AK = 3.1 ± 0.5 mag (AV = 27 ± 4 mag) towards the Quintuplet cluster.
Key words: open clusters and associations: individual: Quintuplet / stars: Wolf-Rayet / stars: winds, outflows / stars: evolution / stars: atmospheres
© ESO, 2010
1. Introduction
The Galactic center (GC) is a unique region to study star formation and evolution in the special environment close to the supermassive black hole. Three very massive clusters have been found within 35 pc projected distance to the GC, hosting a large fraction of the known Galactic massive stars such as luminous blue variables (LBV) and Wolf-Rayet (WR) stars.The Central cluster is located within 1 pc from the central black hole (Krabbe et al. 1991). Two further massive star clusters, the Arches and the Quintuplet, are located in the vicinity of Sgr A*. Interestingly the three clusters differ in age, the 2.5 Ma old Arches cluster (Figer et al. 2002; Najarro et al. 2004) contains many OB and WN type stars, while the more evolved Quintuplet cluster and Central cluster with ages of about 4 and 6 Ma (Figer et al. 1999a; Paumard et al. 2006) contain WC stars as well. In addition, one well known LBV, the Pistol star (Figer et al. 1999a,b), and further LBV candidates (Geballe et al. 2000; Barniske et al. 2008) are found in the vicinity of the Quintuplet cluster.
Massive stars in general, and WR stars in particular, are important sources of ionizing photons, momentum and chemical elements to impact on the circumstellar medium. Stars that display CNO-processed matter in a strong stellar wind are classified as WR stars of the nitrogen sequence (WN type). The cooler, late WN subtypes (WNL) usually contain some rest of hydrogen in their atmospheres, while the hotter, early subtypes (WNE) are hydrogen free (Hamann et al. 1991). Typically, WNL stars are significantly more luminous than WNE stars (Hamann et al. 2006). The WN stage may be followed by the WC stage, when the products of helium burning appear in the stellar atmosphere. Some evolutionary scenarios suggest that the most massive of these stars undergo LBV phases (Langer et al. 1994), and the WNL phase might even precede the LBV stage (Crowther 2007; Smith & Conti 2008), whereas some evolutionary paths for stars with initial masses > 90 M⊙ seem to skip the LBV stage completely (Maeder et al. 2008). However, the details of the evolution of massive stars are still under debate.
By means of quantitative spectral analysis in combination with comprehensive stellar model atmospheres the stellar parameters can be assessed. This allows to determine feedback parameters of the population of massive stars in the Galactic center and will provide constrains on stellar evolutionary models.
However, the high extinction in this direction (AV ≈ 28 mag) prohibits observations in the UV and optical range. Therefore, IR spectroscopy is the prime tool to study massive stars in the GC. Different ESO IR-instruments at La Silla and VLT Paranal were used to observe the Central cluster (Najarro et al. 1994; Krabbe et al. 1995; Eckart et al. 2004; Paumard et al. 2006; Martins et al. 2007), the Arches cluster (Blum et al. 2001; Martins et al. 2008), and the Quintuplet cluster (Liermann et al. 2009).
Najarro et al. (1997) and Martins et al. (2007) both applied CMFGEN stellar atmosphere models (Hillier & Miller 1998) to analyze K-band spectra of massive stars in the Central cluster. They found that the stellar parameters of these stars are similar to other Galactic WNL stars. Most of the WNL stars studied by Martins et al. (2007, note that some are classified only as Ofpe/WN9 stars) appear relatively rich in hydrogen. Therefore, the authors support the evolutionary sequence (Ofpe/WN9 ↔ LBV) → WN8 → WN/C for most of the observed stars.
In their study of the brightest stars in the Arches cluster, Martins et al. (2008) found that these stars are either H-rich WN7-9 stars or O supergiants with an age of 2 to 4 Ma. The WN7-9h stars reveal high luminosities, log L/L⊙ = 6.3, which is consistent with initial stellar masses of ~ 120 M⊙. The chemical composition shows both N enhancement and C depletion along with a still high amount of H, which leads the authors to conclude that the stars are core H-burning objects. It was found that the properties of the Arches massive stars argue in favor of the evolutionary scenario of Crowther et al. (1995) O → Of → WNL + abs → WN7. Thus, the massive stars in the Central and in the Arches cluster seem to conform to the standard evolutionary models, and display stellar feedback parameters that do not significantly differ from other massive stars in the Galaxy.
The present paper is based on our observations with the ESO-VLT Spectrograph for INtegral Field Observation in the Near-Infrared (SINFONI) of the central parts of the Quintuplet cluster. A spectral catalog of the point sources (hereafter LHO catalog) was presented by Liermann et al. (2009). The LHO catalog lists 13 WR stars, among them 4 WN and 9 WC types. In this paper we concentrate on the analysis of the WN stars, while the analysis of WC stars will be subject of a subsequent paper. Additionally, we analyze the star LHO 110, which was classified as Of/WN candidate in the LHO catalog. However, the spectrum of this star strongly resembles spectra of typical WN stars, therefore we include LHO 110 in our sample.
In order to analyze our program stars (WR 102d, WR 102i, WR 102hb, WR 102ea, and LHO 110), we fit their spectra with the Potsdam Wolf-Rayet model atmospheres (Hamann & Gräfener 2004, see also references therein) and derive the fundamental stellar parameters. By quantitative comparison of stellar evolutionary models including rotation (Meynet & Maeder 2003) with the stellar parameters the initialmasses and ages of the sample stars are determined.
The paper is organized as follows. In Sect. 2 we give a short characterization of the applied model atmospheres. The spectral analyses is described in Sect. 3 and the derived stellar parameters are discussed in Sect. 4. Therein, mass-loss rates from radio free-free emission are debated (Sect. 4.2) and our empirical results are compared with evolutionary models (Sect. 4.4). We conclude with a summary of the obtained results in Sect. 5.
2. The models
The Potsdam Wolf-Rayet non-LTE model atmospheres (Hamann & Gräfener 2004, PoWR) are based on the assumptions of spherical symmetry and stationary mass loss. A velocity field is pre-scribed by the standard β-law for the supersonic part, with the terminal velocity υ∞ as a free parameter. The exponent β is set to unity for all models. In the subsonic region the velocity field is defined such that a hydrostatic density stratification is approached. Our models have the inner boundary set to a Rosseland optical depth of 20, thus defining a “stellar radius” R∗ that represents the hydrostatic core of the stars. The “stellar temperature” T∗ is given by the luminosity L and the stellar radius R∗ via the Stefan-Boltzmann law, i.e. T∗ denotes the effective temperature referring to the radius R∗.
We account approximately for wind inhomogeneities (“clumping”), assuming that optically thin clumps fill a volume fraction fV while the interclump space is void. Thus, the matter density in the clumps is higher by a factor  compared to an un-clumped model of same parameters. All models are calculated with D = 4 which is a rather conservative choice. Small scale random motions are considered by applying a microturbulence velocity of υD = 100 kms-1. Model atoms comprise hydrogen, helium, CNO and iron-group elements. The latter are accounted for in a “superlevel” approach enabling blanketing by millions of lines (Gräfener et al. 2002).
3. The analysis
3.1. The observations
We use flux-calibrated K-band spectra from the LHO catalog for the stars WR 102d (LHO 158), WR 102i (LHO 99), WR 102hb (LHO 67), WR 102ea (LHO 71) and LHO 110. The data had been flux-calibrated by means of standards stars and then applied for synthetic aperture photometry, yielding a mean error on the obtained K-band magnitudes of 0.4 mag (see LHO catalog for further details). For the comparison of the stellar parameters, we refer to previous studies of Galactic WN stars (Hamann et al. 2006) and of the WN stars in the Arches cluster (Martins et al. 2008). Two further WR stars in the vicinity of the Quintuplet cluster, WR 102c and WR 102ka, have been analyzed by Barniske et al. (2008) recently.
Our analysis is based on pronounced lines in the observed K-band spectra, which are due to helium and hydrogen: He i at 2.059 μm and 2.113 μm, He ii at 2.189 μm (10 − 7), and Brγ at 2.166 μm blended with He ii (14 − 8) and various He i lines. A selection of K-band lines is compiled in Table 1.
A selection of lines in the K-band.
Stellar parameters for the analyzed WN stars in the Quintuplet cluster.
3.2. PoWR – WN model fitting
The normalized emission line spectra of Wolf-Rayetstars depend predominantly on two parameters, the stellar temperature T∗ and a combination of parameters which was put in the form of the so-called “transformed radius” (Schmutz et al. 1989) ![\begin{equation} R_{\rm t} = R_* \left[ \frac{\varv_\infty}{2500~{\rm km~s}^{-1}} \left/ \frac{\sqrt{D}\dot{M}}{10^{-4}~M_\odot\,\textrm{a}^{-1}}\right]\cdot \right. \label{eq:transformed-radius} \end{equation}](/articles/aa/full_html/2010/16/aa12612-09/aa12612-09-eq46.png) (1)The first step in the analysis is to adjust these two parameters such that the observed helium lines are reproduced. Concerning Brγ, the hydrogen abundance is the relevant parameter, while the terminal velocity υ∞ sets the width of the line profiles.
(1)The first step in the analysis is to adjust these two parameters such that the observed helium lines are reproduced. Concerning Brγ, the hydrogen abundance is the relevant parameter, while the terminal velocity υ∞ sets the width of the line profiles.
Our analyses start from the two available grids1 of WN-type model atmospheres, calculated for a hydrogen abundance of 20% by mass (“WNL” grid) and for hydrogen-free stars (“WNE” grid), respectively. Since all our program stars are of late spectral type with signatures of hydrogen in their spectra (WN9h), the WNL grid turns out to be more appropriate. This grid had been calculated for a fixed terminal wind velocity of υ∞ = 1000 km s-1. After the best-fitting grid modelswere pointed out, we calculated individual models for each star with specially adjusted υ∞ and hydrogen abundance in order to optimize the fits.
The results are shown in Table 2, while the observed spectra with the model fits are shown in Figs. 1 and 2. Note that we normalized the observed spectra by division through the reddened model continuum.
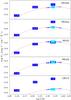 |
Fig. 1 Spectral energy distributions for the sample stars. Blocks with labels indicate the 2MASS magnitudes for the J-, H- and Ks-band (dark blue boxes), as well as the LHO Ks magnitude (light blue box). The solid line is the flux-calibrated LHO spectrum while the dotted line refers to the reddened model continuum. |
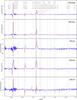 |
Fig. 2 Spectral fits for the sample stars. Observed spectra (blue solid line) are normalized using their reddened model continuum, the normalized model spectrum is overlayed (red dotted lines). The observed spectra are corrected for radial velocities according to Table 2 in the LHO catalog. |
In the next step, we fit the spectral energy distribution (SED) which for our program stars is only available for the near-infrared range. Figure 1 shows the photometric fluxes in J, H and K from 2MASS (Skrutskie et al. 2006), and our flux-calibrated spectra from the LHO catalog together with the photometric magnitude derived there. Crowding in the cluster field does not allow photometric fluxes to be extracted, e.g. from Spitzer IRAC or MSX images.
In the case of WR 102d we encountered a problem with the 2MASS magnitudes from the final release of the catalog, which gives unplausible values. Moreover, we find a coordinate offset between the 2MASS position and the LHO position of WR 102d of almost 5″; we identify the 2MASS position rather with LHO 147 (see LHO catalog). However, the data from the 2MASS intermediate release catalog, although considered to be obsolete, contain a point source at exactly the position of WR 102d with fluxes that fit very well to our calibrated K-band spectrum. Therefore we adopt these values for the SED fit.The comparison with the near-IR photometry presented by Figer et al. (1999a, filters J, H2 and K2 supports this choice.
The model continuum (red dotted lines in Fig. 1) isthen fitted to the observations by adjusting two parameters, the reddening parameter (e.g. given in the form of the color excess Eb − υ in the narrow-band system of Smith 1968, see Table 2) and the stellar luminosity.We adopt a distance to the Quintuplet of 8 kpc, corresponding to a distance modulus of 14.52 mag (Reid 1993). The reddening law which we adopt is from Moneti et al. (2001).The reddening parameter Eb − υ translates to the usual Johnson system as EB − V = 1.21 × Eb − υ, while the extinction in the K-band is AK = 0.42 × Eb − υ. Thanks to the approximate invariance of Wolf-Rayet line spectra for models with same transformed radius, models can be scaled to different luminosities for the SED fit while the line fit is preserved. Generally we can reproduce the SED quite well. We attribute the remaining discrepancies to problems of the 2MASS photometry in the crowded field.
Remember that we have already employed the model continuum to normalize the observed spectra. Insofar, the described two steps of the analysis are in fact an iterative procedure. The derived extinction parameters are compiled in Table 2 and further discussed in Sect. 3.7. After we fitted the line spectrum and the SED, the whole set of stellar parameters is established (see Table 2).
3.3. WR 102ea and WR 102hb
These stars, as well as LHO 110 (see Sect. 3.5), do not show clear He ii lines in their spectra, which is indicative for a low-temperature regime in their atmospheres. Attempts to fit the spectra with models of too cool temperatures makes those lines disappear completely and overestimates the He i lines instead, especially He i 2.059 μm. In comparison, a hotter model produces too strong He ii lines in a strength in which they are not observed.
Additionally, these stars have terminal wind velocities of 300 − 400 km s-1, which is rather slow for WR winds. In comparison, the adopted standard microturbulence υD = 100 km s-1 might be too high. Therefore, we tested different microturbulent velocities down to υD = 20 km s-1. However, the best fit to the observed profile shapes is obtained for υD = 80 km s-1. In any case, the effect of this parameter on the synthetic K-band spectra is small.
3.4. WR 102d and WR 102i
The spectra of these two stars both show He i and He ii lines which allow the temperature to be determined more reliably than in the previous cases. As for WR 102i, however, our model fall short in reproducing the strong emission feature of He i at 2.113 μm, while the absorption feature is too strong. Although a bit hidden in the telluric residuals, the same seems to hold for He i at 2.059 μm, but the He ii absorption at 2.189 μm fits perfectly. Alternatively, we found slightly hotter models which reproduce the He i emission, but then fail with the He ii lines turning into emission. We are not sure about the reason for these inconsistencies, but we note that e.g. the N iii doublet at 2.247/51 μm seems to show a different radial velocity, possibly indicating that the spectrum is composite from a binary. This needs further observations to be confirmed. For the moment, the fit problems introduce extra uncertainty which might be lower for the alternative models.
In the case of WR 102d the lines He i at 2.059 μm and He ii at 2.189 μm can be reproduced consistently by the model. With the stellar temperature being well constrained, the Brγ fit also yields an accurate hydrogen abundance (see Fig. 3).
However, the spectra of both stars show remarkably strong N iii lines at 2.247/51 μm. Although we already spent some efforts in improving the corresponding part in our nitrogen model atom, our models notoriously fail to reproduces this doublet in the strength it is observed here, while it is reasonably well fitted for the weak emission in WR 102ea and WR 102hb.
In comparison to the other stars in the sample these two stars show the highest terminal wind velocities, which are more representative for WN stars. The final best fitting models were calculated with the standard microturbulence υD = 100 km s-1.
3.5. LHO 110
LHO 110 was classified as O6-8 Ife in the LHO catalog. The emission line spectrum is very similar to the spectral appearance of the WN stars, although the spectral features are less pronounced. In detail, the star has a similar Ks magnitude as the WN9 stars and also shows similar line ratios for (He ii 2.189 μm)/(He ii/Brγ 2.166 μm) and (Brγ)/(He i 2.059 μm).
We analyzed the star in the same way as described above for the WN stars. We calculated tailored models to fit the line spectrum and SED accordingly, see Figs. 1 and 2.The obvious weakness of Brγ leads to a hydrogen mass fraction as low as 5%. However, models with zero hydrogen cannot fit the blend at all which excludes the star to be hydrogen free. Hence the spectral classification in the LHO catalog must be revised to WN9h. Following the naming conventions of van der Hucht (2001) this star could become WR 102df. The flux-calibrated spectrum can be well fitted with the model SED, but cannot be connected to the 2MASS photometry. As in the case of WR 102d, we attribute this to the problems of the 2MASS measurements. The star lies in the central region of the cluster where crowding might have affected the 2MASS data. Further on, a set of small absorption lines is present in the spectrum, which we cannot identify. They might indicate that LHO 110 is a binary. However,like the other stars in our sample, LHO 110 has not been detected in X-rays (Wang et al. 2006).Collision of stellar winds in binary WN starsoften make them brighter X-ray sources than single stars (e.g. Oskinova 2005). Therefore, the binary nature of LHO 110 cannot yet be confirmed.
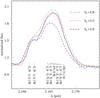 |
Fig. 3 Normalized line spectrum of WR 102d showing the Brγ/He i/He ii blend (blue solid line) with the best fitting model (red dotted line). For comparison we plot modelswith 20% (green dash-dotted line) and 10% (black dashed line) hydrogen by mass but otherwise identical parameters. |
3.6. Error margins
The temperature of the model to be fitted can quite accurately be determined for at least those sample stars that show He i and (even weak) He ii lines. In comparison, too cool or too hot a model would produce He ii lines in a weakness or strength in which they are not observed. From this, we consider our temperatures to be exact within the range of ± 0.025 dex, in general.
Different influences contribute to the error of the luminosities given in Table 2. The fit of the SED depends on the accuracy of the photometric measurements. The 2MASS colors often suffer from source confusion, while the Ks magnitudes from the LHO catalog have been calibrated to an accuracy of ± 0.1 mag. The reddening parameter Eb − υ obtained from the slope of the SED is accurate by about ± 0.1 mag, which gives only a 0.04 mag uncertainty in the K-band extinction.
Given that we fit the SED in the Rayleigh-Jeans domain, the bolometric correctionfactor (100.4BC) scales with  . Hence the temperature contributes about 10 % to the error margin of the luminosity. In combination we think that log L has a typical error of about ± 0.16 dex.
As described in Sect. 3.2, the hydrogen content was determined by fitting models with different mass fractions of hydrogen to the spectra. Figure 3 showsthe Brγ/He i/He ii blend at 2.166 μm of WR 102d. The model with a hydrogen abundance of 15% by mass gives the best fit to the observation (dotted line) within the error range of 10 to 20% hydrogen. Therefore we conclude that the derived values for XH are correct within ± 5% by mass, accounting also for uncertainties in the fit of the continuum.
3.7. Extinction
In the LHO catalog we assumed an average extinction of AK = 3.28 mag (Figer et al. 1999a) for the Quintuplet cluster. With the model fit of the SEDs for our sample stars, we have determined individual values for the reddening. The results for the stars are listed in Table 3, with an average of AK = 3.1 ± 0.5 mag, similar to the one determined by Barniske et al. (2008), who analyzed the stars WR102c and WR102ka, and Figer et al. (1999a). The average extinction of the Arches cluster was found to be AK = 2.8 mag by Martins et al. (2008), slightly lower than for the Quintuplet.
Extinction derived from fitting the model SEDs, applying the reddening law of Moneti et al. (2001) in the infrared range.
Within the errors, we conclude that the major part of the extinction can be attributed to the foreground interstellar reddening. From the limited number of stars analyzed it is not possible to derive an extinction map for the Quintuplet cluster. We find a slight increase in the determined values towards LHO 110 which is located closer in the cluster center. This could be due to the intrinsic cluster extinction expected from the presence of dust-producing WC stars (Tuthill et al. 2006).
4. Discussion
4.1. Stellar parameters
Figure 4 shows the derived empirical mass-loss rates versus stellar luminosity. The stars analyzed in this work fall below the mass loss-luminosity relation of Nugis & Lamers (2000) for stars containing 40% hydrogen per mass (lower line). From their determined hydrogen abundance (see Table 2), one would expect to find these stars positioned between this relation and the one for hydrogen-free stars (upper line).
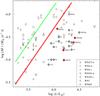 |
Fig. 4 Mass-loss rate versus stellar luminosity for the sample stars. For comparison we show Arches WNL stars from Martins et al. (2008, labeled with F and B numbers), WR102c and WR102ka from Barniske et al. (2008) and Galactic WN stars (Hamann et al. 2006, open symbols). The solid lines refer to the mass loss-luminosity relation of Nugis & Lamers (2000) for hydrogen-free stars (green upper line) and stars containing 40% hydrogen per mass (red lower line). |
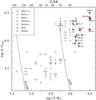 |
Fig. 5 HRD showing the analyzed WN9h stars (red filled symbols). For comparison we plotsingle Galactic WN stars from Hamann et al. (2006) (open symbols), WNL stars of the Arches cluster from Martins et al. (2008, labeled with F and B numbers), and WR102c and WR102ka from Barniske et al. (2008). Different symbols refer to different spectral subtypes, cf. inset. Hydrogen and helium zero-age main-sequence are given as solid lines. |
Not only our program stars have rather low mass-loss rates compared to their luminosities, the same holds for other Galactic WN stars shown in Fig. 4 (open symbols, from Hamann et al. 2006), including the WNL stars in the Arches cluster (Martins et al. 2008, symbols labeled B and F, from) which have similar hydrogen contents. For radiation-driven winds, the mass-loss rates scale with the metallicity (Gräfener & Hamann 2008). Therefore, the relatively low mass-loss rates provide an indirect argument that the metallicity in our program stars is not significantly higher than in other Galactic WN stars studied so far.
However, the possibility that the Galactic center might be metal enriched is still under debate. Najarro et al. (2004) obtained solar metallicities for a sample of stars in the Arches cluster, while recent results on a larger sample in the same cluster favored slight metal enrichment in the range of 1.3 to 1.4 Z⊙ (Martins et al. 2008). For the Quintuplet cluster, Najarro et al. (2009) used quantitative spectral analysis of the LBV Pistol star and LBV candidate FMM 362 to measure the metallicity in the cluster. Their results indicate solar iron abundance and roughly twice the solar abundance in the α-elements. They suggest that the enrichment in α-elements versus Fe found in the two Quintuplet LBVs is consistent with a top-heavy initial mass function (IMF) in the GC. Davies et al. (2009) analyzed the red supergiant GMM 7 (LHO 7) in the cluster. The authors find a slight iron enrichment which they explain by the evolved nature of the object and the resulting hydrogen depletion. They argue that the “initial” iron abundance would be in agreement with solar values.
The Hertzsprung-Russell diagram (HRD, Fig. 5) shows the program stars of the Quintuplet cluster in comparison to other Galactic WN stars. We include WN stars from the Arches cluster (Martins et al. 2008, symbols labels B and F, from) and the two bright stars WR102c and WR102ka (Barniske et al. 2008). The whole sample of single Galactic WN stars (Hamann et al. 2006, open symbols) is also shown for comparison.
Obviously, the GC stars populate a special domain in the HRD. They lie within a group of rather cool, T∗ ≤ 50000 K, but very luminous WN stars with log (L/L⊙) > 6.0. Like most WNL stars in the Galaxy, our GC stars show some rest of hydrogen with mass fractions of the order of 20%. While about half of the Galactic WN stars belong to the “early” subclass (WNE) that resides to the left side of the ZAMS (see Fig. 5), no single such hot WN star has been found in the Galactic center region.
One may wonder if the low stellar temperatures obtained for the GC stars are due to systematic errors of spectral analyses that are based on the K-band only. But the stars in the Arches cluster analyzed by Martins et al. (2008) show that independent groups arrive at similar results.
Can the lack of WNE stars be attributed to selection effects? Compared to WNL stars, WNE stars are roughly three magnitudes fainter in the K-band (cf. Hamann et al. 2006, the difference is similar as for the visual band). Since the apparent K-band magnitude of our program stars is about 10 mag (Table 2), the WNE stars should not all have escaped from detection in the LHO catalog which is complete to the 13th magnitude.
A statistical comparison with the WNE star population in other regions of the Milky Way confirms that WNEs are usually detected with slightly fainter K-band magnitudes compared to their local WNL counterparts. However, the number ratio NWNL:NWNE varies largely from 24:33 for Galactic WN (Hamann et al. 2006), 4:11 for Wd 1 (Crowther et al. 2006), 10:3 for the GC Central cluster (Martins et al. 2007), 13:0 for the Arches (Martins et al. 2008), and 5:0 for the Quintuplet, indicating a lack of WNE stars in the GC region.
Hence, we must conclude that the population of WN stars in the Galactic center region is different from the Galactic WN population in general. This may be attributed to various reasons: a special star-formation history, a different initial mass function (IMF), or a (slightly) higher metallicity that increases the mass loss during stellar evolution. A closer investigation of this question may give important insight into the conditions of the Galactic center environment.
For all stars in the sample we derive the wind momentum efficiency number η = Ṁυ∞c/L, see Table 2.Recall that we have adopted a clumping contrast of D = 4 throughout this paper (cf. Sect. 2). If D is higher, this would reduce the empirical mass-loss rates ∝ D −1/2 and thus lead to smaller η values. However, this number cannot exceed unity in radiation-driven winds unless multiple scattering is taken account. Gräfener & Hamann (2005, 2008) have shown that η-values of a few can be easily obtained in hydrodynamically consistent WR models with full radiative transfer. For all stars we find values of η close to unity, which is consistent with these stellar winds being radiatively driven.
4.2. Radio mass-loss rates
Three of the sample stars are known to be radio sources from Lang et al. (2005). We calculated the mass-loss rates from radio free-free emission with radio fluxes from these authors and follow Wright & Barlow (1975)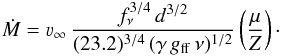 (2)The free-free Gaunt factor gff is derived from the relation by Leitherer & Robert (1991) with an assumed electron temperature of 10 000 K. Terminal velocity υ∞ and mean molecular weight μ are taken from our analysis (see Table 4). Assuming that helium stays ionized in the radio emitting region of the stellar wind, the mean number of electrons is set to γ = 1. Radio mass-loss rates were calculated from the radio flux at 22.5 GHz for QR 5 (WR102ea) and QR 8 (WR102d), and at 8.5 GHz for QR 4 (LHO 110). This allows the derived mass-loss rates to be compared directly with those obtained by Lang et al. (2005), but note that their original values for Ṁ, given in parenthesis in Table 4, were calculated with different assumptions on the terminal velocity and the mean molecular weight.
Mass-loss rates derived from radio free-free emission (Ṁradio), compared to those determined from the K-band spectra in the present paper (ṀIR).
For QR 5 (WR102ea) and QR 8 (WR102d) the mass-loss rates which we deduce from the radio measurements by Lang et al. (2005) are in excellent agreement with those obtained in the present paper from the K-band analysis (see Table 4). Thus, these two radio detections can be confirmed as stellar wind sources.
It has to be noted that the radio mass-loss rates quoted in Table 4 are derived for an unclumped medium (clumping contrast D = 1), while the model K-band spectra are calculated for slightly clumped winds (D = 4). Hence, the good agreement implies that the degree of clumping generally decreases from the line forming region towards the radio emitting as previously found for OB stars (Puls et al. 2006) and WR stars (Nugis et al. 1998; Liermann & Hamann 2008).
In the case of LHO 110, however, the measured radio flux is about ten times higher then expected from the Wright & Barlow (1975) model compared to the mass-loss rate derived from the K-band analysis. This might indicate that the radio emission is produced in a colliding-wind zone. On the other hand, binaries often show a non-thermal radio spectrum with a negative radio spectral index. For LHO 110, Lang et al. (2005) found a spectral index of +1.4, which is closer to the prediction of the Wright & Barlow (1975) theory for thermal wind emission (spectral index +0.6). Considering these contradictory indications, the nature of the radio emission and the binary status of LHO 110 remains unsettled.
4.3. LBV candidates?
We find two stars in our sample, WR102ea and WR102hb with very high luminosities and low terminal velocities. Their mass-loss rates are comparable to those derived for the Pistol star and FMM 362 (Najarro et al. 2009), or WR102ka (Barniske et al. 2008) thus leading to the conclusion the stars might be LBV candidate stars. For LHO 110 theslightly smaller luminosity sets the star in the HRD justbelow the Humphreys-Davidson limit adapted from Figer et al. (1998, their Fig. 12), while other Quintuplet LBV candidates are above this empirical relation (see Fig. 6). Also the very low mass-loss rate might question the LBV scenario forLHO 110, despite its spectral appearance.
Clark et al. (2005) proposed an empirical limit for LBV (candidate) stars in the quiescent state. This hot LBV minimum light strip is defined up to luminosities of log (L/L⊙) ~ 6.2 by observed LBVs and LBV candidates, but a possible extension towards higher luminosities is discussed.Further on, Clark et al. (2005) argue that LBV stars in this part of the HRD will look like WNL stars.As recently presented by Groh et al. (2009), this minimum light strip is connected to the strong-variable LBVs suspected to be fast rotators reaching their critical rotational velocity, e.g. the known strong variable LBVs AG Car and HR Car lie at this limit. In contrast slow-rotating LBV stars are assumed to be less variable. In any case, we don’t find hints in the spectra of our sample stars to be fast rotating and the question of variability cannot be settled without further observations. Still, all three stars, WR 102ea, WR 102hb, and LHO 110, are thus left in the possible LBV regime within the HRD.
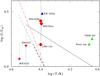 |
Fig. 6 HRD with LBV (candidate) stars in the vicinity of the Quintuplet cluster. In addition to the program stars of this paper we indicate the Pistol star and FMM 362 (parameters taken from Najarro et al. 2009) and WR 102ka (Barniske et al. 2008). The Humphreys-Davidson limit (solid line, adapted from Figer et al. 1998) is shown as well as the hot LBV minimum light strip from Clark et al. (2005, dashed, extrapolated with thin dashes to higher luminosities). Even the steeper version of this latter limit from Groh et al. (2009, dash-dotted line) puts WR 102ea, WR 102hb, LHO 110, and WR102ka to its right side, i.e. in the suggested LBV domain. |
WR102ea and WR102hb both areplaced above the evolutionary track with 120 M⊙ initial mass, see Sect. 4.4 and Fig. 7. But as described recently by Maeder et al. (2008), such massive stars might skip the LBV phase in their evolution completely.
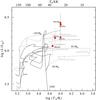 |
Fig. 7 HRD with evolutionary tracks from Meynet & Maeder (2003) for Mini of 60, 85 and 120 M⊙. The dashed lines refer to tracks without rotation, solid lines to tracks with 3ini = 300 km s-1. Symbols are for the analyzed Quintuplet WNL stars as in Fig. 5. |
4.4. Stellar evolution
The HRD with evolutionary tracks from Meynet & Maeder (2003) is shown in Fig. 7. Most sample stars lie within the tracks for solar metallicity between 60 and 120 M⊙ initial mass implying that the WN stars are descendants from the most massive O stars. The tracks without rotation (dashed lines) extend further into the cooler temperature domain than the tracks with rotation (solid lines). This might imply that the initial equatorial rotational velocity of the sample stars was smaller than the assumed 300 km s-1 in the evolutionary models. Similar results were already encountered when comparing the Galactic WN stars with the Geneva evolutionary tracks (Hamann et al. 2006). This indicates that the stellar evolution of massive stars is not yet understood fully. Two stars in the sample, WR 102hb and WR 102ea, lie above the most massive track with 120 M⊙ initial mass. We compare the stellar parameters of the stars with evolutionary tracks by Langer et al. (1994) as shown by Figer et al. (1998, Fig. 15a). Thus the initial stellar mass for these stars would be in the range 150 ≤ Minit ≤ 200 M⊙.
For those stars that can beassigned to Geneva evolutionary tracks, we estimated the age of the stars to be 2.1 to 3.6 Ma and find present-day masses of 30 to 45 M⊙. This is in agreement with masses we derive following the relation by Langer (1989), which is strictly for pure helium stars only. Considering the determined stellar temperatures and luminosities we findfrom the Geneva models that the stars are still hydrogen burning objects, in spite of their small hydrogen abundances.
5. Summary
We present the analysis offive WN9h stars in the Quintuplet cluster. K-spectra were taken from the LHO catalog and fitted with tailored Potsdam Wolf-Rayet models for expanding atmospheres (PoWR) to derive the fundamental stellar parameters. All studied stars are very luminous (log (L/L⊙) > 6.0), while their stellar temperature corresponds to their late WN subtype(T∗ ≤ 35 kK). Along with other WNL stars in the Milky Way the Quintuplet stars form a distinct group that occupies a specific region in the HRD, separate from the WNE stars. They still containa significant amount of hydrogen (up to 45% per mass) in their atmospheres and showtypical WN-like mass-loss rates.
Radio detections exist for three of our sample stars. In two cases, WR 102d (QR 8) and WR 102ea (QR 5), the radio emission agrees with the prediction for free-free emission from their stellar winds. In contrast, LHO 110 (QR 4) is much brighter in the radio than consistent with these assumptions, which possibly indicates that it might be a binary with colliding winds,although none of the sample stars has been detected in X-rays.
The two most luminous stars of our sample correspond to initial masses above 150 M⊙. The other three, less luminous stars can be compared with detailed evolutionary tracks, revealing initial massesin the range of 60 to 120 M⊙, and ages of about 2.1 − 3.6 million years. As in the case of other Galactic WN stars, the evolutionary tracks without rotation seem to fit better to thestars’ location in the empirical HRD. According to the evolutionary models, these stars are still core-hydrogen burning objects.
From the analysis of the individual stars we obtained the interstellar reddening and extinction. Based on the small sample, no extinction map could be established but an average extinction of AK = 3.1 ± 0.5 mag (AV = 27 ± 4 mag) was determined towards the Quintuplet cluster.
Acknowledgments
We are very thankful to our referee F. Najarro for his useful comments which helped to improve this manuscript. This publication makes use of data products from the Two Micron All Sky Survey, which is a joint project of the University of Massachusetts and the Infrared Processing and Analysis Center/California Institute of Technology, funded by the National Aeronautics and Space Administration and the National Science Foundation. This research has made use of the SIMBAD database, operated at CDS, Strasbourg, France. L. M. Oskinova is supported by the Deutsches Zentrum für Luft- und Raumfahrt (DLR) under grant 50 OR 0804. A. Liermann is supported by the Deutsche Forschungsgemeinschaft (DFG) under grant HA 1455/19.
References
- Barniske, A., Oskinova, L. M., & Hamann, W.-R. 2008, A&A, 486, 971 [NASA ADS] [CrossRef] [EDP Sciences] [Google Scholar]
- Blum, R. D., Schaerer, D., Pasquali, A., et al. 2001, AJ, 122, 1875 [NASA ADS] [CrossRef] [Google Scholar]
- Clark, J. S., Larionov, V. M., & Arkharov, A. 2005, A&A, 435, 239 [NASA ADS] [CrossRef] [EDP Sciences] [Google Scholar]
- Crowther, P. A. 2007, ARA&A, 45, 177 [NASA ADS] [CrossRef] [Google Scholar]
- Crowther, P. A., Smith, L. J., Hillier, D. J., & Schmutz, W. 1995, A&A, 293, 427 [NASA ADS] [Google Scholar]
- Crowther, P. A., Hadfield, L. J., Clark, J. S., Negueruela, I., & Vacca, W. D. 2006, MNRAS, 372, 1407 [NASA ADS] [CrossRef] [Google Scholar]
- Davies, B., Origlia, L., Kudritzki, R.-P., et al. 2009, ApJ, 694, 46 [NASA ADS] [CrossRef] [Google Scholar]
- Eckart, A., Moultaka, J., Viehmann, T., Straubmeier, C., & Mouawad, N. 2004, ApJ, 602, 760 [CrossRef] [Google Scholar]
- Figer, D. F., Najarro, F., Morris, M., et al. 1998, ApJ, 506, 384 [NASA ADS] [CrossRef] [Google Scholar]
- Figer, D. F., McLean, I. S., & Morris, M. 1999a, ApJ, 514, 202 [NASA ADS] [CrossRef] [Google Scholar]
- Figer, D. F., Morris, M., Geballe, T. R., et al. 1999b, ApJ, 525, 759 [NASA ADS] [CrossRef] [Google Scholar]
- Figer, D. F., Najarro, F., Gilmore, D., et al. 2002, ApJ, 581, 258 [NASA ADS] [CrossRef] [Google Scholar]
- Geballe, T. R., Najarro, F., & Figer, D. F. 2000, ApJ, 530, L97 [NASA ADS] [CrossRef] [PubMed] [Google Scholar]
- Gräfener, G., & Hamann, W.-R. 2005, A&A, 432, 633 [NASA ADS] [CrossRef] [EDP Sciences] [Google Scholar]
- Gräfener, G., & Hamann, W.-R. 2008, A&A, 482, 945 [NASA ADS] [CrossRef] [EDP Sciences] [Google Scholar]
- Gräfener, G., Koesterke, L., & Hamann, W.-R. 2002, A&A, 387, 244 [NASA ADS] [CrossRef] [EDP Sciences] [Google Scholar]
- Groh, J. H., Damineli, A., Hillier, D. J., et al. 2009, ApJ, 705, L25 [NASA ADS] [CrossRef] [Google Scholar]
- Hamann, W., Duennebeil, G., Koesterke, L., Wessolowski, U., & Schmutz, W. 1991, A&A, 249, 443 [NASA ADS] [Google Scholar]
- Hamann, W.-R., & Gräfener, G. 2004, A&A, 427, 697 [NASA ADS] [CrossRef] [EDP Sciences] [Google Scholar]
- Hamann, W.-R., Gräfener, G., & Liermann, A. 2006, A&A, 457, 1015 [NASA ADS] [CrossRef] [EDP Sciences] [Google Scholar]
- Hillier, D. J., & Miller, D. L. 1998, ApJ, 496, 407 [NASA ADS] [CrossRef] [Google Scholar]
- Krabbe, A., Genzel, R., Drapatz, S., & Rotaciuc, V. 1991, ApJ, 382, L19 [NASA ADS] [CrossRef] [Google Scholar]
- Krabbe, A., Genzel, R., Eckart, A., et al. 1995, ApJ, 447, L95 [NASA ADS] [CrossRef] [Google Scholar]
- Lang, C. C., Johnson, K. E., Goss, W. M., & Rodríguez, L. F. 2005, AJ, 130, 2185 [Google Scholar]
- Langer, N. 1989, A&A, 210, 93 [NASA ADS] [Google Scholar]
- Langer, N., Hamann, W.-R., Lennon, M., et al. 1994, A&A, 290, 819 [NASA ADS] [Google Scholar]
- Leitherer, C., & Robert, C. 1991, ApJ, 377, 629 [NASA ADS] [CrossRef] [Google Scholar]
- Liermann, A., & Hamann, W.-R. 2008, in Clumping in Hot-Star Winds, ed. W.-R. Hamann, A. Feldmeier, & L. M. Oskinova, 247 [Google Scholar]
- Liermann, A., Hamann, W.-R., & Oskinova, L. M. 2009, A&A, 494, 1137 [NASA ADS] [CrossRef] [EDP Sciences] [Google Scholar]
- Maeder, A., Meynet, G., Ekström, S., Hirschi, R., & Georgy, C. 2008, in IAU Symp., 250, 3 [Google Scholar]
- Martins, F., Genzel, R., Hillier, D. J., et al. 2007, A&A, 468, 233 [NASA ADS] [CrossRef] [EDP Sciences] [Google Scholar]
- Martins, F., Hillier, D. J., Paumard, T., et al. 2008, A&A, 478, 219 [NASA ADS] [CrossRef] [EDP Sciences] [Google Scholar]
- Meynet, G., & Maeder, A. 2003, A&A, 404, 975 [NASA ADS] [CrossRef] [EDP Sciences] [Google Scholar]
- Moneti, A., Stolovy, S., Blommaert, J. A. D. L., Figer, D. F., & Najarro, F. 2001, A&A, 366, 106 [NASA ADS] [CrossRef] [EDP Sciences] [Google Scholar]
- Najarro, F., Hillier, D. J., Kudritzki, R. P., et al. 1994, A&A, 285, 573 [NASA ADS] [Google Scholar]
- Najarro, F., Krabbe, A., Genzel, R., et al. 1997, A&A, 325, 700 [NASA ADS] [Google Scholar]
- Najarro, F., Figer, D. F., Hillier, D. J., & Kudritzki, R. P. 2004, ApJ, 611, L105 [NASA ADS] [CrossRef] [Google Scholar]
- Najarro, F., Figer, D. F., Hillier, D. J., Geballe, T. R., & Kudritzki, R. P. 2009, ApJ, 691, 1816 [NASA ADS] [CrossRef] [Google Scholar]
- Nugis, T., & Lamers, H. J. G. L. M. 2000, A&A, 360, 227 [NASA ADS] [Google Scholar]
- Nugis, T., Crowther, P. A., & Willis, A. J. 1998, A&A, 333, 956 [NASA ADS] [Google Scholar]
- Oskinova, L. M. 2005, MNRAS, 361, 679 [NASA ADS] [CrossRef] [Google Scholar]
- Paumard, T., Genzel, R., Martins, F., et al. 2006, ApJ, 643, 1011 [NASA ADS] [CrossRef] [Google Scholar]
- Puls, J., Markova, N., Scuderi, S., et al. 2006, A&A, 454, 625 [NASA ADS] [CrossRef] [EDP Sciences] [Google Scholar]
- Reid, M. J. 1993, ARA&A, 31, 345 [NASA ADS] [CrossRef] [Google Scholar]
- Schmutz, W., Hamann, W.-R., & Wessolowski, U. 1989, A&A, 210, 236 [NASA ADS] [Google Scholar]
- Skrutskie, M. F., Cutri, R. M., Stiening, R., et al. 2006, AJ, 131, 1163 [NASA ADS] [CrossRef] [Google Scholar]
- Smith, L. F. 1968, MNRAS, 140, 409 [NASA ADS] [Google Scholar]
- Smith, N., & Conti, P. S. 2008, ApJ, 679, 1467 [NASA ADS] [CrossRef] [Google Scholar]
- Tuthill, P., Monnier, J., Tanner, A., et al. 2006, Science, 313, 935 [NASA ADS] [CrossRef] [PubMed] [Google Scholar]
- van der Hucht, K. A. 2001, VizieR Online Data Catalog, 3215, [Google Scholar]
- Wang, Q. D., Dong, H., & Lang, C. 2006, MNRAS, 371, 38 [NASA ADS] [CrossRef] [Google Scholar]
- Wright, A. E., & Barlow, M. J. 1975, MNRAS, 170, 41 [NASA ADS] [CrossRef] [Google Scholar]
All Tables
Extinction derived from fitting the model SEDs, applying the reddening law of Moneti et al. (2001) in the infrared range.
Mass-loss rates derived from radio free-free emission (Ṁradio), compared to those determined from the K-band spectra in the present paper (ṀIR).
All Figures
|
Fig. 1 Spectral energy distributions for the sample stars. Blocks with labels indicate the 2MASS magnitudes for the J-, H- and Ks-band (dark blue boxes), as well as the LHO Ks magnitude (light blue box). The solid line is the flux-calibrated LHO spectrum while the dotted line refers to the reddened model continuum. |
| In the text | |
|
Fig. 2 Spectral fits for the sample stars. Observed spectra (blue solid line) are normalized using their reddened model continuum, the normalized model spectrum is overlayed (red dotted lines). The observed spectra are corrected for radial velocities according to Table 2 in the LHO catalog. |
| In the text | |
|
Fig. 3 Normalized line spectrum of WR 102d showing the Brγ/He i/He ii blend (blue solid line) with the best fitting model (red dotted line). For comparison we plot modelswith 20% (green dash-dotted line) and 10% (black dashed line) hydrogen by mass but otherwise identical parameters. |
| In the text | |
|
Fig. 4 Mass-loss rate versus stellar luminosity for the sample stars. For comparison we show Arches WNL stars from Martins et al. (2008, labeled with F and B numbers), WR102c and WR102ka from Barniske et al. (2008) and Galactic WN stars (Hamann et al. 2006, open symbols). The solid lines refer to the mass loss-luminosity relation of Nugis & Lamers (2000) for hydrogen-free stars (green upper line) and stars containing 40% hydrogen per mass (red lower line). |
| In the text | |
|
Fig. 5 HRD showing the analyzed WN9h stars (red filled symbols). For comparison we plotsingle Galactic WN stars from Hamann et al. (2006) (open symbols), WNL stars of the Arches cluster from Martins et al. (2008, labeled with F and B numbers), and WR102c and WR102ka from Barniske et al. (2008). Different symbols refer to different spectral subtypes, cf. inset. Hydrogen and helium zero-age main-sequence are given as solid lines. |
| In the text | |
|
Fig. 6 HRD with LBV (candidate) stars in the vicinity of the Quintuplet cluster. In addition to the program stars of this paper we indicate the Pistol star and FMM 362 (parameters taken from Najarro et al. 2009) and WR 102ka (Barniske et al. 2008). The Humphreys-Davidson limit (solid line, adapted from Figer et al. 1998) is shown as well as the hot LBV minimum light strip from Clark et al. (2005, dashed, extrapolated with thin dashes to higher luminosities). Even the steeper version of this latter limit from Groh et al. (2009, dash-dotted line) puts WR 102ea, WR 102hb, LHO 110, and WR102ka to its right side, i.e. in the suggested LBV domain. |
| In the text | |
|
Fig. 7 HRD with evolutionary tracks from Meynet & Maeder (2003) for Mini of 60, 85 and 120 M⊙. The dashed lines refer to tracks without rotation, solid lines to tracks with 3ini = 300 km s-1. Symbols are for the analyzed Quintuplet WNL stars as in Fig. 5. |
| In the text | |
Current usage metrics show cumulative count of Article Views (full-text article views including HTML views, PDF and ePub downloads, according to the available data) and Abstracts Views on Vision4Press platform.
Data correspond to usage on the plateform after 2015. The current usage metrics is available 48-96 hours after online publication and is updated daily on week days.
Initial download of the metrics may take a while.