Free Access
Fig. 2
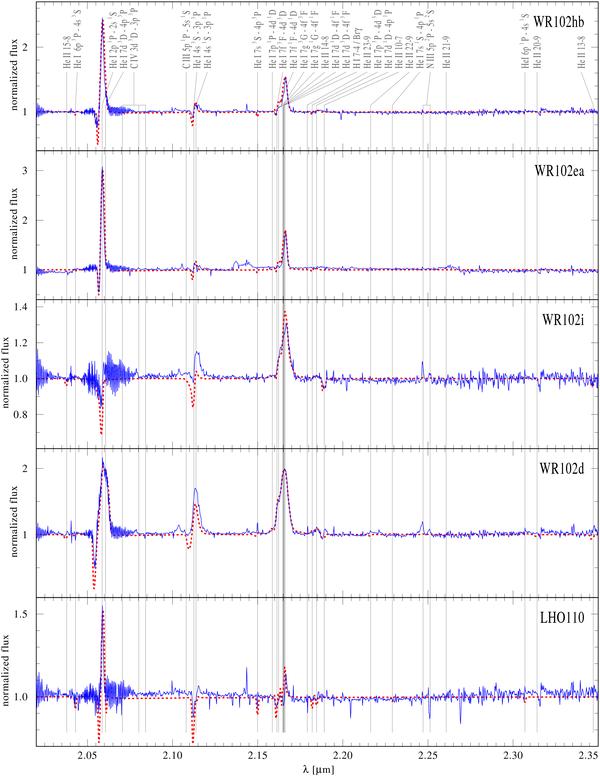
Spectral fits for the sample stars. Observed spectra (blue solid line) are normalized using their reddened model continuum, the normalized model spectrum is overlayed (red dotted lines). The observed spectra are corrected for radial velocities according to Table 2 in the LHO catalog.
Current usage metrics show cumulative count of Article Views (full-text article views including HTML views, PDF and ePub downloads, according to the available data) and Abstracts Views on Vision4Press platform.
Data correspond to usage on the plateform after 2015. The current usage metrics is available 48-96 hours after online publication and is updated daily on week days.
Initial download of the metrics may take a while.