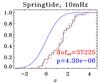
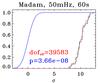
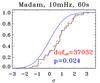
Fig. 8
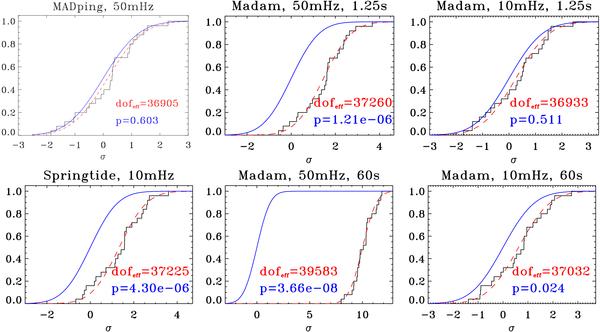
Empirical χ2 distribution functions from the 25
residual noise maps compared with the theoretical cumulative probability density.
The black stair line is the empirical distribution function, the blue solid line
is the theoretical χ2 distribution for
3Npix − 1 = 36863 degrees of freedom. The red dashed
line is the least squares fit of the χ2 distribution
to the experimental distribution (d.o.f. being the fitting parameter). The
horizontal axis is translated to the expected center of the distribution,
⟨ χ2 ⟩ = d.o.f. = 36,863,
and scaled by the expected deviation, 
Current usage metrics show cumulative count of Article Views (full-text article views including HTML views, PDF and ePub downloads, according to the available data) and Abstracts Views on Vision4Press platform.
Data correspond to usage on the plateform after 2015. The current usage metrics is available 48-96 hours after online publication and is updated daily on week days.
Initial download of the metrics may take a while.