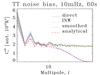
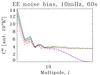
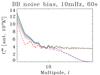
Fig. A.1
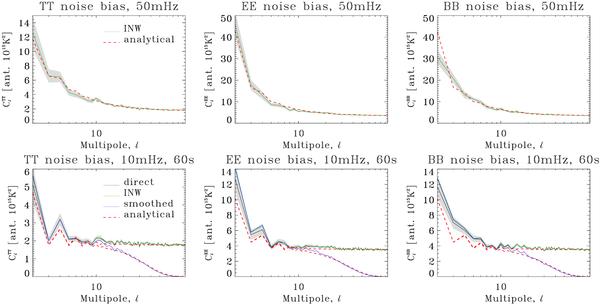
Analytical and mean Monte Carlo noise biases. Gray band is the 1-σ
region for the average, computed by dividing the sample variance
by  .
Like the TE, TB and EB biases are both consistent with zero and are not shown here.
The analytical bias corresponds to the unsmoothed case presented in Sect. 6.3. Top row: MADmap runs with
fknee = 50 mHz. Bottom row: Madam
runs with fknee = 10mHz.
.
Like the TE, TB and EB biases are both consistent with zero and are not shown here.
The analytical bias corresponds to the unsmoothed case presented in Sect. 6.3. Top row: MADmap runs with
fknee = 50 mHz. Bottom row: Madam
runs with fknee = 10mHz.
Current usage metrics show cumulative count of Article Views (full-text article views including HTML views, PDF and ePub downloads, according to the available data) and Abstracts Views on Vision4Press platform.
Data correspond to usage on the plateform after 2015. The current usage metrics is available 48-96 hours after online publication and is updated daily on week days.
Initial download of the metrics may take a while.