| Issue |
A&A
Volume 519, September 2010
|
|
|---|---|---|
| Article Number | A67 | |
| Number of page(s) | 11 | |
| Section | Extragalactic astronomy | |
| DOI | https://doi.org/10.1051/0004-6361/201014073 | |
| Published online | 14 September 2010 | |
Submillimeter to centimeter excess emission from the Magellanic Clouds
I. Global spectral energy distribution
F. P. Israel1 - W. F. Wall2 - D. Raban1 - W. T. Reach3 - C. Bot4 - J. B. R. Oonk1 - N. Ysard5 - J. P. Bernard6
1 - Sterrewacht Leiden, Leiden University, PO Box 9513, 2300 RA Leiden,
The Netherlands
2 - Instituto Nacional de Astrofísica, Óptica, y Electrónica, Apdo.
Postal 51 y 216, Puebla, Pue., México
3 - Spitzer Science Center, California Institute of Technology,
Pasadena, CA, USA
4 - UMR 7550, Observatoire Astronomique de Strasbourg, Université Louis
Pasteur, 67000 Strasbourg, France
5 - Department of Physics, PO Box 64, 00014 University of Helsinki,
Finland
6 - Université de Toulouse, UPS, CESR, 31028 Toulouse, France
Received 15 January 2010 / Accepted 14 May 2010
Abstract
Aims. Our goal is to determine and study the global
emission from the Magellanic Clouds over the full radio to ultraviolet
spectral range.
Methods. We have selected from the literature those
flux densities that include the entire LMC and SMC respectively, and we
have complemented these with maps extracted from the WMAP and COBE
databases covering the missing 23-90 GHz (13-3.2 mm)
and the poorly sampled 1.25-250 THz (240-1.25 ![]() m) spectral
ranges in order to reconstruct the global SEDs of the Magellanic Clouds
over eight decades in frequency or wavelength.
m) spectral
ranges in order to reconstruct the global SEDs of the Magellanic Clouds
over eight decades in frequency or wavelength.
Results. A major result is the discovery of a
pronounced excess of emission from the Magellanic Clouds at millimeter
and submillimeter wavelengths. We also confirm global mid-infrared
(12 ![]() m)
emission suppression, and determine accurate thermal radio fluxes and
very low global extinctions for both LMC and SMC, the latter being the
most extreme in all these respects.
m)
emission suppression, and determine accurate thermal radio fluxes and
very low global extinctions for both LMC and SMC, the latter being the
most extreme in all these respects.
Conclusions. These and other dust properties such as
the far-UV extinction curve appear to be correlated with (low)
metallicity. Possible explanations are briefly considered. As long as
the nature of the excess emission is unknown, the total dust masses and
gas-to-dust ratios of the Magellanic Clouds cannot reliably be
determined
Key words: submillimeter: galaxies - radio continuum: galaxies - infrared: galaxies - Magellanic Clouds - galaxies: individual: Magellanic Clouds - dust, extinction
1 Introduction
The global spectral energy distribution (SED) of entire galaxies
provides an important tool to study global properties, such as star
formation activity, ISM heating and cooling balance, extinction and
dust content. Understanding the SEDs of nearby galaxies is essential
to the interpretation of measurements of very distant galaxies.
Especially important galaxies to study are the Large Magellanic Cloud
(LMC) and the Small Magellanic Cloud (SMC), the southern hemisphere
Milky Way satellites. They are so close (LMC: D =
50 kpc, SMC: D = 63 kpc) that we
can study them in exhaustive detail allowing us to relate
global to local properties. However, their very proximity gives them
very large angular extent (LMC: 8![]() ,
SMC: 2
,
SMC: 2![]() ),
so
that global flux densities have been determined only in the relatively
recent past, and over limited wavelength ranges. Particularly lacking
is coverage over a broad spectral range from the far infrared
(typically 2-3 THz or 0.10-0.14 mm) to the radio
regime (typically
5-10 GHz or 3-6 cm). This includes the mm/submm wave
region that may
reveal unique information on properties and emission mechanisms of
dust as well the thermal free-free emission from ionised gas resulting
from the star formation process.
),
so
that global flux densities have been determined only in the relatively
recent past, and over limited wavelength ranges. Particularly lacking
is coverage over a broad spectral range from the far infrared
(typically 2-3 THz or 0.10-0.14 mm) to the radio
regime (typically
5-10 GHz or 3-6 cm). This includes the mm/submm wave
region that may
reveal unique information on properties and emission mechanisms of
dust as well the thermal free-free emission from ionised gas resulting
from the star formation process.
Emission in this spectral range all but requires observatories in space for its measurement. The all-sky surveys by the cosmological satellites WMAP and COBE provide a unique opportunity to acquire the missing information and complement existing data. In this paper, we have used the COBE and WMAP archive databases to extract maps and globally integrated flux densities for the Clouds. As we will describe below, this resulted, among other things, in the surprising discovery of a significant excess of emission from the Magellanic Clouds at millimeter and submillimeter wavelengths.
Table 1: Global emission from LMC and SMC.
2 WMAP and COBE maps of the Magellanic Clouds
2.1 WMAP data
The WMAP mission and its data products have been described in detail
by Bennett et al. (2003a,b,c).
For our analysis of the Magellanic
Clouds, as in the case of Centaurus A (Israel et al. 2008), we used
the reduced and calibrated Stokes I maps of the entire sky
from the
official WMAP 5-year release (Hinshaw et al. 2009). The maps
were
observed at frequencies ![]() ,
32.7, 40.6, 60.7, and 93.1 GHz
with resolutions of 53, 40, 31, 21, and 13 arc-min
respectively. The
HEALPIX data maps were converted to flat maps in Zenithal Equal Area
projection with pixel solid angles of
,
32.7, 40.6, 60.7, and 93.1 GHz
with resolutions of 53, 40, 31, 21, and 13 arc-min
respectively. The
HEALPIX data maps were converted to flat maps in Zenithal Equal Area
projection with pixel solid angles of
![]() sr
and intensities in mK. We
integrated over the full extent of the LMC and the SMC and determined
the flux densities given in Table 1 from the summed
values with conversion factors Jy/mK = 30.7
sr
and intensities in mK. We
integrated over the full extent of the LMC and the SMC and determined
the flux densities given in Table 1 from the summed
values with conversion factors Jy/mK = 30.7 ![]() p(o)
p(o) ![]()
![]() .
In the case of the SMC, we took care to exclude the patch
of Milky Way foreground emission at position
-2
.
In the case of the SMC, we took care to exclude the patch
of Milky Way foreground emission at position
-2![]() ,
+1.5
,
+1.5![]() in Fig. 1.
In order to find
large-scale regional differences, we also determined flux densities
for sub-regions of the Magellanic Clouds, including the
30 Doradus
region in the LMC, and the SMC Wing; they are listed in
Table 2.
The errors quoted are much larger than the
formal errors in the integrated flux densities, because we took into
account the uncertainty in the required integration area and the
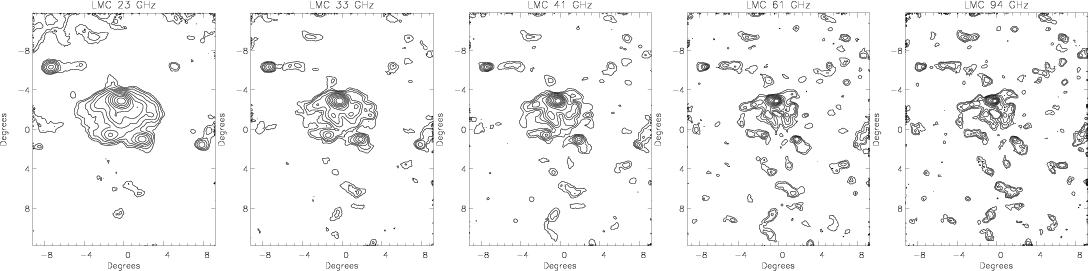
uncertainty in the Milky Way foreground contribution. The maps of
both Clouds are shown in Figs. 1 and 2 to illustrate noise
and
confusion levels.
in Fig. 1.
In order to find
large-scale regional differences, we also determined flux densities
for sub-regions of the Magellanic Clouds, including the
30 Doradus
region in the LMC, and the SMC Wing; they are listed in
Table 2.
The errors quoted are much larger than the
formal errors in the integrated flux densities, because we took into
account the uncertainty in the required integration area and the
uncertainty in the Milky Way foreground contribution. The maps of
both Clouds are shown in Figs. 1 and 2 to illustrate noise
and
confusion levels.
2.2 COBE data
The COBE satellite was launched in 1989 to measure the diffuse infrared and microwave radiation from the early universe (Boggess et al. 1992). It carried three instruments, a diffuse infrared background experiment (DIRBE), a differential microwave radiometer (DMR), and a far infrared absolute spectrophotometer (FIRAS).
2.2.1 DIRBE
The DIRBE experiment mapped the sky at wavelengths of 1.25 (J),
2.20
(K) 3.5 (L) 4.9 (M),
12, 25, 60, 100, 140, and 240 ![]() m with a
m with a
![]() beam (Silverberg
et al. 1993;
see also
Wall et al. 1996).
We extracted map data in Galactic coordinates for the parts
of the sky containing the LMC and the SMC, respectively, and reversed
both longitude and latitude directions in order to obtain images
corresponding to the sky distribution. On the LMC and the SMC, we
extracted cubes of
beam (Silverberg
et al. 1993;
see also
Wall et al. 1996).
We extracted map data in Galactic coordinates for the parts
of the sky containing the LMC and the SMC, respectively, and reversed
both longitude and latitude directions in order to obtain images
corresponding to the sky distribution. On the LMC and the SMC, we
extracted cubes of ![]() and
and ![]() pixels in extent,
respectively. Each pixel is 0.3 degrees in size. These fields
were
chosen because they are centred on the lowest believable contour in
the 100
pixels in extent,
respectively. Each pixel is 0.3 degrees in size. These fields
were
chosen because they are centred on the lowest believable contour in
the 100 ![]() m
maps. In each map, we subtracted both unrelated
(stellar) point sources and a smoothed background. Flux densities,
determined by integrating over the relevant map areas, are listed in
Tables 1
and 3.
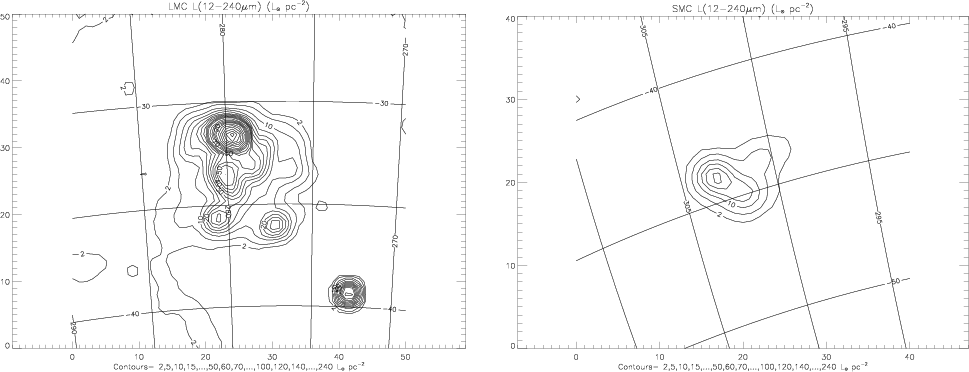
Figure 3
shows the distribution of infrared luminosity
over the LMC and SMC, as derived from integrating over all DIRBE
channels, and also serves a reference for the positions listed in
Table 3.
Individual channel maps are not shown
here
m
maps. In each map, we subtracted both unrelated
(stellar) point sources and a smoothed background. Flux densities,
determined by integrating over the relevant map areas, are listed in
Tables 1
and 3.
Figure 3
shows the distribution of infrared luminosity
over the LMC and SMC, as derived from integrating over all DIRBE
channels, and also serves a reference for the positions listed in
Table 3.
Individual channel maps are not shown
here![]() .
The quoted errors are dominated by calibration uncertainties and are
significantly larger than the formal random errors.
.
The quoted errors are dominated by calibration uncertainties and are
significantly larger than the formal random errors.
2.2.2 FIRAS
The FIRAS experiment was designed for precise measurements of the
cosmic microwave background spectrum and to observe the dust and line
emission from the Galaxy. It covered the wavelength range
from 0.1 to
10 mm in two spectral channels and had approximately 5![]() spectral
resolution and a 7
spectral
resolution and a 7![]() field of view (Wright et al. 1991; Fixsen
et al. 1994,
1997). We
extracted a continuum spectrum of the LMC, the
SMC being too weak. Because the LMC was only marginally resolved by
FIRAS, we averaged the spectrum over all pixels within
6 degrees of
galactic coordinates (280.47, -32.89). From this, we subtracted an OFF
spectrum that was the average of pixels in the annulus from 7
to 12 degrees from the center. We do not list the results for
the individual
204 spectral points, but they are shown in Fig. 4.
field of view (Wright et al. 1991; Fixsen
et al. 1994,
1997). We
extracted a continuum spectrum of the LMC, the
SMC being too weak. Because the LMC was only marginally resolved by
FIRAS, we averaged the spectrum over all pixels within
6 degrees of
galactic coordinates (280.47, -32.89). From this, we subtracted an OFF
spectrum that was the average of pixels in the annulus from 7
to 12 degrees from the center. We do not list the results for
the individual
204 spectral points, but they are shown in Fig. 4.
Table 2: WMAP peak flux densities in the Magellanic Clouds.
Table 3: COBE-DIRBE peak flux densities in the Magellanic Clouds.
|
Figure 1: Maps of the radio continuum emission of the LMC at ( left to right) 23, 33, 41 GHz, 61 GHz, and 94 GHz. All images are at the nominal WMAP resolution, and in Galactic coordinates centered on l=279.70, b=-35.10. Equatorial North is at right. Contour levels are drawn at (23 GHz) 0.1, 0.19, 0.38, 0.74, 1.4, 2.8, 5.5, 10.7 mK, (33 GHz) 0.1, 0.19, 0.36, 0.68, 1.3, 2.4, 4.6 mK; (41 GHz) 0.1, 0.19, 0.34, 0.64, 1.2, 2.2, 4.1, 7.6 mK; (61 GHz) 0.1, 0.17, 0.31, 0.53, 0.94, 1.6, 2.9, 5.0 mK; (93 GHz) 0.1, 0.16, 0.25, 0.40 0.64 1.0, 1.6, 2.6 mK. |
| Open with DEXTER | |
| Figure 2: Maps of the radio continuum emission of the SMC at ( left to right) 23, 33, 41 GHz, 61 GHz, and 94 GHz. All images are at the nominal WMAP resolution. Images are in Galactic coordinates, centered on l=302.00, b=-44.97, and therefore appear ``upside-down''; equatorial North is at bottom. Contour levels are drawn at (23 GHz) 0.1, 0.19, 0.38, 0.74, 1.4, 2.8, 5.5, 10.7 mK, (33 GHz) 0.1, 0.19, 0.36, 0.68, 1.3, 2.4, 4.6 mK; (41 GHz) 0.1, 0.19, 0.34, 0.64, 1.2, 2.2, 4.1, 7.6 mK; (61 GHz) 0.1, 0.17, 0.31, 0.53, 0.94, 1.6, 2.9, 5.0 mK; (93 GHz) 0.1, 0.16, 0.25, 0.40 0.64 1.0, 1.6, 2.6 mK. |
|
| Open with DEXTER | |
|
Figure 3:
Total infrared luminosity maps from DIRBE measurements. Contours are
marked in units of |
| Open with DEXTER | |
2.3 Literature data
We have used the IPAC NED as a guide to find LMC and SMC global flux densities over a wide frequency range in the published literature. The NED compilation should be used with care, as it is not complete and also includes values of limited spatial coverage often significantly underestimating total flux densities. Consequently, we also searched the recent literature, and in all cases took care to select only those flux densities that (a) were reliably determined, and (b) correspond to the entire galaxy, not just the brightest region.
In addition to the integrated optical flux densities ![]() ,
,
![]() ,
and
,
and ![]() (i.e. not corrected for extinction) from the Third
Reference Catalog of Bright Galaxies, (RC 3 - de Vaucouleurs
et al. 1991),
we have used radio data obtained or collected by Loiseau
et al. (1987),
Mountfort et al. (1987),
Alvarez et al. (1987,
1989),
Klein et al. (1989),
Ye & Turtle (1991),
and Haynes et al. (1991).
Infrared and submillimeter continuum data were taken from Schwering
(1988),
Rice et al. (1988),
Stanimirovic et al. (2000),
Aguirre et al. (2003),
Wilke et al. (2004),
Hughes et al. (2006),
Bolatto et al. (2007),
and Leroy et al. (2007).
The ultraviolet data of the LMC
are those of Page & Carruthers (1981). All data used
are listed in
the on-line Appendix.
(i.e. not corrected for extinction) from the Third
Reference Catalog of Bright Galaxies, (RC 3 - de Vaucouleurs
et al. 1991),
we have used radio data obtained or collected by Loiseau
et al. (1987),
Mountfort et al. (1987),
Alvarez et al. (1987,
1989),
Klein et al. (1989),
Ye & Turtle (1991),
and Haynes et al. (1991).
Infrared and submillimeter continuum data were taken from Schwering
(1988),
Rice et al. (1988),
Stanimirovic et al. (2000),
Aguirre et al. (2003),
Wilke et al. (2004),
Hughes et al. (2006),
Bolatto et al. (2007),
and Leroy et al. (2007).
The ultraviolet data of the LMC
are those of Page & Carruthers (1981). All data used
are listed in
the on-line Appendix.
Comparing the Magellanic Cloud measurements from the WMAP and the DIRBE surveys (Table 1) with published results from other spacecraft (IRAS, ISO, Spitzer) surveys, we note that the infrared peak intensities measured by the COBE-DIRBE experiment for the SMC are very close to these, but somewhat higher for the LMC. As the large extent of the LMC renders its measurement with relatively small beams more sensitive to base-level uncertainties, we prefer the low-resolution DIRBE flux-densities. The radio continuum spectrum is uncertain below 200 MHz, but well-defined at the higher frequencies. The high-frequency radio continuum measurements agree well with the results from WMAP.
2.4 Comparison galaxies
In the following, we will compare the Magellanic Cloud results to those of other galaxies. However, there are very few galaxies whose emission in the submillimeter to centimeter wavelength range has been sampled with a sufficient degree of accuracy and completeness. A more or less exhaustive sample consists of the starburst (SB) disk galaxies NGC 253, M 82, and NGC 4945 (also measured by WMAP, see Chen & Wright 2009), the (ultra)luminous infrared galaxies (ULIRG) Arp 220, Mk 231, NGC 3690, and NGC 6240, and the star-forming blue compact dwarf (BCDG) galaxies He 2-10, 2Zw40, NGC 4194, and NGC 5253. The SEDs of these three groups of galaxies will be discussed in more detail in a forthcoming paper.
|
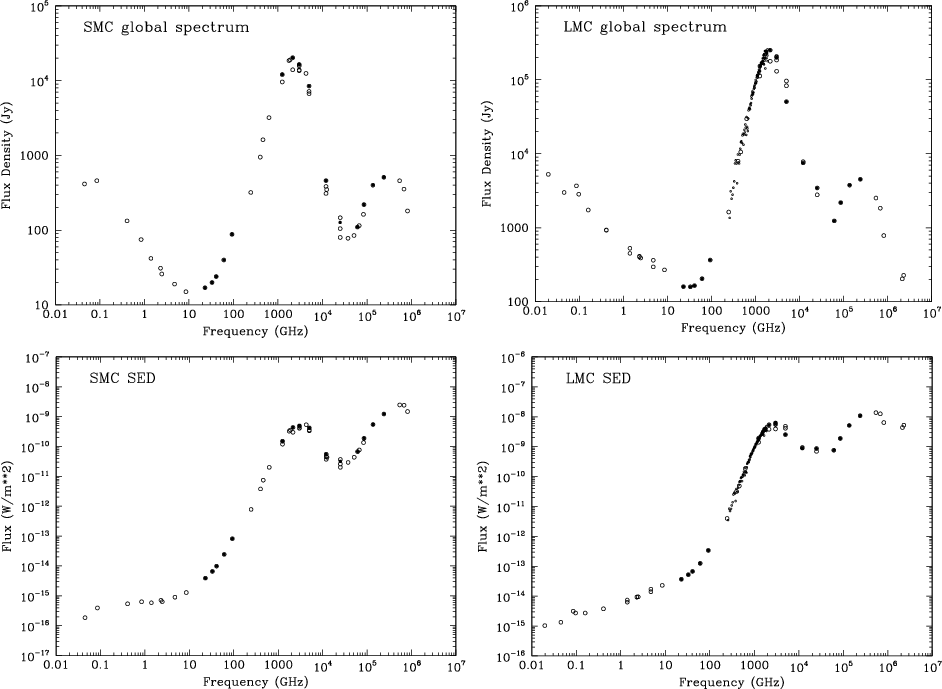
Figure 4:
Top: global (area-integrated) continuum
spectrum from low-frequency radio to the ultraviolet. Filled circles
represent integrated flux densities in Jansky from Table 1, open circles
were taken from the literature (see text). Bottom:
corresponding global flux (proportional to power) distribution |
| Open with DEXTER | |
3 Results and analysis
3.1 Mid-infrared excess emission
|
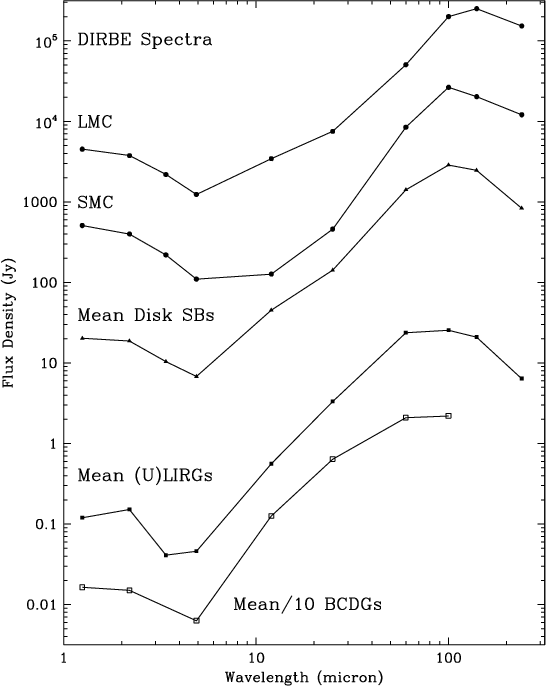
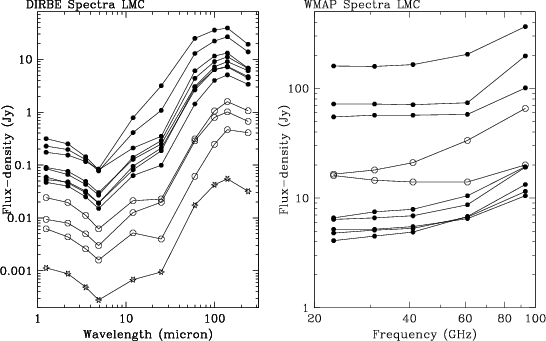
Figure 5:
Near- to far-infrared spectra of the LMC and the SMC, compared to a
sample of star-burst galaxies taken from the DIRBE point source catalog
by Smith et al. (2004)
and data tabulated by Hunt et al. (2005). Most of the
galaxies exhibit a clear 12 |
| Open with DEXTER | |
|
Figure 6: COBE-DIRBE spectra of the LMC sub-regions from Table 3. For the sake of clarity, we have divided the spectra (open circles) of LMC regions 3 (Dor Ridge), 5, and 10 (N 48) by five, and that of LMC region 4 (N 206; open stars) by a hundred. Right: WMAP spectra of the LMC sub-regions (from Table 2). The spectra of the northern source N 48 and the southern object N 206, representing the most extreme cases, have been multiplied by five and are indicated by open circles. |
| Open with DEXTER | |
From the observed flux density distributions we have determined the
mid-infrared excess emission in the 12 ![]() m broadband by logarithmic
interpolation between the observed 4.9
m broadband by logarithmic
interpolation between the observed 4.9 ![]() and 25
and 25 ![]() flux densities
(S12/S12',
with log S12'
= 0.56 log S25 + 0.44
log S5). Although
more precise spectroscopy and photometry has
been provided by e.g. the Spitzer Space Observatory (see for instance
Draine et al. 2007;
Bernard et al. 2008),
we include here a brief
discussion of the DIRBE data because they allow us to compare the
integrated and large scale properties of the Magellanic Clouds to
those of other galaxies. Figure 5 shows that there
is no
mid-infrared excess in the SMC probably due to decreasing PAH
strengths (see e.g. Bolatto et al. 2007). Compared
to other galaxies
there is only a weak excess in the LMC. The sub-regions of the LMC
shown in Fig. 6
reveal the 12
flux densities
(S12/S12',
with log S12'
= 0.56 log S25 + 0.44
log S5). Although
more precise spectroscopy and photometry has
been provided by e.g. the Spitzer Space Observatory (see for instance
Draine et al. 2007;
Bernard et al. 2008),
we include here a brief
discussion of the DIRBE data because they allow us to compare the
integrated and large scale properties of the Magellanic Clouds to
those of other galaxies. Figure 5 shows that there
is no
mid-infrared excess in the SMC probably due to decreasing PAH
strengths (see e.g. Bolatto et al. 2007). Compared
to other galaxies
there is only a weak excess in the LMC. The sub-regions of the LMC
shown in Fig. 6
reveal the 12 ![]() m
excess to cover a
modest but non-negligible range. Low metallicities, hard radiation
fields, and strong shocks may destroy the (8
m
excess to cover a
modest but non-negligible range. Low metallicities, hard radiation
fields, and strong shocks may destroy the (8 ![]() m emitting
ionised)
PAHs in all but the best-shielded locations (Engelbracht
et al. 2005;
Micelotta 2009).
However, the 12
m emitting
ionised)
PAHs in all but the best-shielded locations (Engelbracht
et al. 2005;
Micelotta 2009).
However, the 12 ![]() m
excess may also be related to
the presence or absence of very small grains - see, for instance, the
mid-infrared emission studies of the LMC by Sakon et al. (2006) and by
Bernard et al. (2008).
Figure 7
shows that the
mid-infrared excess is anti-correlated with the
energy density
of the radiation field as represented by the 100
m
excess may also be related to
the presence or absence of very small grains - see, for instance, the
mid-infrared emission studies of the LMC by Sakon et al. (2006) and by
Bernard et al. (2008).
Figure 7
shows that the
mid-infrared excess is anti-correlated with the
energy density
of the radiation field as represented by the 100 ![]() m/140
m/140 ![]() m flux
density ratio (consistent with conclusions by Beirão et al. (2006)
from NGC 5253 Spitzer data). The coolest LMC regions in
Fig. 7
(numbers 3 and 5 in Table 3)
have the highest 12
m flux
density ratio (consistent with conclusions by Beirão et al. (2006)
from NGC 5253 Spitzer data). The coolest LMC regions in
Fig. 7
(numbers 3 and 5 in Table 3)
have the highest 12 ![]() m
excess. As the low-metallicity SMC points
and the solar-metallicity galaxy points straddle the intermediate
metallicity LMC points, it appears that the mid-infrared excess is
proportional to metallicity in addition to being inversely
proportional to the radiation field.
m
excess. As the low-metallicity SMC points
and the solar-metallicity galaxy points straddle the intermediate
metallicity LMC points, it appears that the mid-infrared excess is
proportional to metallicity in addition to being inversely
proportional to the radiation field.
3.2 Radio spectrum and extinction
3.2.1 Thermal radio contribution
The LMC and SMC spectra in Figs. 4 and 6 both show a smooth transition from the radio to the infrared with a broad minimum at 20-40 GHz (8-15 mm wavelength) occurring as thermal emission from ionised gas becomes important before the thermal emission from heated dust starts to dominate the energy distribution.The LMC and SMC radio spectra have spectral indices in the
0.1-5.0 GHz frequency range
![]() and
and
![]() respectively
(Alvarez et al. 1987,
1989;
Loiseau et al. 1987;
Klein et al. 1989;
Haynes et al. 1991)
with
respectively
(Alvarez et al. 1987,
1989;
Loiseau et al. 1987;
Klein et al. 1989;
Haynes et al. 1991)
with
![]() .
Such values suggest significant
thermal contributions at the highest observed frequencies, but these
have been difficult to determine accurately because observations were
limited to the spectral range dominated by the non-thermal component.
The integrated H
.
Such values suggest significant
thermal contributions at the highest observed frequencies, but these
have been difficult to determine accurately because observations were
limited to the spectral range dominated by the non-thermal component.
The integrated H![]() fluxes
measured by Kennicutt et al. (1995)
together with average foreground extinctions
fluxes
measured by Kennicutt et al. (1995)
together with average foreground extinctions
![]() mag
and
mag
and ![]() mag
(Schlegel et al. 1998)
place lower limits on the thermal contributions of
mag
(Schlegel et al. 1998)
place lower limits on the thermal contributions of
![]() Jy
and
Jy
and ![]() Jy.
The
spectra presented in Fig. 4
show that these lower limits
are close to the observed total (thermal and non-thermal) flux
densities
Jy.
The
spectra presented in Fig. 4
show that these lower limits
are close to the observed total (thermal and non-thermal) flux
densities
![]() Jy
and
Jy
and ![]() Jy.
Jy.
The present data allow us to separate with very high accuracy
the
thermal and non-thermal contributions by fitting simultaneously the
radio spectrum over both the range where
non-thermal emission
dominates and the range where thermal emission is
dominant. The
LMC is best fit by a thermal continuum (spectral index
![]() )
corresponding to
)
corresponding to
![]() Jy.
The corresponding 5 GHz thermal fraction is 0.53. For
the SMC we
find a best fit
Jy.
The corresponding 5 GHz thermal fraction is 0.53. For
the SMC we
find a best fit
![]() Jy,
with
corresponding 5 GHz thermal fraction of 0.71. Thus,
we find in the
LMC a substantially lower and in the SMC a substantially higher
thermal contribution than estimated by Haynes et al. (1991) from
fitting the non-thermally dominated decimeter/centimeter radio data
only. Our fits also provide values for the spectral index of the
non-thermal emission,
Jy,
with
corresponding 5 GHz thermal fraction of 0.71. Thus,
we find in the
LMC a substantially lower and in the SMC a substantially higher
thermal contribution than estimated by Haynes et al. (1991) from
fitting the non-thermally dominated decimeter/centimeter radio data
only. Our fits also provide values for the spectral index of the
non-thermal emission,
![]() and
and
![]() .
The Lyman-continuum fluxes
log
.
The Lyman-continuum fluxes
log
![]() (LMC) and log
(LMC) and log
![]() (SMC) of the ionising
star ensembles in the Clouds implied by these thermal flux-densities
correspond to the presence of at least 2200 and 300
early O (mean
spectral type O6.5, cf. Vacca et al. 1996) in
the LMC and the SMC
respectively.
(SMC) of the ionising
star ensembles in the Clouds implied by these thermal flux-densities
correspond to the presence of at least 2200 and 300
early O (mean
spectral type O6.5, cf. Vacca et al. 1996) in
the LMC and the SMC
respectively.
3.2.2 Extinction
The free-free radio emission just determined and the integrated H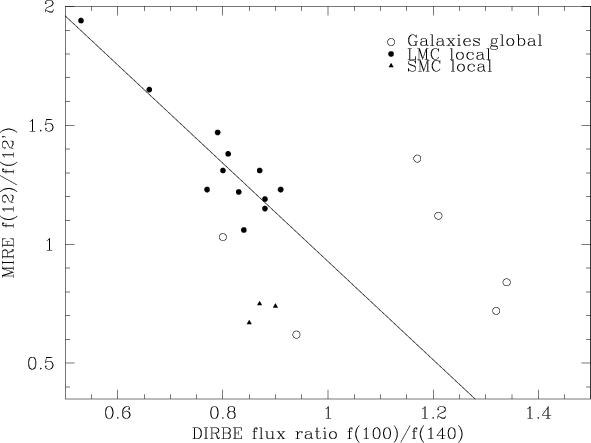
|
Figure 7: The mid-infrared excess defined from the COBE-DIRBE measurements (see text) as a function of radiation field energy density. Open symbols represent the global emission from the LMC, the SMC and galaxies taken from the DIRBE point source catalog (Smith et al. 2004). Filled symbols represent sub-regions in the LMC and the SMC, taken from Table 3). The straight line is the linear regression for the LMC sub-regions. |
| Open with DEXTER | |
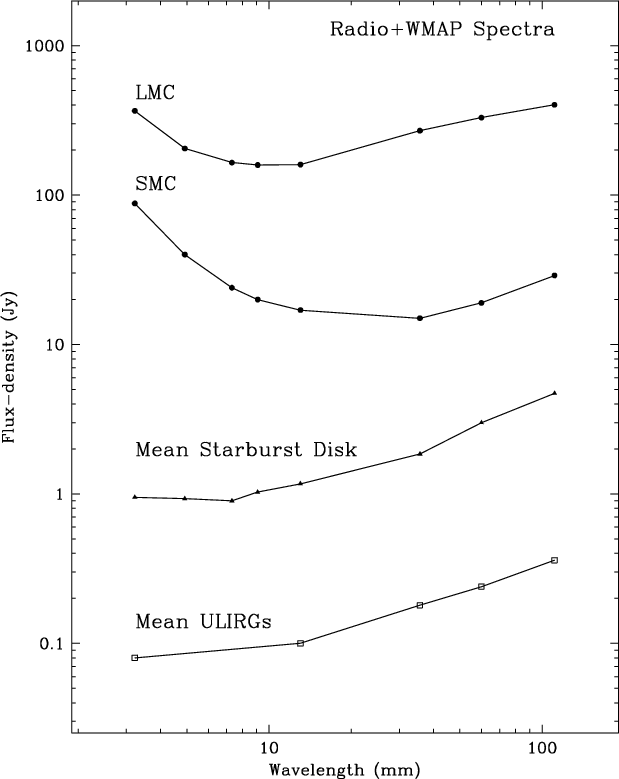
3.3 Millimeter and submillimeter excess in the Magellanic Clouds
A major difference between the Magellanic Clouds and the WMAP star-burst galaxies is a significant excess of emission at millimeter and submillimeter wavelengths. In the latter, dust emission is the dominant flux contributor only above 100 GHz (short-wards of 3 mm). In contrast, the spectral upturn associated with dust emission occurs in the LMC and especially the SMC at much lower frequencies of 30 GHz (7.5 mm) and 10 GHz (3 cm) respectively (see Fig. 8).
3.3.1 LMC and SMC millimeter and submillimeter spectra
At submillimeter wavelengths, excess emission is known to occur in
dwarf galaxies such as NGC 1569 (Lisenfeld et al. 2002; Galliano
et al. 2003),
II Zw 40, He 2-10, NGC 1140
(Galliano et al. 2005),
as well
as the star-burst galaxies NGC 3310 (Zhu et al. 2009), and
NGC 4631
(Dumke et al. 2004;
Bendo et al. 2006).
In all these cases, there is a
relatively small excess of emission at wavelengths of 0.85 and
1.2 mm
over values extrapolated from the far-infrared peak assuming a big
grain emissivity ![]() (where
(where ![]() is defined by
is defined by
![]() )
and related to the
Rayleigh-Jeans spectral index by
)
and related to the
Rayleigh-Jeans spectral index by
![]() ).
The perceived
magnitude of this excess is critically dependent on the quality of the
observations and the model extrapolations. The Magellanic Cloud SEDs
are much better sampled, and the WMAP observations extend the spectral
coverage to millimeter wavelengths, obviating the need for an
extrapolation. This leads to a significant improvement in the quality
of fits, and thus the determination of excess emission.
).
The perceived
magnitude of this excess is critically dependent on the quality of the
observations and the model extrapolations. The Magellanic Cloud SEDs
are much better sampled, and the WMAP observations extend the spectral
coverage to millimeter wavelengths, obviating the need for an
extrapolation. This leads to a significant improvement in the quality
of fits, and thus the determination of excess emission.
The LMC and the SMC exhibit a striking excess at both
millimeter and
submillimeter wavelengths. It is noteworthy that equally
well-sampled spectra of the Orion complex in the 1-1000 GHz
range
(Dicker et al. 2009)
show a similar range of turnover frequencies. In
the relatively quiet HII region the upturn frequency is at
about 100 GHz - as it is in the star-burst galaxies. However,
towards the
star-forming Orion-KL source, the upturn frequency occurs at
40 GHz,
as it does in the LMC. Simultaneously, the dust emissivity changes
from ![]() in the nebula to
in the nebula to ![]() in Orion-KL.
in Orion-KL.
Table 4: Millimeter excess.
The excess emission manifests itself between 0.3 mm
and 10 mm (30 GHz
and 1000 GHz) as a combination of a relatively low upturn
frequency
(defined as the frequency of minimum emission in the millimeter
spectral range, ![]() )
and a relatively low
submillimeter spectral index
)
and a relatively low
submillimeter spectral index
![]() ,
i.e. a relatively low
emissivity
,
i.e. a relatively low
emissivity ![]() around unity. There are two obvious ways in which
the dust emission upturn will shift to lower frequencies (longer
wavelengths) in any spectrum without the need to invoke special
properties of the radiating dust. First, if the radio continuum is
unusually weak with respect to the far-infrared
emission from
dust, the downshift of the radio part will quite naturally cause the
point where dust becomes dominant (the upturn) to shift to lower
frequencies. This is not the case as the Magellanic Clouds have, in
fact, a relatively strong radio continuum. The comparison galaxies
from Sect. 2.4 (included in Fig. 8 have (much)
larger
around unity. There are two obvious ways in which
the dust emission upturn will shift to lower frequencies (longer
wavelengths) in any spectrum without the need to invoke special
properties of the radiating dust. First, if the radio continuum is
unusually weak with respect to the far-infrared
emission from
dust, the downshift of the radio part will quite naturally cause the
point where dust becomes dominant (the upturn) to shift to lower
frequencies. This is not the case as the Magellanic Clouds have, in
fact, a relatively strong radio continuum. The comparison galaxies
from Sect. 2.4 (included in Fig. 8 have (much)
larger
![]() ratios
(2000-3000) than the
Magellanic Clouds (1650 and 1200) but do not exhibit a lower
upturn
frequency. Second, if the same far-infrared emission peak occurs at a
lower frequency, the Rayleigh-Jeans tail is displaced to lower
frequencies by the same amount, also causing the upturn to occur
earlier. In the Magellanic Cloud, the far-infrared peak indeed occurs
at somewhat longer wavelengths
ratios
(2000-3000) than the
Magellanic Clouds (1650 and 1200) but do not exhibit a lower
upturn
frequency. Second, if the same far-infrared emission peak occurs at a
lower frequency, the Rayleigh-Jeans tail is displaced to lower
frequencies by the same amount, also causing the upturn to occur
earlier. In the Magellanic Cloud, the far-infrared peak indeed occurs
at somewhat longer wavelengths
![]() (lower
frequencies) than in most other galaxies but not by the amount needed
to explain the observed low upturn frequencies
(lower
frequencies) than in most other galaxies but not by the amount needed
to explain the observed low upturn frequencies
![]() .
.
We refer to Fig. 6 of Leroy et al. (2007) to illustrate
that the SMC
spectrum is much flatter than the canonical ![]() spectrum. It
is even in excess of the
spectrum. It
is even in excess of the ![]() model
spectrum, and the
longest-wavelength data point at 1200
model
spectrum, and the
longest-wavelength data point at 1200 ![]() m suggests further
flattening. The same situation applies to the LMC spectrum. In
addition to the unmistakeable submillimeter excess of the LMC and the
SMC, the data presented in this paper show a further
millimeter excess.
m suggests further
flattening. The same situation applies to the LMC spectrum. In
addition to the unmistakeable submillimeter excess of the LMC and the
SMC, the data presented in this paper show a further
millimeter excess.
We have quantified this additional millimeter excess by
calculating at
four frequencies the combined emission of the non-thermal radio,
thermal radio, and thermal dust components. For the former, we
extrapolated the results from the preceding discussion; for the latter
we extrapolated the spectral fits to the DIRBE and TopHat data
published by Aguirre et al. (2003) in their
Fig. 4 and Table 9,
assuming no additional excess to be present at their lowest frequency
of
245 GHz (longest wavelength of 1200 ![]() m). Our
results are given
in Table 4,
which shows a significant excess (about 50
m). Our
results are given
in Table 4,
which shows a significant excess (about 50![]() of the total emission at 93 GHz) in the LMC, and an even
stronger excess in the SMC at all mm wavelengths.
of the total emission at 93 GHz) in the LMC, and an even
stronger excess in the SMC at all mm wavelengths.
|
Figure 8: Millimeter continuum spectra of the Magellanic Clouds compared to the means of other galaxies taken from the WMAP point source catalog (Chen & Wright 2009). WMAP points between 1.3 cm (23 GHz) and 3.2 mm (93 GHz) are supplemented by radio continuum data from 11 cm (2.7 GHz) to 3.6 cm (8.4 GHz) taken from the literature. The spectra of the LMC and the SMC clearly exhibit an upturn extending to relatively long wavelengths (low frequencies) due to the presence of anomalous dust emission. In contrast, the spectra of the star-burst disk galaxies and those of the much more luminous (U)LIRGs show only spectral flattening as free-free emission becomes dominant at short wavelengths. |
| Open with DEXTER | |
3.3.2 Possible explanations for a submillimeter excess
Various dust emission mechanisms have been suggested in order to explain excess emission at millimeter and shorter wavelengths.
- (i)
- Very cold big dust grains. Any
far-infrared/submillimeter
dust emission spectrum can be modelled by a sufficient number of
modified black-body curves each representing a population of big grain
dust particles in thermal equilibrium at a particular dust
temperature. An emissivity
 is commonly assumed,
although an inverse temperature dependence
is commonly assumed,
although an inverse temperature dependence
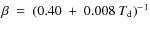 has
been proposed by Dupac et al. (2003). The values
has
been proposed by Dupac et al. (2003). The values
 characterising
the
star-burst disk galaxies correspond to mean dust temperatures
characterising
the
star-burst disk galaxies correspond to mean dust temperatures
 K.
However, any such fit of the FIR/sub-mm
spectra of the Magellanic Clouds requires the additional presence of a
significant component of very cold dust (
K.
However, any such fit of the FIR/sub-mm
spectra of the Magellanic Clouds requires the additional presence of a
significant component of very cold dust (
 ,
approaching 3 K). At such low temperatures, very large amounts
of
cold dust are required to produce even a modest amount of excess
emission. Regarding other galaxies for which a submillimeter excess
was surmised, virtually all (Lisenfeld et al. 2002; Dumke
et al. 2004;
Bendo et al. 2006;
Zhu et al. 2009)
authors have rejected this
solution as they consider the implied great masses of cold dust and
the resulting low gas-to-dust ratios to be implausible, in addition to
the difficulty of finding large amounts of very cold dust precisely in
those environments where low metallicities provide the least shielding
against strong ambient radiation fields. These arguments apply here
as well. The SMC has a lower metallicity than the LMC, yet it shows a
higher excess. It is hard to imagine how it could be richer in cold
dust.
,
approaching 3 K). At such low temperatures, very large amounts
of
cold dust are required to produce even a modest amount of excess
emission. Regarding other galaxies for which a submillimeter excess
was surmised, virtually all (Lisenfeld et al. 2002; Dumke
et al. 2004;
Bendo et al. 2006;
Zhu et al. 2009)
authors have rejected this
solution as they consider the implied great masses of cold dust and
the resulting low gas-to-dust ratios to be implausible, in addition to
the difficulty of finding large amounts of very cold dust precisely in
those environments where low metallicities provide the least shielding
against strong ambient radiation fields. These arguments apply here
as well. The SMC has a lower metallicity than the LMC, yet it shows a
higher excess. It is hard to imagine how it could be richer in cold
dust.
A more detailed look at the distribution of WMAP emission over the Clouds (Fig. 6) suggests the same conclusion. There is more excess emission from the bright star-forming regions 30 Doradus, N 11, N 44 than from the LMC Bar and the quiescent northern edge near N 48, although the field centered on the moderately bright southern region N 206 exhibits the highest excess. In the SMC, the NE and SW Bar regions are of very different appearance but show practically identical spectra; the SMC Wing has the steepest spectrum. It is hard to see how these patterns could correspond to the distribution of very cold dust in either galaxy.
- (ii)
- Different dust grain composition or structure.
The
Magellanic Clouds may host a population of dust grains with optical
properties very different from those of the dust grains in more
metal-rich galaxies. Structurally different dust grains, such as
fluffy or fractal particles (Ossenkopf & Henning 1994; Paradis
et al. 2009)
could produce the submillimeter excess. In fact, Reach et al. (1995) propose this
to be the explanation for the widespread cold dust component they found
in the Milky Way from COBE/FIRAS
measurements, after rejecting either very cold big dust grains or very
small grains as a possibility.
The dust grain emissivity
 is not only a function of dust
temperature, but it also depends on the grain composition. For
instance, amorphous graphite has
is not only a function of dust
temperature, but it also depends on the grain composition. For
instance, amorphous graphite has  whereas crystalline
dust has
(Mennella et al. 1998;
Agladze et al. 2005).
Thus, we cannot exclude in low-metallicity star-forming galaxies such
as the LMC and the SMC the predominance of a dust grain population
with different optical properties causing
to be around unity,
or even the inconspicuous presence of such dust in more massive
metal-rich spiral galaxies (such as the Milky Way, cf. Reach
et al. 1995).
However, it is not clear what this population is (but see
Mény et al. 2007),
or what processes would lie at the root of its
dominance in both star-forming dwarf galaxies and more extreme
(ultra)luminous infrared galaxies, nor is it obvious that could be as
low as zero, as appears to be the case in the SMC.
whereas crystalline
dust has
(Mennella et al. 1998;
Agladze et al. 2005).
Thus, we cannot exclude in low-metallicity star-forming galaxies such
as the LMC and the SMC the predominance of a dust grain population
with different optical properties causing
to be around unity,
or even the inconspicuous presence of such dust in more massive
metal-rich spiral galaxies (such as the Milky Way, cf. Reach
et al. 1995).
However, it is not clear what this population is (but see
Mény et al. 2007),
or what processes would lie at the root of its
dominance in both star-forming dwarf galaxies and more extreme
(ultra)luminous infrared galaxies, nor is it obvious that could be as
low as zero, as appears to be the case in the SMC.
- (iii)
- Very small spinning dust grains, first modelled by Draine & Lazarian (1998), have been invoked to explain anomalously high and apparently dust-correlated microwave emission in the WMAP Milky Way foreground, and Murphy et al. (2009) have suggested that such grains are also present in the nearby spiral galaxy NGC 6946. Recently, Ali-Haïmoud et al. (2009) and Dobler et al. (2009) have suggested that this peak frequency may occur anywhere between 30 GHz and 50 GHz, but the spectra in Fig. 4 lack a maximum around these frequencies. However, the WIM presented by these authors may not be representative of what is expected in the Magellanic Clouds, as they calculated spinning dust emissivities for grains illuminated by an ISRF with intensity U = 1 (Mathis et al. 1983). In actual fact, the IR modelling of the SMC and LMC SEDs requires a distribution of radiation field intensities from U = 0.1-0.8 to 1000. This may shift the peak to much higher frequencies up to 100 GHz (Ysard & Verstraete 2010; Ysard et al. 2010). The possibility that the LMC and SMC excess involves spinning dust cannot be excluded, and is explored in more detail in a companion paper (Bot et al. 2010).
The Magellanic Clouds (and other star-forming dwarf irregular
galaxies) differ in a number of ways from more massive galaxies, such
as the Milky Way, M 82, NGC 253, in their
dust-related properties. In
addition to the pronounced millimeter and submillimeter excess
emission and the weaker 12 ![]() m emission, they have (a) lower
metallicities, (b) fewer PAHs, (c) much lower total extinction, (d)
much weaker
m emission, they have (a) lower
metallicities, (b) fewer PAHs, (c) much lower total extinction, (d)
much weaker ![]() 2175 Å
extinction features, and (e) more
steeply rising UV extinction curves. In all these
respects, the
SMC is more extreme than the LMC, and they appear to be related in
some way. A common denominator may be metallicity-related
modifications of individual dust grains or the global dust population,
or both.
2175 Å
extinction features, and (e) more
steeply rising UV extinction curves. In all these
respects, the
SMC is more extreme than the LMC, and they appear to be related in
some way. A common denominator may be metallicity-related
modifications of individual dust grains or the global dust population,
or both.
4 Summary and conclusions
- 1.
- We have extracted from the COBE-DIRBE and WMAP databases
maps of the
Large and the Small Magellanic Cloud in the 1.25-240
 m
and 23 GHz-93 GHz spectral ranges respectively. We
have used the
maps to determine globally integrated flux densities.
m
and 23 GHz-93 GHz spectral ranges respectively. We
have used the
maps to determine globally integrated flux densities.
- 2.
- We complemented the COBE-DIRBE and WMAP flux densities by those literature flux densities that reliably represent the global emission from the Clouds. We used the resulting data sets to construct the flux density and energy distributions over the full spectral range from low-frequency radio to ultraviolet, for the first time covering the critical three spectral decades in the submillimeter-to-centimeter window (10 GHz-1 THz).
- 3.
- We have established that the SMC and the LMC have significant emission above the expected free-free radio continuum starting at frequencies of 10 GHz-30 GHz and extending over millimeter and submillimeter wavelengths into the far-infrared.
- 4.
- The excess is not caused by cold, big dust grains. The existence of the excess emission will provide new insight in the nature of interstellar dust, but in the meantime renders impossible reliable determination of total dust mass as well as gas-to-dust ratio.
- 5.
- The free-free thermal radio continuum is 13.4 (
 /
/
 )-0.1 Jy
for the SMC, and
)-0.1 Jy
for the SMC, and
 Jy
for the LMC, implying
Lyman continuum fluxes log
Jy
for the LMC, implying
Lyman continuum fluxes log
 and
log
and
log
 ,
respectively.
,
respectively.
- 6.
- The mean visual extinctions internal to the SMC and the LMC
are
 mag
and
mag
and  mag
respectively, in addition to Milky Way foreground extinctions of
0.12 mag and 0.25 mag.
mag
respectively, in addition to Milky Way foreground extinctions of
0.12 mag and 0.25 mag.
Appendix A: Spectral data used
Table A.1: Large Magellanic Cloud.
Table A.2: Small Magellanic Cloud.
References
- Agladze, N. I., Sievers, A. J., Jones, S. A., Burlitch, J. M., & Beckwith, S. V. W. 1996, ApJ, 462, 1026 [NASA ADS] [CrossRef] [Google Scholar]
- Aguirre, J. E., Bezaire, J. J., Cheng, E. S., et al. 2003, ApJ, 596, 273 [NASA ADS] [CrossRef] [Google Scholar]
- Ali-Haïmoud, Y., Hirata, C. M., & Dickinson, C. 2009, MNRAS, 395, 1055 [NASA ADS] [CrossRef] [Google Scholar]
- Alvarez, H., Aparici, J., & May, J. 1987, A&A, 176, 25 [NASA ADS] [Google Scholar]
- Alvarez, H., Aparici, J., & May, J. 1989, A&A, 213, 13 [NASA ADS] [Google Scholar]
- Alvarez, H., Aparici, J., May, J., & Reich, P. 2000, A&A, 355, 863 [NASA ADS] [Google Scholar]
- Beirão, P., Brandl, B. R., Devost, D., Smith, J. D., Hao, L., & Houck, J. R. 2006, ApJ, 643, L1 [NASA ADS] [CrossRef] [Google Scholar]
- Bell, E. F., Gordon, K. D., Kennicutt, R. C., & Zaritsky, D. 2002, ApJ, 565, 994 [NASA ADS] [CrossRef] [Google Scholar]
- Bendo, G. J., Dale, D. A., Draine, B. T., et al. 2006, ApJ, 652, 283 [NASA ADS] [CrossRef] [Google Scholar]
- Bennett, C. L., Bay, M., Halpern, M., et al. 2003a, ApJ, 583, 1 [NASA ADS] [CrossRef] [Google Scholar]
- Bennett, C. L., Halpern, M., Hinshaw, G., et al. 2003b, ApJS, 148, 1 [NASA ADS] [CrossRef] [Google Scholar]
- Bennett, C. L., Hill, R. S., Hinshaw, G., et al. 2003c ApJS, 148, 97 [Google Scholar]
- Bernard, J.-P., Reach, W. T., Paradis, D., et al. 2008, AJ, 136, 919 [NASA ADS] [CrossRef] [Google Scholar]
- Boggess, N. W., Mather, J. C., Weiss, R., et al. 1992, ApJ, 397, 420 [NASA ADS] [CrossRef] [Google Scholar]
- Bolatto, A. D., Simon, J. D., Stanimirovic, S., et al. 2007, ApJ, 655, 212 [NASA ADS] [CrossRef] [Google Scholar]
- Bot, C., Ysard, N., Paradis, D., et al. 2010, A&A, accepted [Google Scholar]
- Caplan, J., Ye, T., Deharveng, L., Turtle, A. J., & Kennicutt, R. C. 1996, A&A, 307, 403 [NASA ADS] [Google Scholar]
- Chen, X., & Wright, E. L. 2009, ApJ, 694, 222 [NASA ADS] [CrossRef] [Google Scholar]
- De Vaucouleurs, G., De Vaucouleurs, A., Corwin, H. G., et al. 1991, Third Reference Catalogue of Bright Galaxies, version 3.9 [Google Scholar]
- Dicker, S. R., Mason, B. S., Korngut, P. M., et al. 2009, ApJ, 705, 226 [NASA ADS] [CrossRef] [Google Scholar]
- Dobler, G., Draine, B., & Finkbeiner, D. P. 2009, ApJ, 699, 1374 [NASA ADS] [CrossRef] [Google Scholar]
- Draine, B. T., & Lazarian, A. 1998, ApJ, 508, 157 [NASA ADS] [CrossRef] [Google Scholar]
- Draine, B. T., Dale, D. A., Bendo, G., et al. 2007, ApJ, 663, 866 [NASA ADS] [CrossRef] [Google Scholar]
- Dumke, M., Krause, M., & Wielebinski, R. 2004, A&A, 414, 475 [NASA ADS] [CrossRef] [EDP Sciences] [Google Scholar]
- Dupac, X., Bernard, J.-P., Boudet, N., et al. 2003, A&A, 404, L11 [NASA ADS] [CrossRef] [EDP Sciences] [Google Scholar]
- Engelbracht, C. W., Gordon, K., Rieke, G. H., et al. 2005, ApJ, 628, L29 [NASA ADS] [CrossRef] [Google Scholar]
- Fixsen, D. J., Cheng, E. S., Cottingham, D. A., et al. 1994, ApJ, 420, 457 [NASA ADS] [CrossRef] [Google Scholar]
- Fixsen, D. J., Weiland, J. L., Brodd, S., et al. 1997, ApJ, 490, 482 [NASA ADS] [CrossRef] [Google Scholar]
- Galliano, F., Madden, S. C, Jones, A. P., et al., 2003, A&A, 407, 159 [NASA ADS] [CrossRef] [EDP Sciences] [Google Scholar]
- Galliano, F., Madden, S. C., Jones, A. P., Wilson, C. D., & Bernard, J.-P. 2005, A&A, 434, 867 [NASA ADS] [CrossRef] [EDP Sciences] [Google Scholar]
- Haynes, R. F., Klein, U., Wayte, S. R., et al. 1991, A&A, 252, 475 [NASA ADS] [Google Scholar]
- Hinshaw, G., Weiland, J. L., Hill, R. S., et al. 2009, ApJS, 180, 225 [NASA ADS] [CrossRef] [Google Scholar]
- Hughes, A., Wong, T., Ekers, R., et al. 2006, MNRAS, 370, 363 [NASA ADS] [CrossRef] [Google Scholar]
- Hunt, L., Bianchi, S., & Maiolino, R. 2005, A&A, 434, 849 [NASA ADS] [CrossRef] [EDP Sciences] [Google Scholar]
- Israel, F. P., Raban, D., Booth, R. S., & Rantakyrö, F. T. 2008, A&A, 483, 741 [NASA ADS] [CrossRef] [EDP Sciences] [Google Scholar]
- Kennicutt, R. C., Bresolin, F., Bomans, D. J., Bothun, G. D., & Thompson I. B. 1995, AJ, 109, 594 [NASA ADS] [CrossRef] [Google Scholar]
- Klein, U., Wielebinski, R., Haynes, R. F., & Mail, D. F. 1989, A&A, 211, 280 [NASA ADS] [Google Scholar]
- Leroy, A., Bolatto, A., Stanimirovic, S., et al. 2007, ApJ, 658, 1027 [NASA ADS] [CrossRef] [Google Scholar]
- Lisenfeld, U., Israel, F. P., Stil, J. M., & Sievers, A. 2002, A&A, 382, 860 [NASA ADS] [CrossRef] [EDP Sciences] [Google Scholar]
- Loiseau, N., Klein, U., Greybe, A., Wielebinski, R., & Haynes, R. F. 1987, A&A, 178, 62 [NASA ADS] [Google Scholar]
- Mathis, J. S., Mezger, P. G., & Panagia, N. 1983, A&A, 128, 212 [NASA ADS] [Google Scholar]
- Mennella, V., Brucato, J. R., Colangeli, L., et al. 1998, ApJ, 496, 1058 [NASA ADS] [CrossRef] [Google Scholar]
- Mény, C., Gromov, V., Boudet, N., et al. 2007, A&A, 468, 171 [Google Scholar]
- Micelotta, E. R. 2009, Ph.D. Thesis, Leiden University [Google Scholar]
- Mountfort, P. I., Jonas, J. L., de Jager, G., & Baart, E. E. 1987, MNRAS, 226, 917 [NASA ADS] [Google Scholar]
- Murphy, E. J., Helou, G., Condon, J. J., et al. 2010, ApJ, 709, 108 [Google Scholar]
- Ossenkopf, V., & Henning, Th. 1994, A&A, 291, 943 [NASA ADS] [Google Scholar]
- Page, T., & Carruthers, G. R. 1981, ApJ, 248, 906 [NASA ADS] [CrossRef] [Google Scholar]
- Paradis, D., Bernard, J.-Ph., & Mény, C. 2009, A&A, 506, 745 [NASA ADS] [CrossRef] [EDP Sciences] [Google Scholar]
- Reach, W. T., Dwek, E., Fixsen, D. J., et al. 1995, ApJ, 451, 188 [NASA ADS] [CrossRef] [Google Scholar]
- Rice, W., Lonsdale, C. J., Soifer, B. T., et al. 1988, ApJS, 68, 91 [NASA ADS] [CrossRef] [Google Scholar]
- Sakon, I., Onaka, T., Kaneda, H., et al. 2006, ApJ, 651, 174 [NASA ADS] [CrossRef] [Google Scholar]
- Schlegel, D. J., Finkbeiner, D. P., & Davis, M. 1998, ApJ, 500, 525 [NASA ADS] [CrossRef] [Google Scholar]
- Schwering, P. B. W. 1988, Ph.D. Thesis Sterrewacht Leiden, Leiden University (NL) [Google Scholar]
- Shain, C. A. 1959, ed. R. N. Bracewell (Stanford, CA: Stanford Univ. Press), IAU Symp., 9, 328 [Google Scholar]
- Silverberg, R. F., Hauser, M. G., Boggess, N. W., et al. 1993, SPIE, 2019, 180 [Google Scholar]
- Smith, B. J., Price, S. D., & Baker, R. I. 2004, ApJS, 154, 673 [NASA ADS] [CrossRef] [Google Scholar]
- Stanimirovic, S., Staveley-Smith, L., Van der Hulst, J. M., et al. 2000, MNRAS, 315, 791 [NASA ADS] [CrossRef] [Google Scholar]
- Vacca, W. D., Garmany, C. D., & Shull, J. M. 1996, ApJ, 460, 914 [NASA ADS] [CrossRef] [Google Scholar]
- Wall, W. F., Reach, W. T., Hauser, M. G., et al. 1996, ApJ, 456, 566 [NASA ADS] [CrossRef] [Google Scholar]
- Wilke, K., Klaas, U., Lemke, D., et al. 2004, A&A, 414, 69 [NASA ADS] [CrossRef] [EDP Sciences] [Google Scholar]
- Wright, E. L., Mather, J. C., Bennett, C. L., et al. 1991, ApJ, 381, 200 [NASA ADS] [CrossRef] [Google Scholar]
- Ye, T., & Turtle, A. J. 1991, MNRAS, 249, 693 [NASA ADS] [Google Scholar]
- Ysard, N., & Verstraete, L. 2010, A&A, 509, A12 [NASA ADS] [CrossRef] [EDP Sciences] [Google Scholar]
- Ysard, N., Miville-Deschenes, M.-A., & Verstraete, L. 2010, A&A, 509, L1 [NASA ADS] [CrossRef] [EDP Sciences] [Google Scholar]
- Zhu, M., Papadopoulods, P. P., Xilouris, E. M., Kuno, N., & Lisenfeld, U. 2009, ApJ, 706, 941 [NASA ADS] [CrossRef] [Google Scholar]
Footnotes
- ...
here
![[*]](/icons/foot_motif.png)
- Foreground-corrected channel images derived from the Zodi-Subtracted Mission Average Maps can be found on Karl Gordon's website http://dirty.as.arizona.edu/ kgordon/research/mc/mc.html
All Tables
Table 1: Global emission from LMC and SMC.
Table 2: WMAP peak flux densities in the Magellanic Clouds.
Table 3: COBE-DIRBE peak flux densities in the Magellanic Clouds.
Table 4: Millimeter excess.
Table A.1: Large Magellanic Cloud.
Table A.2: Small Magellanic Cloud.
All Figures
|
|
Figure 1: Maps of the radio continuum emission of the LMC at ( left to right) 23, 33, 41 GHz, 61 GHz, and 94 GHz. All images are at the nominal WMAP resolution, and in Galactic coordinates centered on l=279.70, b=-35.10. Equatorial North is at right. Contour levels are drawn at (23 GHz) 0.1, 0.19, 0.38, 0.74, 1.4, 2.8, 5.5, 10.7 mK, (33 GHz) 0.1, 0.19, 0.36, 0.68, 1.3, 2.4, 4.6 mK; (41 GHz) 0.1, 0.19, 0.34, 0.64, 1.2, 2.2, 4.1, 7.6 mK; (61 GHz) 0.1, 0.17, 0.31, 0.53, 0.94, 1.6, 2.9, 5.0 mK; (93 GHz) 0.1, 0.16, 0.25, 0.40 0.64 1.0, 1.6, 2.6 mK. |
| Open with DEXTER | |
| In the text | |
| |
Figure 2: Maps of the radio continuum emission of the SMC at ( left to right) 23, 33, 41 GHz, 61 GHz, and 94 GHz. All images are at the nominal WMAP resolution. Images are in Galactic coordinates, centered on l=302.00, b=-44.97, and therefore appear ``upside-down''; equatorial North is at bottom. Contour levels are drawn at (23 GHz) 0.1, 0.19, 0.38, 0.74, 1.4, 2.8, 5.5, 10.7 mK, (33 GHz) 0.1, 0.19, 0.36, 0.68, 1.3, 2.4, 4.6 mK; (41 GHz) 0.1, 0.19, 0.34, 0.64, 1.2, 2.2, 4.1, 7.6 mK; (61 GHz) 0.1, 0.17, 0.31, 0.53, 0.94, 1.6, 2.9, 5.0 mK; (93 GHz) 0.1, 0.16, 0.25, 0.40 0.64 1.0, 1.6, 2.6 mK. |
| Open with DEXTER | |
| In the text | |
|
|
Figure 3:
Total infrared luminosity maps from DIRBE measurements. Contours are
marked in units of |
| Open with DEXTER | |
| In the text | |
|
|
Figure 4:
Top: global (area-integrated) continuum
spectrum from low-frequency radio to the ultraviolet. Filled circles
represent integrated flux densities in Jansky from Table 1, open circles
were taken from the literature (see text). Bottom:
corresponding global flux (proportional to power) distribution |
| Open with DEXTER | |
| In the text | |
|
|
Figure 5:
Near- to far-infrared spectra of the LMC and the SMC, compared to a
sample of star-burst galaxies taken from the DIRBE point source catalog
by Smith et al. (2004)
and data tabulated by Hunt et al. (2005). Most of the
galaxies exhibit a clear 12 |
| Open with DEXTER | |
| In the text | |
|
|
Figure 6: COBE-DIRBE spectra of the LMC sub-regions from Table 3. For the sake of clarity, we have divided the spectra (open circles) of LMC regions 3 (Dor Ridge), 5, and 10 (N 48) by five, and that of LMC region 4 (N 206; open stars) by a hundred. Right: WMAP spectra of the LMC sub-regions (from Table 2). The spectra of the northern source N 48 and the southern object N 206, representing the most extreme cases, have been multiplied by five and are indicated by open circles. |
| Open with DEXTER | |
| In the text | |
|
|
Figure 7: The mid-infrared excess defined from the COBE-DIRBE measurements (see text) as a function of radiation field energy density. Open symbols represent the global emission from the LMC, the SMC and galaxies taken from the DIRBE point source catalog (Smith et al. 2004). Filled symbols represent sub-regions in the LMC and the SMC, taken from Table 3). The straight line is the linear regression for the LMC sub-regions. |
| Open with DEXTER | |
| In the text | |
|
|
Figure 8: Millimeter continuum spectra of the Magellanic Clouds compared to the means of other galaxies taken from the WMAP point source catalog (Chen & Wright 2009). WMAP points between 1.3 cm (23 GHz) and 3.2 mm (93 GHz) are supplemented by radio continuum data from 11 cm (2.7 GHz) to 3.6 cm (8.4 GHz) taken from the literature. The spectra of the LMC and the SMC clearly exhibit an upturn extending to relatively long wavelengths (low frequencies) due to the presence of anomalous dust emission. In contrast, the spectra of the star-burst disk galaxies and those of the much more luminous (U)LIRGs show only spectral flattening as free-free emission becomes dominant at short wavelengths. |
| Open with DEXTER | |
| In the text | |
Copyright ESO 2010
Current usage metrics show cumulative count of Article Views (full-text article views including HTML views, PDF and ePub downloads, according to the available data) and Abstracts Views on Vision4Press platform.
Data correspond to usage on the plateform after 2015. The current usage metrics is available 48-96 hours after online publication and is updated daily on week days.
Initial download of the metrics may take a while.