| Issue |
A&A
Volume 516, June-July 2010
|
|
|---|---|---|
| Article Number | A48 | |
| Number of page(s) | 9 | |
| Section | Interstellar and circumstellar matter | |
| DOI | https://doi.org/10.1051/0004-6361/200912656 | |
| Published online | 24 June 2010 | |
HD 95881: a gas rich to gas poor transition disk?![[*]](/icons/foot_motif.png)
A. P. Verhoeff1 - M. Min2 - B. Acke3,![]() - R. van Boekel4 - E. Pantin5 - L. B. F. M. Waters1,3 - A. G. G. M. Tielens6 - M. E. van den Ancker7 - G. D. Mulders1,8 - A. de Koter1,2 - J. Bouwman4
- R. van Boekel4 - E. Pantin5 - L. B. F. M. Waters1,3 - A. G. G. M. Tielens6 - M. E. van den Ancker7 - G. D. Mulders1,8 - A. de Koter1,2 - J. Bouwman4
1 - Astronomical Institute ``Anton Pannekoek'',
University of Amsterdam, PO Box 94249, 1090 GE Amsterdam,
The Netherlands
2 - Astronomical Institute Utrecht, University of Utrecht, PO Box 80000,
3508 TA Utrecht, The Netherlands
3 - Institute for Astronomy, KU Leuven
Celestijnenlaan 200B, 3001 Leuven, Belgium
4 - Max Planck Institut für Astronomie,
Königstuhl 17, 69117 Heidelberg, Germany
5 - CEA/DSM/DAPNIA/Service d'Astrophysique, CE Saclay, 91191 Gif-sur-Yvette, France
6 - Leiden Observatory, Niels Bohrweg 2, 2300 RA Leiden, The Netherlands
7 - European Southern Observatory, Karl-Schwarzschild-Strasse 2,
85748 Garching bei München, Germany
8 - SRON Netherlands Institute for Space Research, PO Box 800, 9700 AV Groningen, The Netherlands
Received 8 June 2009 / Accepted 30 March 2010
Abstract
Context. Based on the far infrared excess the Herbig class
of stars is divided into a group with flaring circumstellar disks
(group I) and a group with flat circumstellar disks (group II).
Dust sedimentation is generally proposed as an evolution mechanism to
transform flaring disks into flat disks. Theory predicts that during
this process the disks preserve their gas content, however observations
of group II Herbig Ae stars demonstrate a lack of gas.
Aims. We map the spatial distribution of the gas and dust around the group II Herbig Ae star HD 95881.
Methods. We analyze optical photometry, Q-band imaging, infrared spectroscopy, and K and N-band
interferometric spectroscopy. We use a Monte Carlo radiative transfer
code to create a model for the density and temperature structure which
quite accurately reproduces all the observables.
Results. We derive a consistent picture in which the disk
consists of a thick puffed up inner rim and an outer region which has a
flaring gas surface and is relatively void of ``visible'' dust grains.
Conclusions. HD 95881 is in a transition phase from a gas rich flaring disk to a gas poor self-shadowed disk.
Key words: infrared: stars - stars: pre-main sequence - stars: planetary systems: protoplanetary disks
1 Introduction
Herbig Ae (HAe) stars are known to have gas-rich, dusty disks that are the remnant of the star formation process. These disks are most likely the sites of ongoing planet formation. The processes leading to and associated with planet formation modify both the composition and the geometry of the disk. Grain growth and grain settling are expected to result in large spatial variation of the grain size distribution and the gas to dust mass ratio within the disk. The gravitational interaction of proto-planets with the disk can create gaps/holes. Also the gas and the dust chemistry is expected to vary spatially. In order to understand planet formation, it is thus important to establish the spatial distribution of gas and dust in protoplanetary disks independently.Observationally, the spectral energy distributions (SEDs) of HAe stars
have been divided into two groups, that reflect differences in the
slope of the mid-IR (10-60 ![]() m) spectral range
(Meeus et al. 2001). Group I sources have red SEDs, while
group II sources have blue SEDs. These differences can be interpreted
in terms of the geometry of the disk. The direct irradiation of the
inner rim of a disk with an inner hole causes it to be puffed up
(Dullemond et al. 2001). This puffed up inner rim casts a shadow,
and only the outer disk surface regions emerge from the shadow and
receive direct stellar light. Depending on the dust opacity, some
disks may never emerge from the shadow of the inner rim
(Dullemond & Dominik 2004). This provides an elegant explanation for
the observed two types of SEDs: group I sources being flaring,
and group II sources self-shadowed. This interpretation has
been confirmed using spatially resolved mid-infrared (IR) imaging with
the Very Large Telescope Interferometer (VLTI;
e.g. Leinert et al. 2004).
m) spectral range
(Meeus et al. 2001). Group I sources have red SEDs, while
group II sources have blue SEDs. These differences can be interpreted
in terms of the geometry of the disk. The direct irradiation of the
inner rim of a disk with an inner hole causes it to be puffed up
(Dullemond et al. 2001). This puffed up inner rim casts a shadow,
and only the outer disk surface regions emerge from the shadow and
receive direct stellar light. Depending on the dust opacity, some
disks may never emerge from the shadow of the inner rim
(Dullemond & Dominik 2004). This provides an elegant explanation for
the observed two types of SEDs: group I sources being flaring,
and group II sources self-shadowed. This interpretation has
been confirmed using spatially resolved mid-infrared (IR) imaging with
the Very Large Telescope Interferometer (VLTI;
e.g. Leinert et al. 2004).
A difference between group I and group II sources was also found for
the strength of the mid-IR emission bands attributed to polycyclic
aromatic hydrocarbons (PAHs; Meeus et al. 2001;
Acke & van den Ancker 2004): flaring disks tend to show strong PAH
emission while self-shadowed sources show weaker or no PAH emission
(Acke et al. 2010). A similar difference was found for
the strength of the [O I] 6300 Å line
(Acke et al. 2005). However, there is significant scatter in
these trends (see below). Both the PAHs and the [O I] line strength
probe the gas in the upper disk layers, and both require direct
irradiation of the disk surface by stellar photons to be excited. PAHs
mainly probe the disk on scales of several tens to 100 AU
(e.g. van Boekel et al. 2004; Lagage et al. 2006;
Geers et al. 2007; Verhoeff et al. 2010),
i.e. similar scales as the dust continuum emission in the 10-60 ![]() m
wavelength range. These observations suggest that the spatial
distribution of gas in group II sources is different from that of
group I sources: apparently, in group II sources the gas in the
surface of the outer disk does not receive direct stellar photons.
m
wavelength range. These observations suggest that the spatial
distribution of gas in group II sources is different from that of
group I sources: apparently, in group II sources the gas in the
surface of the outer disk does not receive direct stellar photons.
In a theoretical study, Dullemond et al. (2007) show that for
disks in which the dust settles but the scale-height of the gas does
not change, both group I and group II sources should show prominent
PAH emission, contrary to the observed trend. However, some disks
classified as group II sources (i.e. with a self-shadowed dust
geometry) are observed to show prominent PAH emission and [O I] line
emission; examples are HD 98922 and HD 95881
(Acke & van den Ancker 2004; Acke et al. 2005). Verhoeff et al. (2010) show that for
HD 95881 the PAH emission is extended at a scale similar to those of
group I sources. Fedele et al. (2008) and
van der Plas et al. (2008) studied three HAeBe stars and found that
the gas and dust in their disks has a different spatial distribution.
In the case of the group II source HD 101412, PAH and [O I] emission
were detected and found to be more extended than the dust continuum at
10 ![]() m. These observations suggest that disks exist in which
the dust has settled but the scale-height of the gas is still
large enough at several tens of AU distance from the star to produce
substantial PAH and [O I] line emission. Such disks may provide
important clues as to how gas-rich disks evolve to gas-poor debris
disks.
m. These observations suggest that disks exist in which
the dust has settled but the scale-height of the gas is still
large enough at several tens of AU distance from the star to produce
substantial PAH and [O I] line emission. Such disks may provide
important clues as to how gas-rich disks evolve to gas-poor debris
disks.
In this paper, we study the spatial distribution of the gas and dust in the disk of HD 95881. This star was part of a larger study of spatially resolved mid-IR spectroscopy of HAe stars (Verhoeff et al. 2010). We use optical spectroscopy of the [O I] line, the SED, infrared spectra as well as near-IR and mid-IR interferometric observations to constrain the geometry of the gas and dust in the disk. We use a hydrostatic equilibrium disk model to fit the SED and compare the predicted spatial distribution of the near-IR and mid-IR emission of the best fitting disk model to the interferometric observations. We find convincing evidence that the dust in the disk of HD 95881 has settled but that the gas still has a significant scale-height. We derive an estimate on the total disk mass by fitting the strength of the PAH bands.
2 Stellar parameters
There is little information available on HD 95881 in the literature. From optical photometry the spectral type was determined to be A2III/IVe (Houk & Cowley 1975), which was translated into an effective temperature of 8990 K (Acke & van den Ancker 2004). The distance was established by a relatively uncertain association with the star formation region Sco OB2-4 (Acke & van den Ancker 2004). The distance to this region was previously determined by de Zeeuw et al. (1999). When we take these parameters to pinpoint HD 95881 in the Hertzsprung-Russell-diagram, we find that it is situated to the left of the Zero Age Main Sequence (ZAMS), which is unphysical. Since we consider the determination of3 Observations
3.1 AMBER
Spectrally dispersed K-band interferometric observations of HD 95881 were obtained with VLTI/AMBER on the UT1-UT3-UT4 baseline setting during the night of February 4, 2007. The weather conditions were excellent, with the optical seeing as low as 0.5Table 1: Characterizing parameters of HD 95881.
3.2 VISIR imaging
Q-band imaging data were obtained on the 14th of December 2005 using the VLT Imager and Spectrometer for mid-Infrared (VISIR; see Lagage et al. 2004). Standard ``chopping and nodding'' mid-infrared observational technique was used to suppress the background dominating at these wavelength. The Q2 filter was chosen, which has a central wavelength of 18.723.3 VISIR spectroscopy
Long slit N-band spectra were obtained with VISIR in the low resolution (LR) mode. A sample of 17 HAe stars was observed under the VISIR GTO program on circumstellar disks (Verhoeff et al. 2010). During the nights of December 16, 2005 and April 8, 2006 we observed HD 95881. Standard chopping and nodding along the slit was used with a chopper throw of 83.4 MIDI
HD 95881 was observed with the MID-infrared Interferometric instrument (MIDI; see Leinert et al. 2003), the 10We performed observations in ``High-Sens'' mode, i.e. we took an interferometric measurement combining the light from both telescopes, and subsequent photometric measurements of the signal from one telescope at a time. Stars of known brightness and angular diameter were observed, using the same procedure, for photometric calibration and monitoring system coherence losses (interferometric ``transfer function''). We found our interferometric measurement of HD 95881 to be of significantly higher quality than the corresponding photometric measurements, and chose to directly calibrate the correlated flux rather than converting to interferometric visibility by division over the photometry.
3.5 Additional data
A low resolution Spitzer-IRS spectrum is used to compare and flux-calibrate the VISIR spectrum. For the acquisition and reduction of the Spitzer data we refer to Juhász et al. (2010). Photometric data points were taken from Acke & van den Ancker (2004). Together with the Spitzer spectrum they make up the SED, which allows us to constrain the disk geometry (see Sect. 5). Finally, [O I] data were taken from an earlier study, see Acke et al. (2005).4 Analysis
4.1 AMBER
A good fit (![\begin{figure}
\par\includegraphics[width=8cm,clip]{figures/12656fig1}
\end{figure}](/articles/aa/full_html/2010/08/aa12656-09/img33.png)
|
Figure 1: The AMBER K-band visibilities of HD 95881. The projected length and position angle of the baselines is indicated on the left. Overplotted is the best-fit ring+point-source model (solid lines; see text). |
| Open with DEXTER | |
4.2 [O I] data
Acke et al. (2005) have investigated the [O I] 6300 Å emission line in a large sample of Herbig stars. The authors argue that the emission is non-thermal and originates from the disk surface of a flared circumstellar disk. This is consistent with the large detection rate of [O I] emitters among the group I sources in the sample. Roughly half of the group II sources, however, display the [O I] 6300 Å line in emission as well, albeit less strong. HD 95881 is one of these targets.![\begin{figure}
\par\includegraphics[width=8cm,clip]{12656fig2}
\end{figure}](/articles/aa/full_html/2010/08/aa12656-09/img34.png)
|
Figure 2: The continuum-normalized [O I] 6300 Å emission line of HD 95881 (Acke et al. 2005). The velocity axis has been centered on the centroid position of the feature, i.e. the radial velocity of the central star. Line profiles corresponding to a surface brightness proportional to r-3 are overplotted. Red represents a model with an outer radius beyond 31 AU; yellow corresponds to the model with an outer radius equal to 11 AU. See text for details. |
| Open with DEXTER | |
In Fig. 2, the [O I] 6300 Å line profile is
shown. We have fitted a generic model to the data, assuming that the
intensity drops off with radius as a power law and that the disk is in
Keplerian rotation. We adopt the disk inclination derived from the
AMBER fit. An acceptable fit (reduced ![]() = 3) was achieved
with a power index of -3.0
= 3) was achieved
with a power index of -3.0 ![]() 0.2, an inner radius of
0.9
0.2, an inner radius of
0.9 ![]() 0.2 AU and an outer radius larger than 11 AU. The best fit
(reduced
0.2 AU and an outer radius larger than 11 AU. The best fit
(reduced ![]() = 1.5) has an outer radius beyond
31 AU. In the figure we show the best-fit profile, as well as the
profile that corresponds to the model with an 11 AU outer
radius. Decreasing the outer radius of the model to even lower values
would further deteriorate the fit quality. We can therefore conclude
that a significant fraction of the [O I] emission comes from a region
at tens of AU from the star. Note that our model does not account for
the 15% of [O I] flux which is emitted in the blue- and red wings of
the profile. In these regions, close to the star, the power law
approximation fails.
= 1.5) has an outer radius beyond
31 AU. In the figure we show the best-fit profile, as well as the
profile that corresponds to the model with an 11 AU outer
radius. Decreasing the outer radius of the model to even lower values
would further deteriorate the fit quality. We can therefore conclude
that a significant fraction of the [O I] emission comes from a region
at tens of AU from the star. Note that our model does not account for
the 15% of [O I] flux which is emitted in the blue- and red wings of
the profile. In these regions, close to the star, the power law
approximation fails.
4.3 Spitzer
| Figure 3:
The Spitzer LR spectrum of HD 95881 (
|
|
| Open with DEXTER | |
The Spitzer-IRS spectrum is given in Fig. 3. It displays a rich mineralogy, there is emission of amorphous and crystalline silicates as well as emission of various PAH bands. See Juhász et al. (2010) for a detailed discussion of the mineralogy. The blue slope at longer wavelengths is typical for group II sources.
Compared to other HAe stars HD 95881 appears to be a very
ordinary PAH emitter. We have verified this by comparing PAH
band-strength ratios. We have taken the 6.2, 7.7, 8.6, 11.2 and
12.7 ![]() m PAH band strengths from Verhoeff et al. (2010) and
Acke et al. (2010) and looked at the ratios of their continuum
subtracted and integrated strengths. The only aspect that makes
HD 95881 stand out slightly is the 8.6
m PAH band strengths from Verhoeff et al. (2010) and
Acke et al. (2010) and looked at the ratios of their continuum
subtracted and integrated strengths. The only aspect that makes
HD 95881 stand out slightly is the 8.6 ![]() m PAH feature, which is
relatively strong.
m PAH feature, which is
relatively strong.
4.4 VISIR imaging
A dedicated data reduction pipeline was used for the imaging. It features a comprehensive set of methods to correct for instrumental signatures such as detector striping or background low-frequencies excess of noise (Pantin et al. 2008,2009). A photometric analysis gives an integrated flux for HD 95881 of 6.0Assuming that the disk has the geometric parameters given in
Table 2, we divided the residuals in a series of
concentric ellipses having a separation of 0.075
![]() along the
semi-major axis of the disk. We assumed an aspect ratio corresponding
to a flat disk inclined at 55
along the
semi-major axis of the disk. We assumed an aspect ratio corresponding
to a flat disk inclined at 55![]() ,
and a position angle of
103
,
and a position angle of
103![]() from North. We used these elliptic annuli to numerically
estimate the surface brightness distribution and the corresponding
uncertainty levels.
from North. We used these elliptic annuli to numerically
estimate the surface brightness distribution and the corresponding
uncertainty levels.
Our statistical analysis confirms we have a significant
detection since for distances in the range 0.4-0.85
![]() from the
star the average values in each of the elliptical annuli are well
above the detection limits set at 99% confidence. The measured
average surface brightness in elliptic annuli as a function of the
semi-major axis distance to the star are plotted in
Fig. 4. The 3
from the
star the average values in each of the elliptical annuli are well
above the detection limits set at 99% confidence. The measured
average surface brightness in elliptic annuli as a function of the
semi-major axis distance to the star are plotted in
Fig. 4. The 3![]() uncertainties are
displayed as bars on the plot. The total flux in the resolved
component is 0.7
uncertainties are
displayed as bars on the plot. The total flux in the resolved
component is 0.7 ![]() 0.1 Jy.
0.1 Jy.
![\begin{figure}
\par\includegraphics[width=7cm,clip]{12656fig4}
\end{figure}](/articles/aa/full_html/2010/08/aa12656-09/img36.png)
|
Figure 4:
Surface brightness levels as a function of distance from the
star in the Q2 image after point source subtraction. The error
bars give the 3 |
| Open with DEXTER | |
4.5 VISIR spectroscopy
The general reduction and analysis strategy of the spectroscopic VISIR data is described in detail in Verhoeff et al. (2010). For HD 95881 the telluric correction was done by means of an airmass interpolation of two calibrators. The observation of April 8, 2006, appeared to be suffering strong atmospheric residuals. The spectrum of December 16 2005 was thus chosen as most representative. The missing observation of the 9.8![\begin{figure}
\par\includegraphics[width=9cm,clip]{12656fig5}
\vspace*{5mm}
\end{figure}](/articles/aa/full_html/2010/08/aa12656-09/img37.png)
|
Figure 5:
The top panel shows the VISIR N-band spectrum of
HD 95881 (black). Overplotted are the Spitzer spectrum
(thick green), the correlated flux as measured with MIDI
(dotted blue), and the difference between the Spitzer and MIDI
spectra (orange). The Spitzer spectrum represents the entire
disk, the MIDI correlated flux spectrum represents the inner disk (
|
| Open with DEXTER | |
The Full Width at Half Maximum (FWHM) of the spatial emission profile
of the target was determined by performing a Gauss-fit in 32 merged
wavelength bins. Comparison of the science signals with the PSF shows
that the target is unresolved in the continuum. After quadratic
subtraction of the PSF and averaging over the median values of all
measurements we find a three sigma upper-limit to the FWHM extent of
the continuum emission region of <0.46
![]() ,
which corresponds
to <79 AU at the adopted distance of 170 pc. However the science
signal displays a relative increase at 8.6 and 11.2
,
which corresponds
to <79 AU at the adopted distance of 170 pc. However the science
signal displays a relative increase at 8.6 and 11.2 ![]() m and an
upturn to the left of
m and an
upturn to the left of ![]() 8
8 ![]() m, which are exactly the
wavelengths at which the PAH molecules have emission features (see
Verhoeff et al. 2010). We checked the significance of these
FWHM features with respect to pixel-to-pixel variations and concluded
that the PAH emission is significantly more extended than the
continuum.
m, which are exactly the
wavelengths at which the PAH molecules have emission features (see
Verhoeff et al. 2010). We checked the significance of these
FWHM features with respect to pixel-to-pixel variations and concluded
that the PAH emission is significantly more extended than the
continuum.
In order to estimate the spatial extent of the PAH emission we
measured the spatial emission profile at the peak wavelengths of the
PAH bands and we subtracted the spatial emission profile of the
continuum contribution. This continuum profile was determined by
interpolating the intensities and spatial profiles adjacent to the PAH
bands. The resulting observed spatial profile of the PAH emission was
Gaussian fitted to obtain the FWHM. Finally, the instrumental width
(i.e. the PSF) was quadratically subtracted to obtain a measure for
the intrinsic extent of the PAH emission. We found FWHM values of
0.34
![]() and 0.39
and 0.39
![]() for
the 8.6 and 11.2
for
the 8.6 and 11.2 ![]() m PAH bands respectively, which results in
absolute sizes of 58 and 66 AU. In a Gaussian distribution of the PAH
emission this would mean that 99% is confined in a radius of
m PAH bands respectively, which results in
absolute sizes of 58 and 66 AU. In a Gaussian distribution of the PAH
emission this would mean that 99% is confined in a radius of
![]() 100 AU. Note that this is a conservative estimate of the PAH
emission scale since the PAH surface brightness is expected to fall
off with distance from the star together with the stellar flux as
1/r2.
100 AU. Note that this is a conservative estimate of the PAH
emission scale since the PAH surface brightness is expected to fall
off with distance from the star together with the stellar flux as
1/r2.
4.6 MIDI
In Fig. 5 we compare the spectrum in
correlated flux as seen by MIDI, i.e. the total flux times the
visibility, to the spectra observed by VISIR and Spitzer. The
correlated flux spectrum is dominated by the central few AU of the
disk, the Spitzer and VISIR spectra probe the entire disk. Note the
difference in the strength of the 8.6 and 11.2 ![]() m PAH bands in
the spectra. These bands are prominent in the total flux spectra, but
essentially absent in the correlated flux spectrum. The PAH emission
region is apparently outside of the disk region probed by MIDI. This
shows by direct measurement that the PAH features arise at scales
much larger than
m PAH bands in
the spectra. These bands are prominent in the total flux spectra, but
essentially absent in the correlated flux spectrum. The PAH emission
region is apparently outside of the disk region probed by MIDI. This
shows by direct measurement that the PAH features arise at scales
much larger than ![]() 2 AU in the disk of HD 95881. To stress this
point we also plotted the difference between the Spitzer and the MIDI
correlated flux spectrum in the bottom panel of
Fig. 5. This difference spectrum is dominated by
the emission of the outer disk (
2 AU in the disk of HD 95881. To stress this
point we also plotted the difference between the Spitzer and the MIDI
correlated flux spectrum in the bottom panel of
Fig. 5. This difference spectrum is dominated by
the emission of the outer disk (
![]() AU)
and shows very distinct PAH features.
AU)
and shows very distinct PAH features.
To investigate spatial differences in the weak silicate emission we
considered the shape of the feature in the Spitzer, MIDI, and
difference spectrum in a consistent manner. We approximated a
continuum with a straight line intersecting the spectra at 8.3 and
13.2 ![]() m, subtracted this from the spectra and then normalized the
spectra with the flux level at 10.3
m, subtracted this from the spectra and then normalized the
spectra with the flux level at 10.3 ![]() m. The bottom panel of
Fig. 5 shows the result. The shape of the silicate
feature inside and outside a radius of
m. The bottom panel of
Fig. 5 shows the result. The shape of the silicate
feature inside and outside a radius of ![]() 2 AU is very
similar, which implies that the silicate composition and grain
size distribution should also be very similar. This is not
surprising, since the high visibility indicates that the silicate
emission is dominated by a compact inner region (
2 AU is very
similar, which implies that the silicate composition and grain
size distribution should also be very similar. This is not
surprising, since the high visibility indicates that the silicate
emission is dominated by a compact inner region (
![]() AU).
AU).
4.7 Observational picture
![\begin{figure}
\par\includegraphics[width=18cm,clip]{figures/12656fig6}\end{figure}](/articles/aa/full_html/2010/08/aa12656-09/img41.png)
|
Figure 6: Schematic depiction of the two considered disk models. First we consider a spatial distribution that is the same for both the dust and the gas. Second we consider a model that assumes that the surface density of the gas decays much slower with distance from the star. In this second model we indicated the different regions of the disk that are probed by the observations discussed in this paper. |
| Open with DEXTER | |
Before we describe a detailed modeling effort of the circumstellar material, we summarize the analyses of the various observations. This already gives an insight into the spatial distribution of the gas and the dust. In Fig. 6 we display schematic representations of two disk models, that will be considered in Sect. 5. In the second model we indicated the diagnostic scales of the various data sets to combine them into a consistent picture.
The AMBER data probes the very inner parts of the disk. The analysis
shows that the K-band emission could be explained with an emitting
ring at ![]() 0.4 AU. A more physical model, which will be presented
in Sect. 5 has the inner rim of the disk at 0.55 AU. A
part of the K-band emission was shown to come from close to the
star, and well within the inner dust disk (represented by the ring).
This could be an indicator of ongoing accretion.
0.4 AU. A more physical model, which will be presented
in Sect. 5 has the inner rim of the disk at 0.55 AU. A
part of the K-band emission was shown to come from close to the
star, and well within the inner dust disk (represented by the ring).
This could be an indicator of ongoing accretion.
The [O I] 6300 Å emission line is formed by the photo-dissociation of OH molecules by UV photons (Acke et al. 2005). The detection of the [O I] 6300 Å at large distances (from one to tens of AU) from the central star is thus an indication that the outer disk has an illuminated gas surface.
The Spitzer data establish the presence of PAH emission and the VISIR
spectrum pins it down to a circumstellar disk. The emission features
of PAH molecules are caused by internal vibrational modes, which are
mainly excited by UV photons. Since the PAH molecules are coupled to
the gas, the PAH emission is another indicator of an illuminated gas
surface. The resolved VISIR spectrum sets the radial scale of this gas
surface at ![]() 100 AU.
100 AU.
The VISIR Q-band image displays a faint extended axi-symmetric
emission component (![]() 10% of the total flux), that stretches out
to large radii (
10% of the total flux), that stretches out
to large radii (
![]() AU).
AU).
The MIDI correlated flux spectrum shows that the PAH features
originate from radii much larger than ![]() 2 AU and that the
silicate composition is quite similar in the inner and outer disk.
2 AU and that the
silicate composition is quite similar in the inner and outer disk.
5 Modeling
In this section we present a model for the disk around HD 95881 which quite accurately reproduces the observations described above. To obtain this model we use the Monte Carlo radiative transfer code MCMax by Min et al. (2009). This code can compute a self-consistent disk structure and a full range of observables. It has a build-in option that models the full PAH excitation, using the temperature distribution approximation (see e.g. Guhathakurta & Draine 1989; Siebenmorgen et al. 1992) including multi-photon events for the excitation. We use MCMax here to compute the temperature structure, the vertical density structure and the resulting SED, the Spitzer spectrum, the AMBER visibilities, the MIDI correlated flux, the VISIR images, and the FWHM as function of wavelength. The steps to come to the final model presented here were the following.5.1 Initial constraints
First we fixed the composition, and the size and shape distribution of
the silicate component of the dust to be equal to that obtained from
the 10 micron silicate feature by van Boekel et al. (2005) . For
HD 95881 these are 80% large (1.5 ![]() m) pyroxene grains, 11%
large enstatite grains, 1% small (0.1
m) pyroxene grains, 11%
large enstatite grains, 1% small (0.1 ![]() m) forsterite
grains, 5% large forsterite grains, and 3% small (0.1
m) forsterite
grains, 5% large forsterite grains, and 3% small (0.1 ![]() m)
silica grains. For the shapes of the grains we use the
Distribution of Hollow Spheres (DHS,
see Min et al. 2005), as outlined in
van Boekel et al. (2005), where we refer to for further details on
the model for the silicate dust grains. In order to get the required
continuum opacity needed we added amorphous carbon grains. To model
the irregular shape of the carbon grains we also used DHS. For
the refractive index of carbon we adopted the data by
Preibisch et al. (1993). Note that the continuum component is
most likely not all in the form of amorphous carbon. Small grains of
metallic iron and/or iron sulfide have extinction properties similar
to that of carbon. Also, large grains of various dust species could
produce the observed continuum component. The abundance of amorphous
carbon is a fitting parameter. We have to realize that besides
this observable dust component, a ``hidden'' component of large grains
probably exists deep inside the disk. Information on this dust
component, which might contain most of the dust mass, can only be
obtained through millimeter observations which are currently not
available for this source. In the following we will use the term
``visible'' for the dust grains we can address with the current set of
observations.
m)
silica grains. For the shapes of the grains we use the
Distribution of Hollow Spheres (DHS,
see Min et al. 2005), as outlined in
van Boekel et al. (2005), where we refer to for further details on
the model for the silicate dust grains. In order to get the required
continuum opacity needed we added amorphous carbon grains. To model
the irregular shape of the carbon grains we also used DHS. For
the refractive index of carbon we adopted the data by
Preibisch et al. (1993). Note that the continuum component is
most likely not all in the form of amorphous carbon. Small grains of
metallic iron and/or iron sulfide have extinction properties similar
to that of carbon. Also, large grains of various dust species could
produce the observed continuum component. The abundance of amorphous
carbon is a fitting parameter. We have to realize that besides
this observable dust component, a ``hidden'' component of large grains
probably exists deep inside the disk. Information on this dust
component, which might contain most of the dust mass, can only be
obtained through millimeter observations which are currently not
available for this source. In the following we will use the term
``visible'' for the dust grains we can address with the current set of
observations.
The other free parameters all have to do with the geometry
of the disk. As a first step we focused on the thermal dust grains,
ignoring the PAH bands. The density distribution of the dust disk was
parameterized using a radial surface density
(Hughes et al. 2008)
|
(1) |
for
5.2 Fitting the SED
In order to get the observed peak over continuum ratio of the 10 and 20 micron silicate features observed in the Spitzer spectrum, we find that the mass in amorphous carbon grains has to be 25% of the total dust mass. Again, we stress that this component represents all possible sources of continuum opacity, including very large grains. Second, we constrained the parameters describing the density structure. We found that the vertical height of the disk needs to be significantly increased compared to hydrostatic equilibrium in order to obtain the large near IR excess (see also Acke et al. 2009, for a discussion on the inner rim height). The height of the disk was scaled with a factor5.3 Spatial distribution of the gas
We consider two possibilities for the spatial distribution of the gas, as traced by the PAHs (see Fig. 6). The first is to assume that the gas and the dust have the same spatial distribution in the disk. The second is to assume that the gas does not have the exponential decay of the surface density for radii larger than 2.5 AU, but that this disappearance of the dust at these radii is caused by grain growth and settling, which do not affect the gas.
The first model, which has the gas and dust in the same spatial
distribution, results in a fairly large abundance of PAH molecules
needed to explain the strength of the features seen. The PAHs are in
this case fairly well shielded from the stellar radiation by the dust
grains, and thus a large amount is needed. Furthermore, in order to
explain the absence of PAH emission in the MIDI correlated flux, we
find that we have to remove the PAHs from the inner 2 AU. The total
mass in PAHs in this case is
![]() .
This
model does not reproduce the increase in FWHM at the wavelength of the
PAH features that we found in the VISIR spectroscopic data
(see Sect. 4.5).
.
This
model does not reproduce the increase in FWHM at the wavelength of the
PAH features that we found in the VISIR spectroscopic data
(see Sect. 4.5).
The second model, which assumes the gas is distributed in a more
extended flared disk (see Fig. 6) resulted in a very
good overall fit of all the observables presented above. In this model
we put the PAHs in a disk with a similar surface density as the dust
grains but with
![]() ,
i.e. the surface density remains a
powerlaw (p = 1) for all radii. In this way we create a flaring
outer gas disk, which is able to catch much of the radiation from the
star. We find that the PAH emission is dominated entirely by the outer
regions. If the PAHs would be destroyed according to the mechanism
proposed by Dullemond et al. (2007) we find that the inner 25 AU
should be free of PAHs. However, even without destruction the
contribution to the PAH emission from these inner regions is
negligible. Thus, we cannot confirm whether or not PAH destruction
takes place in this disk. Extrapolating the powerlaw surface density
distribution of the PAHs to the inner edge (at 0.55 AU) we find that
at
,
i.e. the surface density remains a
powerlaw (p = 1) for all radii. In this way we create a flaring
outer gas disk, which is able to catch much of the radiation from the
star. We find that the PAH emission is dominated entirely by the outer
regions. If the PAHs would be destroyed according to the mechanism
proposed by Dullemond et al. (2007) we find that the inner 25 AU
should be free of PAHs. However, even without destruction the
contribution to the PAH emission from these inner regions is
negligible. Thus, we cannot confirm whether or not PAH destruction
takes place in this disk. Extrapolating the powerlaw surface density
distribution of the PAHs to the inner edge (at 0.55 AU) we find that
at
![]() the PAH abundance is 0.25% of the visible dust
mass. The total PAH mass we find is
the PAH abundance is 0.25% of the visible dust
mass. The total PAH mass we find is
![]() ,
which is large compared to the mass in visible dust grains,
because the PAH disk is so much larger. Including PAH destruction in
the inner disk would only lower the total PAH mass by 12%. Note,
that the total dust mass, including the well shielded midplane grains,
can be much higher than the mass in visible grains and the PAH
mass. This could be confirmed by future millimeter observations.
,
which is large compared to the mass in visible dust grains,
because the PAH disk is so much larger. Including PAH destruction in
the inner disk would only lower the total PAH mass by 12%. Note,
that the total dust mass, including the well shielded midplane grains,
can be much higher than the mass in visible grains and the PAH
mass. This could be confirmed by future millimeter observations.
5.4 Final model
The second model, that assumes that the PAHs do not have an exponential decay with radius, reproduces the available spatial information much better. This second model was fine-tuned to best reproduce all available observables. The position angle and inclination of the disk were constrained using the interferometric data. We find that the AMBER interferometric observations put important constraints on the parameters for the inner regions of the disk, lifting some of the degeneracies present when these data are not considered. The parameters of the final model are summarized in Table 2.Table 2: The parameters for our final model for the circumstellar disk of HD 95881.
6 Discussion
6.1 Comparison of the model with the observations
Our disk model accurately reproduces all the observables. The fits to the SED, the Spitzer spectrum, the MIDI correlated flux, the AMBER visibilities, and the VISIR spectroscopic FWHM are presented in Fig. 7.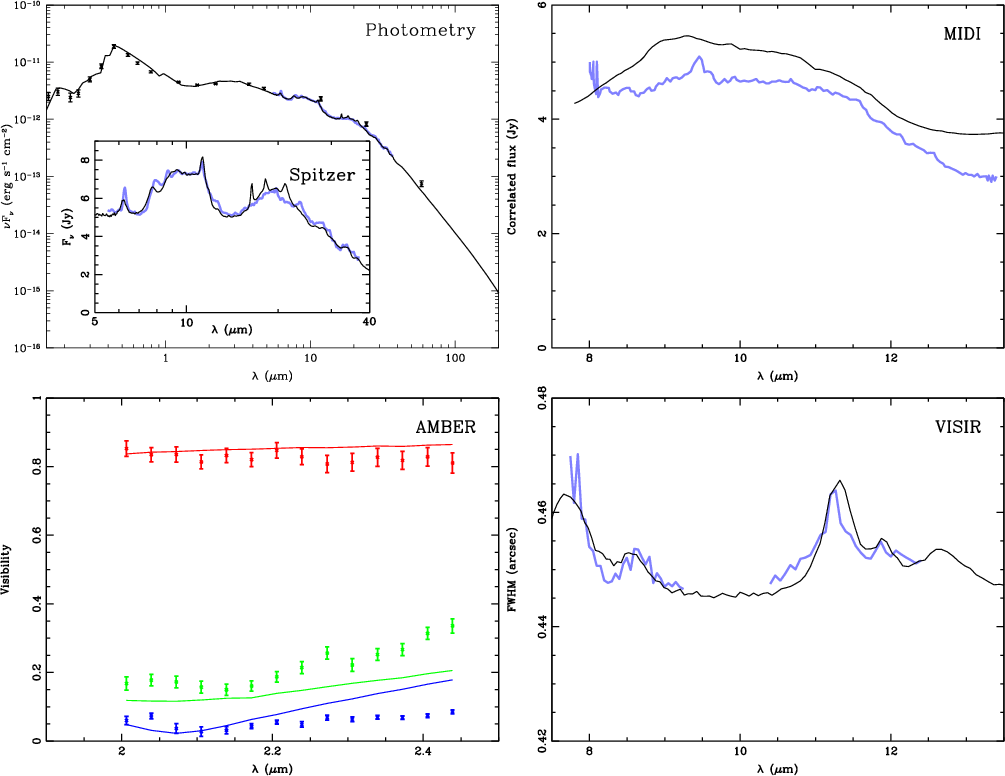
|
Figure 7: The best model fit to the observables of HD 95881. The upper left panel shows the fit to the spectral energy distribution with an inset for the Spitzer spectrum. The blue line is the observed spectrum, the black line the model spectrum and the points with error bars are photometric measurements obtained from the literature. The upper right panel shows the correlated flux as obtained by MIDI. The blue line is the observed correlated flux and the black line the model. The bottom left panel shows the visibilities obtained by AMBER. The colored lines give the model results (color coding the same as Fig. 1). The bottom right panel shows in blue the VISIR FWHM as a function of wavelength and in black the model. |
| Open with DEXTER | |
Spitzer. The general slope and most features in the Spitzer
spectrum are reproduced. However, the observed 6.2, 7.9 and 8.6 ![]() m
PAH features are stronger than in our model and the predicted PAH
features around 20
m
PAH features are stronger than in our model and the predicted PAH
features around 20 ![]() m are not seen in the Spitzer spectrum. These
differences are related to the PAH chemistry, which is a much debated
subject (see e.g. Draine & Li 2007).
m are not seen in the Spitzer spectrum. These
differences are related to the PAH chemistry, which is a much debated
subject (see e.g. Draine & Li 2007).
MIDI. The N-band correlated flux obtained by MIDI has an error on the absolute calibration of approximately 10%, similar to the difference with the model output. Thus our modeling of the spatial distribution of the visible dust grains is consistent with the MIDI result.
AMBER. The simple flat ring+point-source model of Sect. 4.1 actually reproduced the inclination, position angle and visibilities of the disk very well, although the inner rim radius (0.37 AU) is significantly below the 0.55 AU of our final model. Our more physical final model gives a slightly poorer fit to the visibilities. This indicates that the structure of the inner disk is more complicated than assumed. The exact structure is currently much debated (see Sect. 6.2).
VISIR spectrum. The model FWHM was obtained by making a
Gaussian fit to the spatial profile after convolving the model with a
Gaussian of the same width as the PSF of the VISIR 11.2 ![]() m
setting. The PSF of the 8.5
m
setting. The PSF of the 8.5 ![]() m setting was scaled to the
model. The matching continuum levels are thus a result of our
method, but the increase in the FWHM at the PAH wavelengths are a
confirmation of the correct modeling of the spatial distribution of
the PAH emission.
m setting was scaled to the
model. The matching continuum levels are thus a result of our
method, but the increase in the FWHM at the PAH wavelengths are a
confirmation of the correct modeling of the spatial distribution of
the PAH emission.
VISIR image. A model of the Q2 image was obtained by taking the
output of our model at 19.0 ![]() m, just next to the artificial PAH
feature. We convolved this model image with the VISIR PSF and we
applied a PSF subtraction in analogy to the image analysis of
Sect. 4.4. The observed resolved emission component
is not reproduced by the model. A likely explanation for this is
the photoluminescence of particles with sizes between dust grains
and PAH molecules, the so called very small grains, which are not
included in our model (see Flagey et al. 2006).
m, just next to the artificial PAH
feature. We convolved this model image with the VISIR PSF and we
applied a PSF subtraction in analogy to the image analysis of
Sect. 4.4. The observed resolved emission component
is not reproduced by the model. A likely explanation for this is
the photoluminescence of particles with sizes between dust grains
and PAH molecules, the so called very small grains, which are not
included in our model (see Flagey et al. 2006).
6.2 The distribution of gas and dust
Our modeling reveals that the spatial distribution of the gas and the dust in the disk around HD 95881 is different. The dust in the upper layers of the outer disk is heavily depleted, while the gas still has a large scale height. To reproduce the near IR flux we needed to assume a scale height, which is much larger than would be obtained from vertical hydrostatic equilibrium (The spatial distribution of the visible grain component was well
constrained by the SED. The large grains could not be constrained
directly, but are probably abundantly present in a settled outer
disk. Observations of the millimeter flux will help to constrain the
mass in this component as well as the size distribution. We can
however make an estimate of the total dust mass, based on the modeled
total PAH mass (
![]() )
and the modeled PAH
abundance at the inner edge (0.25%). Assuming that at the inner
rim all the dust is visible and assuming that the PAH to dust ratio
is homogeneous throughout the disk we find that the total dust mass
adds up to
)
and the modeled PAH
abundance at the inner edge (0.25%). Assuming that at the inner
rim all the dust is visible and assuming that the PAH to dust ratio
is homogeneous throughout the disk we find that the total dust mass
adds up to
![]() .
This means that most of the
dust mass resides in large grains (200:1). Using the canonical gas to
dust ratio of 100 the total disk mass becomes
.
This means that most of the
dust mass resides in large grains (200:1). Using the canonical gas to
dust ratio of 100 the total disk mass becomes
![]() .
Note, that if the outer disk has a
lower value of
.
Note, that if the outer disk has a
lower value of ![]() ,
a larger gas mass could be required to
reproduce the observations.
,
a larger gas mass could be required to
reproduce the observations.
The results presented above naturally lead to the picture of a disk in which the dust grains in the outer disk are coagulated and settled towards the midplane, while the gas is still available to keep the PAH molecules in the higher atmosphere of the disk. As already noted in the theoretical study by Dullemond et al. (2007), growth and settling of the dust grains leads to a natural increase of the relative strength of the PAH signature, as is observed in this disk and confirmed by our modeling effort.
6.3 Context
In general the study of Dullemond et al. (2007) showed that the natural outcome of a group I source after grain-growth and sedimentation of the dust is a group II source, that maintains the flaring structure for the gas. However, observational studies have shown that most group II sources lack a flaring gas distribution. Meeus et al. (2001), Acke et al. (2010,2004) showed that group I sources display significantly more PAH emission. Acke et al. (2005) showed that group I sources have in general stronger [O I] emission. Apparently the gas of most group II sources has either dramatically decreased its scale height because of the lack of heating or the gas has been dispersed from the disk. How disks can lose their gas is currently being debated (see Hillenbrand 2008), but photoevaporation seems to be the most likely mechanism.On the other hand there is a fair number of group II sources that do
show indications of a flaring gas distribution. Some group II sources
display PAH emission in their 10 ![]() m spectra, for example:
HD 95881 (van Boekel et al. 2005) and
HD 95881 (Verhoeff et al. 2010). Some group II
sources display the [O I] 6300 Å line in emission, for example:
HD 95881 (Acke et al. 2005). And some show
both PAH and [O I] emission, for example: HD 95881
(Fedele et al. 2008). These sources all seem to be in a
transitional phase from a gas rich flaring disk to a gas poor
self-shadowed disk. Roughly half of the known group II sources are in
this phase, which means we can infer that half of the life time of the
disk of a group II source is spent on the dispersal of the gas. An
estimate for this time scale is the photoevaporation time scale,
which is on the order of
m spectra, for example:
HD 95881 (van Boekel et al. 2005) and
HD 95881 (Verhoeff et al. 2010). Some group II
sources display the [O I] 6300 Å line in emission, for example:
HD 95881 (Acke et al. 2005). And some show
both PAH and [O I] emission, for example: HD 95881
(Fedele et al. 2008). These sources all seem to be in a
transitional phase from a gas rich flaring disk to a gas poor
self-shadowed disk. Roughly half of the known group II sources are in
this phase, which means we can infer that half of the life time of the
disk of a group II source is spent on the dispersal of the gas. An
estimate for this time scale is the photoevaporation time scale,
which is on the order of ![]() 106 yr
(Gorti & Hollenbach 2009)
106 yr
(Gorti & Hollenbach 2009)
7 Conclusions
A comprehensive study was performed to map the distribution of the gas and dust in the protoplanetary disk around HD 95881. In the right panel of Fig. 6 we displayed a schematic representation of the disk, which puts all results in perspective. The AMBER K-band interferometry showed that there is an extended hot inner region with emission coming from well within the sublimation radius. The detection of the [O I] 6300 Å indicated that the disk has a flaring gas surface at large distances (from one to tens of AU) from the star. The finding of PAH features in the Spitzer and VISIR spectra confirmed the presence of an illuminated gas surface. The resolved VISIR spectrum traced this surface up to radii ofWe used the radiative transfer code MCMax (Min et al. 2009) to create a model of the disk's density and temperature structure. Our model satisfactorily reproduced all of our observations. The main conclusions that followed from our model are that the inner disk contains most of the visible grains and has a puffed up inner rim, the dust grains in the outer disk have coagulated and settled towards the midplane, while the gas and PAH mixture maintain a flaring geometry. Theory predicted the existence of these type of disks (Dullemond et al. 2007), while observational trends showed that most of the sources with self-shadowed dust distributions have dispersed the bulk of their gas. In this light HD 95881 is a special source: it is in the transition phase from a gas rich flaring dust disk to a gas poor self-shadowed disk.
AcknowledgementsThis research was sponsored by NWO under grant number 614.000.411. M. Min acknowledges financial support from the Netherlands Organization for Scientific Research (NWO) through a Veni grant. E. Pantin acknowledges financial support from the Agence Nationale de la Recherche (ANR) of France through contract ANR-07-BLAN-0221.
References
- Acke, B., & van den Ancker, M. E. 2004, A&A, 426, 151 [NASA ADS] [CrossRef] [EDP Sciences] [Google Scholar]
- Acke, B., van den Ancker, M. E., Dullemond, C. P., van Boekel, R., & Waters, L. B. F. M. 2004, A&A, 422, 621 [NASA ADS] [CrossRef] [EDP Sciences] [Google Scholar]
- Acke, B., van den Ancker, M. E., & Dullemond, C. P. 2005, A&A, 436, 209 [NASA ADS] [CrossRef] [EDP Sciences] [Google Scholar]
- Acke, B., Verhoelst, T., van den Ancker, M. E., et al. 2008, A&A, 485, 209 [NASA ADS] [CrossRef] [EDP Sciences] [Google Scholar]
- Acke, B., Min, M., van den Ancker, M. E., et al. 2009, A&A, 502, L17 [NASA ADS] [CrossRef] [EDP Sciences] [Google Scholar]
- Acke, B., Bouwman, J., Juhász, A., et al. 2010, ApJ, accepted [arXiv:1006.1130] [Google Scholar]
- Benisty, M., Natta, A., Isella, A., et al. 2010, A&A, 511, A74 [NASA ADS] [CrossRef] [EDP Sciences] [Google Scholar]
- de Zeeuw, P. T., Hoogerwerf, R., de Bruijne, J. H. J., Brown, A. G. A., & Blaauw, A. 1999, AJ, 117, 354 [NASA ADS] [CrossRef] [Google Scholar]
- Draine, B. T., & Li, A. 2001, ApJ, 551, 807 [NASA ADS] [CrossRef] [Google Scholar]
- Draine, B. T., & Li, A. 2007, ApJ, 657, 810 [NASA ADS] [CrossRef] [Google Scholar]
- Dullemond, C. P., & Dominik, C. 2004, A&A, 417, 159 [NASA ADS] [CrossRef] [EDP Sciences] [Google Scholar]
- Dullemond, C. P., Dominik, C., & Natta, A. 2001, ApJ, 560, 957 [NASA ADS] [CrossRef] [Google Scholar]
- Dullemond, C. P., Apai, D., & Walch, S. 2006, ApJ, 640, L67 [NASA ADS] [CrossRef] [Google Scholar]
- Dullemond, C. P., Henning, T., Visser, R., et al. 2007, A&A, 473, 457 [NASA ADS] [CrossRef] [EDP Sciences] [Google Scholar]
- Eisner, J. A., Lane, B. F., Hillenbrand, L. A., Akeson, R. L., & Sargent, A. I. 2004, ApJ, 613, 1049 [NASA ADS] [CrossRef] [Google Scholar]
- Eisner, J. A., Chiang, E. I., Lane, B. F., & Akeson, R. L. 2007, ApJ, 657, 347 [NASA ADS] [CrossRef] [Google Scholar]
- Fedele, D., van den Ancker, M. E., Acke, B., et al. 2008, A&A, 491, 809 [NASA ADS] [CrossRef] [EDP Sciences] [MathSciNet] [Google Scholar]
- Flagey, N., Boulanger, F., Verstraete, L., et al. 2006, A&A, 453, 969 [NASA ADS] [CrossRef] [EDP Sciences] [Google Scholar]
- Geers, V. C., van Dishoeck, E. F., Visser, R., et al. 2007, A&A, 476, 279 [NASA ADS] [CrossRef] [EDP Sciences] [Google Scholar]
- Gorti, U., & Hollenbach, D. 2009, ApJ, 690, 1539 [Google Scholar]
- Guhathakurta, P., & Draine, B. T. 1989, ApJ, 345, 230 [NASA ADS] [CrossRef] [Google Scholar]
- Hillenbrand, L. A. 2008, Physica Scripta Volume T, 130, 014024 [Google Scholar]
- Houk, N., & Cowley, A. P. 1975, Michigan Catalogue of two-dimensional spectral types for the HD star (Ann Arbor: University of Michigan, Departement of Astronomy) [Google Scholar]
- Hughes, A. M., Wilner, D. J., Qi, C., & Hogerheijde, M. R. 2008, ApJ, 678, 1119 [NASA ADS] [CrossRef] [Google Scholar]
- Isella, A., Tatulli, E., Natta, A., & Testi, L. 2008, A&A, 483, L13 [NASA ADS] [CrossRef] [EDP Sciences] [Google Scholar]
- Isella, A., Carpenter, J. M., & Sargent, A. I. 2009, ApJ, 701, 260 [NASA ADS] [CrossRef] [Google Scholar]
- Juhász, A., Bouwman, J., & Henning, T. 2010, ApJ, submitted [Google Scholar]
- Kraus, S., Preibisch, T., & Ohnaka, K. 2008, ApJ, 676, 490 [NASA ADS] [CrossRef] [Google Scholar]
- Lagage, P. O., Pel, J. W., Authier, M., et al. 2004, The Messenger, 117, 12 [NASA ADS] [Google Scholar]
- Lagage, P.-O., Doucet, C., Pantin, E., et al. 2006, Science, 314, 621 [NASA ADS] [CrossRef] [PubMed] [Google Scholar]
- Leinert, C., Graser, U., Waters, L. B. F. M., et al. 2003, in Interferometry for Optical Astronomy II, ed. W. A. Traub, Proc. SPIE, 4838, 893 [Google Scholar]
- Leinert, C., van Boekel, R., Waters, L. B. F. M., et al. 2004, A&A, 423, 537 [NASA ADS] [CrossRef] [EDP Sciences] [Google Scholar]
- Meeus, G., Waters, L. B. F. M., Bouwman, J., et al. 2001, A&A, 365, 476 [NASA ADS] [CrossRef] [EDP Sciences] [Google Scholar]
- Meynet, G., Maeder, A., Schaller, G., Schaerer, D., & Charbonnel, C. 1994, A&AS, 103, 97 [NASA ADS] [Google Scholar]
- Min, M., Hovenier, J. W., & de Koter, A. 2005, A&A, 432, 909 [NASA ADS] [CrossRef] [EDP Sciences] [Google Scholar]
- Min, M., Dullemond, C. P., Dominik, C., de Koter, A., & Hovenier, J. W. 2009, A&A, 497, 155 [NASA ADS] [CrossRef] [EDP Sciences] [Google Scholar]
- Pantin, E., Doucet, C., Käufl, H. U., et al. 2008, in SPIE Conf. Ser., 7014, 701424 [Google Scholar]
- Pantin, E., Siebenmorgen, R., Käufl, H. U., & Sterzik, M. 2009, in Science with the VLT in the ELT Era, ed. A. Moorwood, Ap&SS Proc. (Springer), 261 [Google Scholar]
- Preibisch, T., Ossenkopf, V., Yorke, H. W., & Henning, T. 1993, A&A, 279, 577 [NASA ADS] [Google Scholar]
- Siebenmorgen, R., Kruegel, E., & Mathis, J. S. 1992, A&A, 266, 501 [NASA ADS] [Google Scholar]
- Tannirkulam, A., Monnier, J. D., Harries, T. J., et al. 2008a, ApJ, 689, 513 [NASA ADS] [CrossRef] [Google Scholar]
- Tannirkulam, A., Monnier, J. D., Millan-Gabet, R., et al. 2008b, ApJ, 677, L51 [NASA ADS] [CrossRef] [Google Scholar]
- Tatulli, E., Millour, F., Chelli, A., et al. 2007, A&A, 464, 29 [NASA ADS] [CrossRef] [EDP Sciences] [Google Scholar]
- van Boekel, R., Waters, L. B. F. M., Dominik, C., et al. 2004, A&A, 418, 177 [NASA ADS] [CrossRef] [EDP Sciences] [Google Scholar]
- van Boekel, R., Min, M., Waters, L. B. F. M., et al. 2005, A&A, 437, 189 [NASA ADS] [CrossRef] [EDP Sciences] [Google Scholar]
- van der Plas, G., van den Ancker, M. E., Fedele, D., et al. 2008, A&A, 485, 487 [NASA ADS] [CrossRef] [EDP Sciences] [Google Scholar]
- Verhoeff, A. P., Waters, L. B. F. M., Veerman, H., et al. 2010, A&A, submitted [Google Scholar]
Footnotes
- ... disk?
- Based on observations collected at the European Southern Observatory, Chile. Under program IDs: 060.A9234A, 076.C-0159A, 077.C-0367A, 078.C-0281.
- ...
- Postdoctoral Fellow of the Fund for Scientific Research, Flanders.
All Tables
Table 1: Characterizing parameters of HD 95881.
Table 2: The parameters for our final model for the circumstellar disk of HD 95881.
All Figures
|
|
Figure 1: The AMBER K-band visibilities of HD 95881. The projected length and position angle of the baselines is indicated on the left. Overplotted is the best-fit ring+point-source model (solid lines; see text). |
| Open with DEXTER | |
| In the text | |
|
|
Figure 2: The continuum-normalized [O I] 6300 Å emission line of HD 95881 (Acke et al. 2005). The velocity axis has been centered on the centroid position of the feature, i.e. the radial velocity of the central star. Line profiles corresponding to a surface brightness proportional to r-3 are overplotted. Red represents a model with an outer radius beyond 31 AU; yellow corresponds to the model with an outer radius equal to 11 AU. See text for details. |
| Open with DEXTER | |
| In the text | |
| |
Figure 3:
The Spitzer LR spectrum of HD 95881 (
|
| Open with DEXTER | |
| In the text | |
|
|
Figure 4:
Surface brightness levels as a function of distance from the
star in the Q2 image after point source subtraction. The error
bars give the 3 |
| Open with DEXTER | |
| In the text | |
|
|
Figure 5:
The top panel shows the VISIR N-band spectrum of
HD 95881 (black). Overplotted are the Spitzer spectrum
(thick green), the correlated flux as measured with MIDI
(dotted blue), and the difference between the Spitzer and MIDI
spectra (orange). The Spitzer spectrum represents the entire
disk, the MIDI correlated flux spectrum represents the inner disk (
|
| Open with DEXTER | |
| In the text | |
|
|
Figure 6: Schematic depiction of the two considered disk models. First we consider a spatial distribution that is the same for both the dust and the gas. Second we consider a model that assumes that the surface density of the gas decays much slower with distance from the star. In this second model we indicated the different regions of the disk that are probed by the observations discussed in this paper. |
| Open with DEXTER | |
| In the text | |
|
|
Figure 7: The best model fit to the observables of HD 95881. The upper left panel shows the fit to the spectral energy distribution with an inset for the Spitzer spectrum. The blue line is the observed spectrum, the black line the model spectrum and the points with error bars are photometric measurements obtained from the literature. The upper right panel shows the correlated flux as obtained by MIDI. The blue line is the observed correlated flux and the black line the model. The bottom left panel shows the visibilities obtained by AMBER. The colored lines give the model results (color coding the same as Fig. 1). The bottom right panel shows in blue the VISIR FWHM as a function of wavelength and in black the model. |
| Open with DEXTER | |
| In the text | |
Copyright ESO 2010
Current usage metrics show cumulative count of Article Views (full-text article views including HTML views, PDF and ePub downloads, according to the available data) and Abstracts Views on Vision4Press platform.
Data correspond to usage on the plateform after 2015. The current usage metrics is available 48-96 hours after online publication and is updated daily on week days.
Initial download of the metrics may take a while.