


| Issue |
A&A
Volume 712, August 2026
|
|
|---|---|---|
| Article Number | A27 | |
| Number of page(s) | 12 | |
| Section | Extragalactic astronomy | |
| DOI | https://doi.org/10.1051/0004-6361/202660238 | |
| Published online | 31 July 2026 | |
Ram-pressure signatures in the dwarf irregular galaxy Sextans B revealed by deep MeerKAT H I observations
1
Instituto de Astrofísica de Andalucía (CSIC), Glorieta de la Astronomía s/n, 18008 Granada, Spain
2
LIRA, Observatoire de Paris, Université PSL, CNRS, 92190 Meudon, France
3
Department of Astronomy, University of Cape Town, Private Bag X3 Rondebosch 7701, South Africa
4
Département de physique, Université de Montréal, Complexe des sciences MIL, 1375 Avenue Thérèse-Lavoie-Roux, Montréal, QC H2V 0B3, Canada
5
Observatoire d’Astrophysique de l’Université Ouaga I Pr Joseph Ki-Zerbo (ODAUO), BP 7021 Ouaga 03, Burkina Faso
6
Max-Planck-Institut für Radioastronomie Radioobservatorium Effelsberg, Max-Planck-Strasse 28, 53902 Bad Münstereife, Germany
7
Centre for Radio Astronomy Techniques and Technologies (RATT), Department of Physics and Electronics, Rhodes University, Makhanda 6140, South Africa
8
Local Universe and Time-Domain Astronomy Laboratory, Department of Astronomy, China West Normal University, Nanchong 637002, China
9
Research Center for Computational Earth and Space Science, Zhejiang Laboratory, Hangzhou 311121, China
10
The Copperbelt University, Jambo Drive, Riverside, P.o.Box 21692 Kitwe, Zambia
★ Corresponding author: This email address is being protected from spambots. You need JavaScript enabled to view it.
Received:
3
April
2026
Accepted:
16
June
2026
Abstract
Context. The impact of extremely low-density environments such as the diffuse intergalactic medium (IGM) on the neutral gas distribution of dwarf galaxies remains poorly explored observationally.
Aims. We present deep MeerKAT H I 21 cm observations of the Local Group dwarf irregular galaxy Sextans B that achieve a spectral resolution of 1.4 km s−1 and reach column-density sensitivities down to NHI ∼ 3.3 × 1018 cm−2, allowing us to trace the extended H I disc and faint outer structures with high sensitivity.
Methods. We analysed the H I distribution and compared it with the stellar component. Three-dimensional kinematic modelling of the H I cube was performed using TiRiFiC. We performed hydrodynamical simulations tailored to Sextans B, which show that the IGM ram-pressure acting on the outer gas disc can produce asymmetric gas distributions, filamentary structures, and kinematic perturbations.
Results. The low-column-density H I distribution is asymmetric and reveals a remarkable filamentary structure arranged in a rosette superposed on the H I disc. A comparison with the stellar distribution shows spatial offsets between the gaseous and stellar components, with the stellar disc remaining relatively symmetric and the H I envelope becoming increasingly disturbed. Three-dimensional kinematic modelling of the H I cube using TiRiFiC reproduces the global velocity gradient but reveals systematic differences between the approaching and receding sides of the rotation curve at large radii, indicating that the outer velocity field departs from simple axisymmetric rotation. While stellar feedback can produce small-scale cavities and turbulence in dwarf galaxies, it cannot generate the H I filamentary structure, the large-scale asymmetric outer H I envelope, or the systematic divergence between the approaching and receding rotation curves observed here. This is consistent with the effects expected from interaction with a diffuse IGM.
Conclusions. The combination of morphological and kinematic signatures therefore suggests that the outer H I disc of Sextans B is affected by a ram-pressure interaction with the diffuse IGM in the outskirts of the Local Group. This is the second strong example in the Local Group, after WLM, showing that even a very low-density IGM can significantly influence the gas distribution and kinematics in the outer parts of dwarf galaxies.
Key words: galaxies: dwarf / galaxies: interactions / galaxies: irregular / galaxies: kinematics and dynamics
© The Authors 2026
 Open Access article, published by EDP Sciences, under the terms of the Creative Commons Attribution License (https://creativecommons.org/licenses/by/4.0), which permits unrestricted use, distribution, and reproduction in any medium, provided the original work is properly cited.
This article is published in open access under the Subscribe to Open model. This email address is being protected from spambots. You need JavaScript enabled to view it. to support open access publication.
1. Introduction
Dwarf galaxies in the Local Group experience a wide range of environmental conditions, ranging from satellites embedded within the halos of massive galaxies to systems residing in the low-density outskirts of the group (McConnachie 2012). Owing to their shallow gravitational potentials, dwarf irregular galaxies are particularly sensitive to external perturbations, making them valuable probes of environmental processes operating across a wide range of gas-density regimes. Environmental effects on dwarf galaxies have long been studied in dense environments such as galaxy clusters, where ram-pressure stripping and tidal interactions can strongly affect the structure and dynamics of the interstellar medium (Boselli & Gavazzi 2006; Steyrleithner et al. 2020). Similar environmental processes have also been investigated within the circumgalactic halos of massive galaxies, including the Milky Way, where interactions with the surrounding medium can influence the evolution of dwarf systems (Wang et al. 2024). In contrast, the potential influence of extremely low-density environments, such as the diffuse intergalactic medium (IGM) that surrounds the Local Group, remains much less explored observationally.
Environmental interactions occur within several distinct gaseous media characterised by markedly different densities. These environments form a hierarchy that includes the dense intracluster medium (ICM) in galaxy clusters, the intra-group gas medium in galaxy groups, the circumgalactic medium (CGM) surrounding massive galaxies, and finally the extremely diffuse IGM. In rich galaxy clusters, interaction with the ICM (n ≳ 10−3–10−2 cm−3) can efficiently remove large fractions of a galaxy’s interstellar medium through classical ram-pressure stripping (Gunn & Gott 1972; Boselli & Gavazzi 2006). Such processes are thought to play an important role in the transformation of dwarf galaxies in clusters.
In galaxy groups and around massive galaxies such as the Milky Way, satellite systems are embedded within extended hot circumgalactic halos (CGM; n ∼ 10−5–2 10−4 cm−3) at galactocentric distances of tens to hundreds of kiloparsecs (Kalberla & Haud 2006; Grcevich & Putman 2009; Miller & Bregman 2013). This halo environment is thought to play a central role in shaping the evolution of satellite galaxy populations. This influence is reflected in the strong contrast between the gas-poor dwarf spheroidal satellites surrounding the Milky Way and the gas-rich dwarf irregular galaxies typically found at larger distances from the Galaxy, consistent with the well-known morphology–density relation (McConnachie 2012). The CGM is also thought to influence large gaseous structures such as the Magellanic Stream (Hammer et al. 2015; Wang et al. 2019).
These environments span several orders of magnitude in gas density and therefore correspond to different regimes of hydrodynamical interaction, from strong stripping in clusters to weaker perturbations in group and intergalactic environments. Dwarf galaxies in loose groups may also interact with a low-density intra-group medium, representing an intermediate-density environment between the CGM of individual galaxies and the diffuse IGM, with typical densities of n ∼ 10−6–10−5 cm−3. Beyond the virial radii of massive galaxies, the gas density declines further into the IGM of the Local Group, where typical densities are expected to be significantly lower (n ≲ 10−6–10−5 cm−3; Bureau & Carignan 2002; Yang et al. 2022). In this low-density regime, the dynamical impact on isolated dwarf galaxies remains uncertain, although they have been explored by Kolhe et al. (2026).
Internal processes such as stellar feedback are widely recognised as the primary drivers of small-scale structure in the interstellar medium of dwarf irregular galaxies, producing cavities, shells, and turbulent gas motions in the neutral gas (Puche et al. 1992; Walter & Brinks 1999; Bagetakos et al. 2011; Hammer et al. 2015). However, because dwarf galaxies possess shallow gravitational potentials, their outer low-column-density gas is particularly vulnerable to external perturbations.
Deep interferometric studies of nearby dwarf galaxies have revealed a variety of H I structures, including asymmetric envelopes, one-sided truncations, gas–star offsets, and filamentary extensions that potentially reflect environmental interactions (Bureau & Carignan 2002; Putman et al. 2021). Although many of these features are typically attributed to internal processes such as stellar feedback or turbulence (Putman et al. 2021), interactions with a diffuse ambient medium can also contribute to shaping the outer gas morphology in some systems (Bureau & Carignan 2002; Yang et al. 2022). However, direct observational evidence of a significant influence of such low-density media on the H I structure of isolated dwarf galaxies remains limited.
The possibility that the extremely low-density IGM affects both the gas distribution and the kinematics of isolated dwarf irregular galaxies has only recently begun to be explored. Deep Meer Karoo Array Telescope (MeerKAT) observations of the isolated dwarf galaxy Wolf–Lundmark–Melotte (WLM) revealed extended low-column-density H I features aligned with its motion; they were interpreted as being consistent with a mild ram-pressure interaction with a diffuse Local Group medium (Yang et al. 2022). Subsequent kinematic analysis revealed systematic differences between the approaching and receding sides of the disc, suggesting that interaction with a diffuse medium can also perturb the outer velocity field (Kolhe et al. 2026). These results suggest that even very weak ram pressure, acting over long timescales, can gradually influence the outer gas discs of dwarf galaxies in low-density environments.
Galaxies located in the outskirts of the Local Group provide suitable laboratories for testing this scenario, as tidal interactions are expected to be weak while sensitivity to diffuse ambient gas remains high. Sextans B is a gas-rich dwarf irregular galaxy located at a distance of 1.36 Mpc (Kniazev et al. 2005). It lies in the Local Group outskirts near other dwarf galaxies such as Sextans A and NGC 3109; they are located at similar distances of approximately 1.3–1.4 Mpc (Dolphin et al. 2003; Soszyński et al. 2006) but do not constitute a bound galaxy group. The relative isolation of Sextans B minimises the likelihood of strong tidal perturbations, placing it in a regime where any environmental influence would most plausibly result from an interaction with a low-density CGM, intra-group medium, or IGM.
Previous H I studies of Sextans B reported an extended rotating gas disc with a largely regular global morphology and a rising rotation curve (Hunter et al. 2012; Namumba et al. 2018). KAT-7 observations identified global kinematic differences between the approaching and receding sides of the disc, together with multiple H I holes attributed to stellar feedback (Namumba et al. 2018). However, the limited angular resolution and surface-brightness sensitivity of earlier data prevented a detailed investigation of the faint, low-column-density outer gas, where signatures of weak environmental interactions are expected to emerge.
The deep MeerKAT observations presented here reach H I column densities below 1018 cm−2 and provide sub-kiloparsec resolution, enabling us to trace the extended H I disc of Sextans B, identify faint asymmetric and filamentary structures, compare the distributions of stars and neutral gas, and perform three-dimensional kinematic modelling of the data cube. By combining morphological and dynamical signatures with hydrodynamical expectations for weak ram-pressure interactions, we tested whether the observed properties of Sextans B are consistent with an interaction between its H I disc and a diffuse ambient medium in the outskirts of the Local Group.
The structure of the paper is as follows: Section 2 describes relevant properties of the target galaxy. Section 3 details observations and data reduction. Section 4 presents the H I morphology, comparison with stellar distributions, and filament analysis. Section 5 discusses the three-dimensional kinematic modelling. Section 6 compares the observations with ram-pressure simulations, and Sect. 7 discusses the implications for dwarf galaxy evolution. Section 8 summarises our conclusions.
2. Target galaxy: Sextans B
Sextans B (DDO 70, UGC 5373) was selected as the target of this study to investigate the impact of low-density environmental processes on the neutral gas distribution and kinematics of dwarf irregular galaxies. Sextans B is a gas-rich dwarf irregular galaxy of morphological type IBm (de Vaucouleurs et al. 1991) located on the outskirts of the Local Group, near the galaxies NGC 3109 and Sextans A. At a distance of 1.36 ± 0.07 Mpc (Kniazev et al. 2005), it resides in a regime where strong tidal interactions with massive galaxies are expected to be minimal, making it well suited for investigating subtle environmental effects such as interaction with a diffuse intra-group medium or IGM.
Previous H I studies revealed an extended neutral gas disc with a largely regular morphology and a rising rotation curve, together with multiple H I holes attributed to stellar feedback (Hunter et al. 2012). However, the limited angular resolution and surface-brightness sensitivity of previous observations prevented a detailed investigation of faint, low-column-density gas in the outer regions of the disc, where signatures of weak environmental interaction are expected to be detectable.
Sextans B is therefore a suitable target for probing possible low-level ram-pressure effects in a low-density environment, as its relative isolation minimises tidal perturbations while its extended H I disc provides enhanced sensitivity to interaction with surrounding diffuse gas. Deep optical imaging from the Large Binocular Telescope (LBT) in the g and r bands (Bellazzini et al. 2014), where details of the observational setup and exposure times are provided, provides resolved stellar density maps, enabling a direct comparison between the spatial distributions of stars and neutral hydrogen. These data, combined with the high sensitivity and sub-kiloparsec spatial resolution of MeerKAT, allow us to trace faint outer H I structures, identify possible filamentary features, and perform detailed three-dimensional kinematic modelling of the H I data cube, which was not possible with previous observations. The adopted global properties of Sextans B used in this work are summarised in Table 1.
Key parameters of Sextans B.
3. MeerKAT observations and data reduction
H I 21 cm line observations of Sextans B were obtained with the MeerKAT radio telescope (Jonas & MeerKAT Team 2016; Camilo et al. 2018) under project SCI-20220822-BN-01 (PI: B. Namumba). The galaxy was observed using the L-band receivers for approximately three hours of on-source integration time on 15–16 December 2022. Observations were carried out using the NE107M narrowband mode, which provides a 107 MHz bandwidth with 3.3 kHz channel spacing (≈0.7 km s−1). Before data reduction, data were spectrally averaged over two channels, resulting in a final spectral resolution of 1.4 km s−1.
Data reduction was performed using the CARAcal pipeline (Józsa et al. 2020), which includes standard processing steps such as radio-frequency interference (RFI) flagging, calibration, continuum subtraction, and imaging. Automated RFI flagging was carried out with AOFlagger (Offringa 2010; Offringa et al. 2012). Bandpass and flux calibration were derived from the primary calibrator using the MeerKAT flux-density scale, whereas time-dependent complex gains were obtained from interleaved phase-calibrator scans. Data quality was verified through visual inspection of diagnostic plots at each processing stage. Continuum emission was removed in the uv-plane using a first-order polynomial fit to line-free channels.
Imaging of the H I data cubes was performed with WSClean (Offringa et al. 2014; Offringa & Smirnov 2017) within CARAcal. A two-step imaging strategy was adopted. First, a low-resolution cube with a 90″ Gaussian uv taper was produced to generate a source mask using SoFiA-2 (Westmeier et al. 2021). This mask was subsequently applied during deconvolution of the final data cubes, where multi-scale cleaning was used to ensure sensitivity to emission on all spatial scales. To fully exploit MeerKAT’s angular resolution and surface-brightness sensitivity, three cubes were produced with beam sizes ranging from ∼9″ to 67″, using Briggs robust weighting (r = 0 and r = 0.5) combined with Gaussian uv tapering. The resulting datasets reach H I column-density sensitivities of NHI ∼ 1020–1018 cm−2 (3σ, over 20 km s−1). The observational setup and imaging parameters are summarised in Table 2.
Observations and properties of H I cubes for Sextans B.
Moment maps for Sextans B were derived from the calibrated H I data cubes using SoFiA-2. Signal detection employed the smooth+clip algorithm, with spatial kernels at the native resolution and 4 pixels, and spectral kernels at the native resolution, 9 channels (∼12.6 km s−1), and 25 channels (∼35 km s−1). A clipping threshold of 4σ was applied, with detections required to span at least five spatial pixels and eight spectral channels. The 4σ threshold was adopted to minimise contamination from noise peaks while preserving low-column-density emission in the outer disc. A reliability threshold of 0.8 was imposed to retain only statistically significant emission. Zeroth-, first-, and second-moment maps were generated from the resulting masks. A stricter intensity mask was applied when computing the moment-1 and moment-2 maps to minimise spurious high-velocity and high-dispersion pixels introduced by noise in low signal-to-noise regions. The moment maps are presented in Sect. 4.
4. H I distribution and morphology
The MeerKAT observations reveal an extended H I disc in Sextans B that is detected over a wide range of spatial scales (Fig. 1). To search for low-column-density features in the outer regions, we primarily used the low-resolution H I column-density maps, which are optimised for surface-brightness sensitivity. The lowest-resolution cube (∼69″ beam) reaches a 3σ sensitivity of NHI ≈ 3.3 × 1018 cm−2 over 20 km s−1, enabling the detection of diffuse neutral gas at large galactocentric radii. At these column densities, the H I disc extends well beyond the main stellar body, reaching projected radii of ∼1.5 kpc along the major axis. This corresponds to approximately twice the optical half-light radius of Sextans B (re ≈ 0.75 kpc; Bellazzini et al. 2014), adopting the same distance as in this work. This increased extent at a lower resolution reflects the use of a larger beam that smooths the emission and reduces small-scale structure, making the same gas distribution appear more extended, while the total flux remains unchanged. At different spatial resolutions, the H I distribution shows a systematic asymmetry across the disc, with the emission extending further towards the west than on the opposite side.
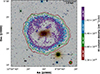 |
Fig. 1. MeerKAT H I column density contours from multiple angular-resolution cubes of Sextans B overlaid on DECaLS gri composite images. This optical image is included for visual reference only and is not a deep optical map (see Fig. 2 for the deeper imaging used for the comparison). Each contour corresponds to the 3σ column density sensitivity of the respective cube. The colour bar indicates the beam size associated with each resolution. The ellipses in the lower-right corner show the synthesised beams, and the black horizontal line indicates the physical scale (in kpc). |
4.1. MeerKAT high-resolution H I maps
The highest-resolution MeerKAT maps (Fig. 2) reveal the detailed internal structure of the H I disc in Sextans B. The integrated intensity map (panel a) shows a centrally concentrated distribution with pronounced substructure, including several well-defined H I cavities embedded within clumpy high-column-density gas. These cavities are irregular in shape and size, with typical diameters of approximately 0.7–0.75 kpc. The gas forms a prominent central peak surrounded by patchy emission and structured density gradients. Such substructures are likely related to stellar feedback processes, although external perturbations or gas inflow cannot be excluded as contributing factors. This fine-scale morphology, characterised by significant internal complexity and localised clumps, was not resolved in the previous lower-resolution KAT-7 observations (Namumba et al. 2018).
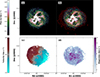 |
Fig. 2. Highest-resolution MeerKAT H I maps of Sextans B. Panel (a): Integrated H I intensity (moment 0). Panel (b): Optical stellar emission (red contours, in arbitrary units) overlaid on the H I moment 0 map. The contours are at 5, 10, 20, 40, 80, and 100σ above the background noise (σ) of the optical image. Panel (c): Intensity-weighted velocity field (moment 1). Panel (d): Velocity dispersion map (moment 2). The maps show a centrally concentrated H I disc with a pronounced internal structure, including multiple cavities embedded in clumpy high-column-density gas, together with small-scale structure extending into the outer regions. |
At this resolution, H I emission is detected across most of the disc, with the outer regions appearing increasingly fragmented. The intensity-weighted velocity field (panel c) exhibits a smooth large-scale velocity gradient across the galaxy, with localised distortions in the inner disc that spatially coincide with regions of complex H I structure, including cavities, clumpy emission, and locally enhanced velocity dispersion. The velocity dispersion map (panel d) shows values ranging from ∼6 to ∼30 km s−1. A detailed analysis of the H I kinematics based on the moment 1 and moment 2 maps is presented in Sect. 5.
The integrated H I spectrum of Sextans B is shown in Fig. 3. The profile is relatively narrow and symmetric. The MeerKAT data yield an integrated flux of 104.5 ± 1.5 Jy km s−1, corresponding to an H I mass of (4.6 ± 0.07)×107 M⊙ at a distance of 1.36 Mpc. The H I mass was computed using the relation from Pickering et al. (1997):

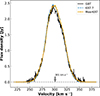 |
Fig. 3. Integrated H I spectrum of Sextans B from MeerKAT (orange), compared with KAT-7 (blue; Namumba et al. 2018) and single-dish measurements (black; Springob et al. 2005; Hunter et al. 2012). The arrow indicates the systemic velocity derived in Sect. 5. The horizontal dashed grey line marks the zero level. The profile is extracted from the mid-resolution data cube. |
where D is the distance in Mpc and ∫Sv dv is the integrated flux density in Jy km s−1. We measure linewidths of W20 = 59.5 ± 1.4 km s−1 and W50 = 38.8 ± 2.1 km s−1, which are consistent with previous KAT-7 measurements (Namumba et al. 2018). A comparison of the global H I properties derived from KAT-7 and MeerKAT is presented in Table 3.
Comparison of H I properties of Sextans B from KAT-7 and MeerKAT.
4.2. Comparison of the H I and stellar discs
Figure 2b shows optical stellar density contours (red) adapted from Bellazzini et al. (2014), overlaid on the highest-resolution H I integrated intensity map. Although the stellar and H I components share a common central peak, their outer distributions differ markedly. The stellar disc appears relatively smooth and symmetric, whereas the neutral gas shows pronounced small-scale structure and an asymmetric radial extent. In particular, the stellar disc extends beyond the detectable H I emission on the western side of the galaxy, while on the eastern side the H I and stellar distribution reach comparable projected radii.
One-sided truncations of H I discs relative to the stellar distribution are often observed in systems that may be experiencing interaction with an external gaseous medium. Beyond the main stellar body, the H I distribution remains structured, with localised enhancements and irregular features, whereas the stellar contours become sparse. This asymmetric gas–star configuration suggests that the low-column-density H I is more strongly affected than the stellar component, consistent with expectations for environmental processes acting preferentially on the diffuse neutral gas. This may occur if the outer low-density gas is displaced by interaction with an external medium, while the stellar component remains largely unaffected due to its stronger gravitational binding. Similar offsets are also predicted in simulations of weak ram-pressure interaction (see Sect. 6).
4.3. Filament analysis
Several filamentary H I features are identified in the highest-resolution integrated intensity map, as indicated by star markers in Fig. 4. These structures appear as narrow, elongated enhancements of neutral gas extending outwards from the main disc, predominantly originating near the outer edge of the high-column-density H I distribution. The filaments are spatially coherent and trace localised extensions of the disc into the surrounding low-density gas. The detected filaments are distributed asymmetrically, with multiple features concentrated on one side of the galaxy, whereas the opposite side shows comparatively fewer extensions. Individual filaments exhibit lengths of several hundred parsecs and vary in morphology from nearly radial protrusions to gently curved structures. Several originate near regions of complex inner morphology, including areas adjacent to H I cavities and clumpy gas concentrations. No corresponding filamentary counterparts are observed in the stellar distribution, indicating that these features are restricted to the neutral gas component.
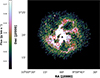 |
Fig. 4. Highest-resolution MeerKAT H I integrated intensity map of Sextans B highlighting filamentary structures. Open circles mark the locations of identified H I filaments, which appear as narrow, elongated extensions emerging from the outer disc. The filaments are distributed asymmetrically around the galaxy and are present only in the neutral gas, with no clear counterpart in the stellar or ionised components. |
5. H I kinematics
We derived the kinematic structure of Sextans B using the Tilted Ring Fitting Code (TiRiFiC; Józsa et al. 2007). TiRiFiC performs three-dimensional modelling of the H I data cube by representing the neutral gas distribution as a set of concentric tilted rings, allowing the reconstruction of the galaxy’s kinematics while accounting for projection effects.
5.1. Modelling procedure
In TiRiFiC, the H I disc is represented by a series of concentric circular rings, each parameterised by rotation velocity, inclination, position angle, and systemic velocity. Initial estimates of these parameters were obtained using PyFAT (Kamphuis 2024), which performs an automated tilted-ring analysis of the data cube to derive initial estimates of the kinematic parameters from the velocity field and H I surface-brightness distribution. These values were adopted as starting points for the TiRiFiC modelling.
The fitting was performed iteratively. In the initial run, the dynamical centre and systemic velocity derived from PyFAT were held fixed, while the rotation velocity was allowed to vary with radius and the inclination and position angle were kept fixed to stabilise the solution. In subsequent iterations, the inclination and position angle were gradually released to capture radial variations and possible disc warps. Radial motions were included to account for departures from purely circular rotation that can arise from disturbances in the outer disc.
To investigate kinematic asymmetries, the approaching and receding sides of the galaxy were modelled independently. Kinematic model convergence was assessed by comparing residual cubes between successive iterations and requiring that further iterations do not significantly improve the fit, with the preferred model selected based on the median absolute residual across the cube.
Uncertainties on the fitted kinematic parameters, including rotation velocity, inclination, position angle, systemic velocity, and centre position, were estimated using the TRM-errors1 package. This tool perturbs the best-fitting TiRiFiC model via the tirshaker module to explore parameter space, and the resulting scatter is propagated into formal error estimates, providing a robust assessment of the model uncertainties.
5.2. Kinematic modelling results
The TiRiFiC kinematic modelling reproduces the global velocity gradient for Sextans B. The results are presented in Figs. 5–7. Figure 5 presents the radial profiles derived from the TiRiFiC modelling for the approaching and receding sides of Sextans B.
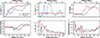 |
Fig. 5. Radial profiles derived from the TiRiFiC modelling of Sextans B, shown separately for the approaching (blue) and receding (red) sides of the galaxy. From top to bottom: Rotation velocity (Vrot), radial velocity component (Vrad), position angle (PA), inclination, H I surface density, and velocity dispersion. Radii are shown in arcseconds (bottom axis) and kiloparsecs (top axis). Error bars represent formal uncertainties from the TRM-errors analysis. |
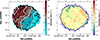 |
Fig. 6. Comparison between the observed H I velocity field and the best-fit kinematic model derived from the TiRiFiC modelling. Left: Intensity-weighted velocity field (moment 1). Observed velocities are shown as black contours and model velocities as white contours. Right: Residual velocity field computed as the difference between the observed velocity field and the best-fit kinematic model. The model reproduces the large-scale H I velocity gradient across the disc. The residuals are generally small, indicating good agreement between the data and the model. |
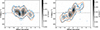 |
Fig. 7. Position–velocity diagrams of Sextans B extracted along the kinematic major axis (left) and minor axis (right). Observed emission is shown as blue contours, with the TiRiFiC model overlaid in orange. The slices illustrate the velocity structure of the H I disc and the differences between the approaching and receding sides. |
The systemic velocity derived from the kinematic modelling is Vsys = 302.671 ± 0.05 km s−1. This value is consistent with the optical systemic velocity of Sextans B (∼301 km s−1; e.g. McConnachie 2012).
The dynamical centre determined from the kinematic modelling is located at RA = 150.005° and Dec = 5.334°. This position is slightly offset from the optical centre adopted in this work (RA = 150.000°, Dec = 5.332°) by approximately ∼17 arcsec. Such small offsets between optical and kinematic centres are not uncommon in dwarf irregular galaxies and may reflect asymmetries in the neutral gas distribution. The measured offset (∼17 arcsec) is larger than the beam size of the data cube (∼10 arcsec), and is therefore spatially resolved.
The rotation curves rise rapidly within the inner ∼0.5 kpc and then gradually increase, reaching velocities of ∼50–55 km s−1 at the outermost radii. The receding side generally exhibits higher rotation velocities than the approaching side at intermediate radii, indicating a clear kinematic asymmetry between the two sides of the outer disc.
The radial velocity component remains small over much of the disc but exhibits localised deviations on both sides, with amplitudes reaching up to ∼20 km s−1 at several radii. The position angle varies with radius, particularly beyond ∼100 arcsec, where the approaching and receding sides follow distinct radial trends. The inclination remains close to ∼30° but shows moderate radial variations. The H I surface density declines steadily with radius on both sides, with noticeable differences in amplitude and radial structure between the approaching and receding profiles.
Figure 6 compares the observed and modelled moment 1 maps of Sextans B. The TiRiFiC kinematic model reproduces the large-scale velocity gradient, providing a good match to the global kinematic structure of the galaxy. Differences between the data and the kinematic model are primarily confined to localised regions of the inner disc, coincident with areas of complex H I morphology, with residual velocities typically remaining below ∼10 km s−1.
Position–velocity slices extracted along the kinematic major and minor axes (Fig. 7) further demonstrate that the kinematic model successfully recovers the overall rotation pattern while also reproducing the asymmetry between the approaching and receding sides. Together, these results indicate that while the inner disc remains largely regular, the outer H I disc shows clear kinematic asymmetry between the approaching and receding sides.
5.3. Asymmetric drift correction
We applied an asymmetric drift correction to account for dynamical support from random gas motions. Following Meurer et al. (1996), the circular velocity (Vc) is related to the observed rotation velocity (Vrot) by
 (1)
(1)
where the drift term σD2 is given by
![Mathematical equation: $$ \begin{aligned} \sigma _{D}^2(R) = -\,R\,\sigma ^2(R) \left[ \frac{\partial \ln \Sigma _{g}(R)}{\partial R} + 2\,\frac{\partial \ln \sigma (R)}{\partial R} - \frac{\partial \ln h_{z}(R)}{\partial R} \right]. \end{aligned} $$](/articles/aa/full_html/2026/08/aa60238-26/aa60238-26-eq3.gif) (2)
(2)
Here Vc is the circular velocity, Vrot is the observed rotation velocity, Σg is the gas surface density (including helium), R is the galactocentric radius, σ is the velocity dispersion, and hz is the vertical scale height of the gas disc. The velocity dispersion profile, σ(R), was taken from the best-fitting TiRiFiC model. In computing the correction, we assumed that the radial variation of the scale height is negligible, i.e. ∂lnhz/∂R = 0. This assumption is commonly adopted in asymmetric-drift corrections (e.g. Meurer et al. 1996), since the correction depends only on the radial derivative of lnhz. Studies of dwarf galaxies show that the H I scale height varies only gradually with radius (e.g. Banerjee et al. 2011), while the surface density typically changes more strongly, so the correction is dominated by the Σg and σ terms. The resulting asymmetric drift–corrected rotation curve for Sextans B after averaging both sides is shown in Fig. 8.
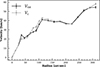 |
Fig. 8. Averaged rotation curve of Sextans B before and after asymmetric drift correction. Black points show the rotation velocities derived from the TiRiFiC modelling, while grey points indicate the corresponding circular velocities after correcting for pressure support. |
6. Comparison with ram-pressure simulations
6.1. The IGM wind tunnel
To interpret the H I morphology and kinematics of Sextans B, we compared our observations to a hydrodynamical ram-pressure simulation originally developed for gas-rich dwarf irregular galaxies moving through a low-density IGM by Yang et al. (2022) using the hydrodynamics code GIZMO (Hopkins 2015). These simulations model a rotating dwarf galaxy embedded in a dark-matter halo and are subjected to an idealised ambient medium representing the motion of the galaxy through the diffuse gas of the Local Group. A spatial cube with a side of length 500 kpc is initiated with a uniform density IGM with a mean temperature of 1 million Kelvin. GIZMO allows for a ‘periodical’ configuration in which the cube is spatially looped, where a particle trying to cross one face of the cube, appears on the opposite side. This serves as an extended ‘wind tunnel’ for the galaxy to move through, making it ideal for studying the impact of the IGM on isolated galaxies. Within this framework, we executed a simulation tailored to reproduce and interpret some features seen in Sextans B. For the galaxy itself, we used an exponential profile for the stellar and gaseous discs with a scale length of 1 kpc and a scale height of 0.3 kpc. The discs were embedded in a cored spherical dark matter halo with a scale length of 1.2 kpc. The total stellar mass for the initial condition was 9.5 × 10⁶ M⊙, 1.44 × 10⁸ M⊙ for the gaseous disc (including helium), and the total mass of the halo was 1.5 × 10⁹ M⊙. We adopted a particle mass of 1375 M⊙ for the baryonic particles and 5512.4 M⊙ for the dark matter particles. The discs and the halo were generated using ZENO (Barnes 2011).
Incorporating realistic star formation and feedback prescriptions is essential for studying N-body simulations of star forming gas-rich irregulars. In our simulation, the star formation rate is tuned using the volumetric star formation laws for dwarf galaxies from Bacchini et al. (2020). Prescriptions for feedback follow those described by Cox et al. (2006), which were successfully used by Wang et al. (2024) in GIZMO. With realistic inputs for both, our simulation accurately converts gas particles to stellar particles with time, and injects energy mimicking star formation and supernovae.
6.2. Constraints from observations
During our modelling, we faced a degeneracy between the input velocity through the IGM and its density. We chose to constrain these parameters by using previously reported limits for group environments in other studies. McConnachie et al. (2007) and Yang et al. (2022) constrained the Local Group IGM density to 10−6–10−5 cm−3 by studying interaction of Pegasus dwarf irregular galaxy (DDO 216) and WLM with the IGM. Similarly, Bureau & Carignan (2002) find similar values of 4 × 10⁻⁶ atoms cm−3 for the M81 group. Taking these observational constraints into account, we adopted an IGM density of 4 × 10⁻⁶ atoms cm−3 in our simulation. Additionally, we also chose to run a separate simulation where the same initial condition of the galaxy evolves in complete isolation, with no interaction with the IGM as a benchmark to compare morphological differences in the gas disc.
The motion and velocity of the NGC 3109 association, of which Sextans B is reported to be a part of has been of great interest in studies focussing on global motions of dwarfs in the Local Group (Pawlowski & McGaugh 2014; Banik et al. 2021). Sextans B has a radial velocity of 171 km s−1 with respect to the Milky Way and a systemic velocity of 300 km s−1 (McConnachie 2012). Though Battaglia et al. (2022) obtained proper motions for Sextans B, its distance is so large (1.36 Mpc) that it is quite dominated by error bars rendering it difficult to estimate an accurate three-dimensional space velocity. They highlight this by mentioning an error of 1000 km s−1 on the transverse velocity. However, considering that the space velocity of other isolated irregular – for example, WLM is 300 ± 150 km s−1 (Yang et al. 2022) and IC 10 is 215 ± 42 km s−1 (Brunthaler et al. 2007) – and with the constrained radial velocity of Sextans B, it is reasonable to compare our Sextans B observations to a hydrodynamical model of a gas-rich irregular moving with a space velocity of a few hundred km s−1. Therefore, our model moves at a velocity of 300 km s−1 through the IGM. Taking into account the large radial velocity of motion away from the Milky Way, and the fact that Sextans B’s inclination is close to 30°, we initially placed the galaxy with the disc tilted 30° into the medium with a leading edge in the direction of motion through the IGM. Thus, we have a model of a gas-rich irregular moving away from the observer through the IGM with the observer looking at the face of the disc as it recedes. These observationally motivated constraints let us compare this illustrative hydrodynamical model to our Sextans B observations. Future limits on proper motions with the next Gaia data release will significantly help later studies, though the bulk motion of the local IGM, if any, so far remains fully unconstrained.
6.3. Evolution of the gas disc in the IGM
As the simulation begins the galaxy traverses through the medium through the 500 kpc wide cube. The simulation runs for 10 gigayears in total. Within the first gigayear, the galaxy, particularly the gas disc, rapidly evolves away from the initial conditions due to star formation and feedback. As the galaxy evolves further, we see that even weak ram pressure, characteristic of group environments, can substantially perturb the outer H I disc while leaving the inner regions largely unaffected. Low-column-density gas is displaced from the outer edges of the disc and the velocity field develops systematic differences between the approaching and receding sides beyond ≃1–2 kpc. In this regime, the outer disc becomes progressively out of dynamical equilibrium, whereas the stellar component and the dense inner gas remain comparatively stable.
We placed our simulation within an observation-like frame (PA, inc) so that we could compare our H I observations to the simulations robustly. In the top row of Fig. 9, we see an instance of our galaxy initial condition evolving without interacting with the IGM, with no gas loss. The bottom row illustrates what happens to the disc as it evolves through the IGM and develops an asymmetric gas distribution with time. A feature to note between the instance in isolation and one evolving in the IGM, is the distinct oval-like shape of the inner disc, while the one in isolation remains nearly circular. The one interacting with the IGM also distinctly shows a few, broad filaments, similar to those in the observations, compared to the numerous small ones seen in the one is isolation at the 8.85 Gyr epoch.
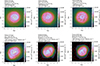 |
Fig. 9. Evolution of the simulated galaxy. Top row: Evolution of the simulated galaxy described in Sect. 6 at three different epochs as the galaxy evolves in complete isolation without interacting with the IGM, no gas is stripped, and the gas disc symmetrically envelopes the stellar disc at all epochs. Bottom row: Snapshots at the same three epochs, showing the evolving morphology of the galaxy as it interacts with the IGM. It loses gas and tends towards a gaseous and stellar distribution similar to the observations. Column density maps are overlaid with stellar mass surface density contours of values 0.1,0.2,0.4,0.8,3.1, and 6.3 M⊙/pc−2 from the outside in. Bottom left: 2 Gyr into the IGM, the gaseous disc extends beyond the stellar disc. Bottom centre: 4.6 Gyr later, we have an asymmetry in the gas and stellar distribution. Bottom right: After losing gas to ram pressure for 8.85 Gyr, we arrive at an asymmetrical distribution of H I and the stellar disc; they are clearly offset in a similar fashion to the observations. The internal filamentary structure seen in Sextans B is seen at all epochs, though the system under ram pressure seems to have evolved larger, asymmetric ones. |
The image presented in the left panel of Fig. 10 is a snapshot of the simulation in the observational frame, which has evolved 8.85 Gyr in the IGM. The right panel shows the same simulation seen from an edge-on frame, to view how the galaxy is losing its gas. The tilt of the galaxy with respect to the IGM can be seen here. TiRiFiC radial profiles for this epoch are presented in Fig. 11.
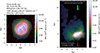 |
Fig. 10. Simulated dwarf galaxy evolving through the IGM after 8.85 Gyr. Left: Column density map of a simulated dwarf galaxy like Sextans B evolving through the IGM after 8.85 Gyr, reaching a total stellar mass and HI mass very similar to the observed values. The contours represent the stellar mass surface density, with values of 0.4, 0.6, 0.8, 1.6, 3.0, 9.4, and 12.6 M⊙/pc−2 from the outside in. We can see that, similar to the observations presented in Fig. 2b, the stellar contours extend beyond the HI envelope towards the southern edge. The units used for the stellar contours in Fig. 2b differ from those presented here but serve an illustrative purpose to demonstrate an offset in the stellar and gaseous distributions. Right: Edge-on HI column density map of the same galaxy at the same epoch but evolving through a sparse IGM density of 4 × 10⁻⁶ atoms cm−3 and steadily losing gas as described in Sect. 6. This snapshot is the same as that presented in the bottom-right panel of Fig. 9. |
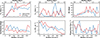 |
Fig. 11. Radial profiles derived from the TiRiFiC modelling of the H I disc of the hydrodynamical simulation presented in Fig. 9 at 8.85 Gyr, shown separately for the approaching (blue) and receding (red) sides of the galaxy. From top to bottom: Rotation velocity (Vrot), radial velocity component (Vrad), position angle (PA), inclination, H I surface density, and velocity dispersion. Radii are shown in arcseconds (bottom axis) and kiloparsecs (top axis). |
7. Discussion
The deep MeerKAT observations presented in this work reveal several observational signatures suggesting that the outer neutral gas disc of Sextans B is dynamically perturbed. These include asymmetries in the low–column-density H I distribution, spatial differences between the stellar and gaseous components, and systematic discrepancies between the approaching and receding sides of the rotation curve derived from the kinematic modelling. Taken together, these morphological and kinematic properties indicate that the outer gas disc departs from a simple symmetric configuration.
A similar combination of disturbed H I morphology and asymmetric outer-disc kinematics has recently been reported for the isolated Local Group dwarf galaxy WLM, where interaction with a diffuse ambient medium has been proposed to explain both the extended H I structures and the divergence between the approaching and receding rotation curves (Yang et al. 2022; Kolhe et al. 2026). Within this emerging framework, Sextans B provides an additional system in which to investigate whether weak ram-pressure interaction with a low-density IGM can influence both the structure and kinematics of dwarf galaxies in the outskirts of the Local Group.
7.1. Observational signatures of environmental interactions
The kinematic modelling presented in this work provides further evidence that the outer gas disc of Sextans B is dynamically perturbed. The rotation curves derived for the approaching and receding sides of the galaxy diverge at larger radii, while the inner regions remain comparatively regular. This behaviour suggests that the outer velocity field deviates from simple axisymmetric rotation.
While stellar feedback is known to produce cavities, shells, and small-scale filamentary structures in the neutral gas of dwarf galaxies (Puche et al. 1992; Walter & Brinks 1999), it typically operates on local scales and is not generally expected to generate large-scale one-sided distortions of the outer H I envelope or systematic kinematic differences between the two sides of the disc. The combination of asymmetric outer H I morphology, gas–star offsets, and diverging rotation curves therefore suggests that internal feedback alone may not fully account for the observed features, and that an additional external perturbation may be affecting the outer gas disc. Although asymmetric rotation curves can also arise from internal processes such as disc warps, lopsided mass distributions, or non-circular gas motions, the coincidence between the kinematic asymmetry and the morphological distortions observed in the outer H I disc suggests that the two may originate from a common perturbation acting preferentially on the low-density outer gas.
A similar combination of disturbed H I morphology and asymmetric outer-disc kinematics has recently been identified in the Local Group dwarf galaxy WLM (Kepley et al. 2007; Yang et al. 2022; Kolhe et al. 2026). In that system, the divergence between the approaching and receding rotation curves at large radii has been interpreted as evidence of ram-pressure effects acting on the outer gas disc. Taken together, the combination of asymmetric H I morphology, gas–star offsets, filamentary structures, and diverging rotation curves forms a consistent set of observational signatures that may indicate interaction between the outer gas disc of Sextans B and a diffuse ambient medium.
7.2. Interpretation from ram-pressure simulations
We performed hydrodynamical simulations of a Sextans B–like dwarf galaxy evolving in a low-density IGM representative of the Local Group environment, following the prescriptions described in Sect. 6. These simulations show that the combined effects of ram pressure and stellar feedback can naturally generate asymmetric gas distributions and filamentary structures in dwarf galaxies (Benítez-Llambay et al. 2013).
In the early stages of the simulated evolution, star formation and stellar feedback create cavities and filamentary gas structures within the disc. As the galaxy continues to interact with a diffuse ambient medium, ram pressure gradually removes gas from the outer regions of the disc. This interaction leads to an asymmetric outer gas distribution. A demonstration of this process can be seen in Fig. 9.
The efficiency of this process depends on the balance between the external pressure and the gravitational restoring force of the galaxy, commonly expressed through the classical condition proposed by Gunn & Gott (1972). The ram pressure exerted by the ambient medium can be written as
 (3)
(3)
where ρIGM is the density of the surrounding medium and v is the relative velocity between the galaxy and the ambient gas. Gas stripping is expected to occur when the ram pressure exceeds the gravitational restoring force per unit area of the disc, which can be approximated as
 (4)
(4)
where Σ* and Σg are the stellar and gas surface densities, respectively (Gunn & Gott 1972). For an ambient density of n ∼ 4 × 10⁻⁶ atoms cm−3 and a velocity of ∼300 km s−1, the corresponding ram pressure is of order Pram ∼ 10−15 dyn cm−2. Using the H I surface density derived from our TiRiFiC modelling of the observations and adopting outer-disc stellar surface densities from Oh et al. (2015), we estimate that Pgrav is a few times 10−15 dyn cm−2, indicating that the ram pressure is sufficient to perturb the outer low-density gas without fully stripping the disc.
The simulation initially had a total stellar mass of 9.6 × 10⁷ M⊙ and a gas mass of 1.44 × 10⁸ M⊙. Assuming a neutral hydrogen fraction of 0.76, the total HI mass was 1.1 × 10⁸ M⊙. At the 8.85 Gyr epoch, the total stellar mass is 3.9 × 10⁷ M⊙ and the total H I mass in the disc is 4.2 × 10⁷ M⊙: thus, only 2.94 × 10⁷ M⊙ of the HI mass was converted to new stars, and 3.86 × 10⁷ M⊙ was lost to the combined effect of ram pressure and feedback. Because dwarf galaxies possess shallow gravitational potentials and extended low-density H I discs, even relatively weak external pressures can influence their outer gas distributions (Bureau & Carignan 2002)
Radial profiles of the model at 8.85 Gyr derived using TiRiFiC presented in Fig. 11. While the simulations are idealised and not specifically tailored to reproduce the exact parameters of Sextans B, the radial profiles indicate that our model is morphologically and kinematically similar enough to Sextans-B to illustrate the expected signatures of ram-pressure interaction, which can be seen in Fig. 9.
In the simulations presented in Sect. 6, a dwarf galaxy moving through an IGM with density ∼4 × 10⁻⁶ atoms cm−3 and velocity ∼300 km s−1 develops extended asymmetric gas structures and outer-disc kinematic perturbations that qualitatively resemble the features observed in Sextans B.
7.3. Implications for dwarf galaxies in low-density environments
The case of Sextans B supports the emerging view that environmental processes can influence dwarf galaxies even in relatively low-density regions of the Local Group. Observations of the isolated dwarf galaxy WLM reveal extended H I clouds trailing behind the galaxy and kinematic asymmetries in its rotation curve, both interpreted as signatures of interaction with a diffuse IGM (Yang et al. 2022; Kolhe et al. 2026). The simulation shown in Fig. 9 corresponds to a dwarf galaxy evolved in an IGM with density ∼4 × 10⁻⁶ atoms cm−3 and a relative velocity of ∼300 km s−1 (see Sect. 6).
Because the ram pressure expected in such low-density environments is relatively weak, its influence is likely to accumulate gradually over several gigayears rather than producing rapid gas stripping as observed in dense cluster environments. Over these long timescales, even mild hydrodynamical interactions can progressively reshape the outer H I discs of dwarf galaxies and alter their kinematics while leaving the stellar component largely unaffected.
Sextans B therefore provides an additional example supporting the possibility that weak environmental effects contribute to shaping the gas distribution and dynamics of dwarf galaxies located in the outskirts of the Local Group.
8. Conclusions
We have presented deep MeerKAT H I observations of the dwarf irregular galaxy Sextans B, which enabled us to carry out a detailed investigation of the morphology and kinematics of its neutral gas disc down to low column densities. By combining the analysis of the H I distribution with three-dimensional kinematic modelling and comparisons with hydrodynamical simulations, we explored whether the observed properties of Sextans B are consistent with weak environmental effects in the outskirts of the Local Group. Our main results can be summarised as follows:
-
The H I distribution of Sextans B becomes increasingly asymmetric at low column densities, revealing filamentary structures and diffuse extensions in the outer disc. These features depart from a simple symmetric configuration and suggest that the outer gas disc is dynamically disturbed.
-
A comparison of the stellar and gaseous components shows that while the stellar distribution remains relatively symmetric, the H I disc exhibits clear asymmetries and spatial offsets. Such gas–star mismatches are consistent with the behaviour expected when the gaseous component is more strongly affected by external hydrodynamical forces.
-
Three-dimensional kinematic modelling of the H I cube reveals systematic differences between the approaching and receding sides of the galaxy. While the inner disc remains largely regular, the rotation curves diverge in the outer regions, indicating that the outer kinematics departs from simple axisymmetric rotation.
-
The combination of asymmetric H I morphology and outer-disc kinematic perturbations resembles the signatures recently reported for the isolated Local Group dwarf galaxy WLM, where environmental interaction has been proposed to explain both the disturbed gas morphology and the asymmetric rotation curve.
-
Hydrodynamical simulations demonstrate that ram-pressure effects, combined with stellar feedback, can reproduce several of the morphological features observed in Sextans B. Over long timescales, such processes can gradually reshape the outer gas distribution of dwarf galaxies while leaving the stellar component largely intact.
These results suggest that Sextans B represents an additional system in which the outer gas disc of a dwarf galaxy is influenced by interaction with a diffuse ambient medium. If confirmed in other systems, such signatures would indicate that even the extremely low-density IGM can contribute to shaping the gas distribution and kinematics of dwarf galaxies located in the outskirts of the Local Group. Future deep H I observations with facilities such as MeerKAT and upcoming Square Kilometre Array (SKA) surveys will provide the sensitivity required to probe the low-column-density gas in nearby dwarf galaxies and will be crucial for determining how common such environmental signatures are in the Local Group.
Acknowledgments
The MeerKAT telescope is operated by the South African Radio Astronomy Observatory, which is a facility of the National Research Foundation, an agency of the Department of Science and Innovation. BN, LVM, RI, MK, and AS acknowledge financial support from the grant CEX2021-001131-S funded by MICIU/AEI/10.13039/501100011033, and from the grants PID2021-123930OB-C21 and PID2024-155817OB-I00 funded by MICIU/AEI/10.13039/501100011033 and by ERDF/EU. BN also acknowledges financial support from the grant PTA2023-023268-I funded by MICIU/AEI/10.13039/501100011033 and by ESF+ and the grant DGP_POST_2024_01021, funded by the Junta de Andalucía/CUII and the ESF+. MK also acknowledges that this project has received funding through the SAFE – “Supporting At-Risk Researchers with Fellowships in Europe” project, funded by the European Union under Grant Agreement No. 101148426. The views and opinions expressed are those of the author(s) and do not necessarily reflect those of the European Union. HC acknowledges the financial support from Zhejiang Provincial Natural Science Foundation of China (Grant No. LY24A030001) and the Leading Innovation and Entrepreneurship Team of Zhejiang Province of China (Grant No. 2023R01008). Simulations in this work were performed at the High-performence calculation (HPC) resources MesoPSL financed by the project Equip@Meso (reference ANR-10-EQPX- 29-01) of the program “Investissements d’Avenir” supervised by the ‘Agence Nationale de la Recherche’.
References
- Albareti, F. D., Allende Prieto, C., Almeida, A., et al. 2017, ApJS, 233, 25 [Google Scholar]
- Bacchini, C., Fraternali, F., Pezzulli, G., & Marasco, A. 2020, A&A, 644, A125 [NASA ADS] [CrossRef] [EDP Sciences] [Google Scholar]
- Bagetakos, I., Brinks, E., Walter, F., et al. 2011, AJ, 141, 23 [NASA ADS] [CrossRef] [Google Scholar]
- Banerjee, A., Jog, C. J., Brinks, E., & Bagetakos, I. 2011, MNRAS, 415, 687 [NASA ADS] [CrossRef] [Google Scholar]
- Banik, I., Haslbauer, M., Pawlowski, M. S., Famaey, B., & Kroupa, P. 2021, MNRAS, 503, 6170 [Google Scholar]
- Barnes, J. E. 2011, Astrophysics Source Code Library [record ascl:1102.027] [Google Scholar]
- Battaglia, G., Taibi, S., Thomas, G. F., & Fritz, T. K. 2022, A&A, 657, A54 [NASA ADS] [CrossRef] [EDP Sciences] [Google Scholar]
- Bellazzini, M., Beccari, G., Fraternali, F., et al. 2014, A&A, 566, A44 [NASA ADS] [CrossRef] [EDP Sciences] [Google Scholar]
- Benítez-Llambay, A., Navarro, J. F., Abadi, M. G., et al. 2013, ApJ, 763, L41 [Google Scholar]
- Boselli, A., & Gavazzi, G. 2006, PASP, 118, 517 [Google Scholar]
- Brunthaler, A., Reid, M. J., Falcke, H., Henkel, C., & Menten, K. M. 2007, A&A, 462, 101 [NASA ADS] [CrossRef] [EDP Sciences] [Google Scholar]
- Bureau, M., & Carignan, C. 2002, AJ, 123, 1316 [NASA ADS] [CrossRef] [Google Scholar]
- Camilo, F., Scholz, P., Serylak, M., et al. 2018, ApJ, 856, 180 [Google Scholar]
- Cox, T. J., Jonsson, P., Primack, J. R., & Somerville, R. S. 2006, MNRAS, 373, 1013 [Google Scholar]
- de Vaucouleurs, G., de Vaucouleurs, A., Corwin, H. G., Jr., et al. 1991, Third Reference Catalogue of Bright Galaxies [Google Scholar]
- Dolphin, A. E., Saha, A., Skillman, E. D., et al. 2003, AJ, 125, 1261 [Google Scholar]
- Grcevich, J., & Putman, M. E. 2009, ApJ, 696, 385 [NASA ADS] [CrossRef] [Google Scholar]
- Gunn, J. E., & Gott, J. R., III. 1972, ApJ, 176, 1 [NASA ADS] [CrossRef] [Google Scholar]
- Hammer, F., Yang, Y. B., Flores, H., Puech, M., & Fouquet, S. 2015, ApJ, 813, 110 [NASA ADS] [CrossRef] [Google Scholar]
- Hopkins, P. F. 2015, MNRAS, 450, 53 [Google Scholar]
- Hunter, D. A., Ficut-Vicas, D., Ashley, T., et al. 2012, AJ, 144, 134 [CrossRef] [Google Scholar]
- Jonas, J., & MeerKAT Team. 2016, MeerKAT Science: On the Pathway to the SKA, 1 [Google Scholar]
- Józsa, G. I. G., Kenn, F., Klein, U., & Oosterloo, T. A. 2007, A&A, 468, 731 [NASA ADS] [CrossRef] [EDP Sciences] [Google Scholar]
- Józsa, G. I. G., White, S. V., Thorat, K., et al. 2020, Astrophysics Source Code Library [record ascl:2006.014] [Google Scholar]
- Kalberla, P. M. W., & Haud, U. 2006, A&A, 455, 481 [NASA ADS] [CrossRef] [EDP Sciences] [Google Scholar]
- Kamphuis, P. 2024, Astrophysics Source Code Library [record ascl:2407.002] [Google Scholar]
- Kepley, A. A., Wilcots, E. M., Hunter, D. A., & Nordgren, T. 2007, AJ, 133, 2242 [NASA ADS] [CrossRef] [Google Scholar]
- Kniazev, A. Y., Grebel, E. K., Pustilnik, S. A., Pramskij, A. G., & Zucker, D. B. 2005, AJ, 130, 1558 [NASA ADS] [CrossRef] [Google Scholar]
- Kolhe, N., Hammer, F., Yang, Y., et al. 2026, A&A, 707, A309 [NASA ADS] [CrossRef] [EDP Sciences] [Google Scholar]
- McConnachie, A. W. 2012, AJ, 144, 4 [Google Scholar]
- McConnachie, A. W., Venn, K. A., Irwin, M. J., Young, L. M., & Geehan, J. J. 2007, ApJ, 671, L33 [NASA ADS] [CrossRef] [Google Scholar]
- Meurer, G. R., Carignan, C., Beaulieu, S. F., & Freeman, K. C. 1996, AJ, 111, 1551 [Google Scholar]
- Miller, M. J., & Bregman, J. N. 2013, ApJ, 770, 118 [NASA ADS] [CrossRef] [Google Scholar]
- Namumba, B., Carignan, C., & Passmoor, S. 2018, MNRAS, 478, 487 [Google Scholar]
- Offringa, A. R. 2010, Astrophysics Source Code Library [record ascl:1010.017] [Google Scholar]
- Offringa, A. R., & Smirnov, O. 2017, MNRAS, 471, 301 [Google Scholar]
- Offringa, A. R., van de Gronde, J. J., & Roerdink, J. B. T. M. 2012, A&A, 539, A95 [NASA ADS] [CrossRef] [EDP Sciences] [Google Scholar]
- Offringa, A. R., McKinley, B., Hurley-Walker, N., et al. 2014, MNRAS, 444, 606 [Google Scholar]
- Oh, S.-H., Hunter, D. A., Brinks, E., et al. 2015, AJ, 149, 180 [CrossRef] [Google Scholar]
- Pawlowski, M. S., & McGaugh, S. S. 2014, MNRAS, 440, 908 [NASA ADS] [CrossRef] [Google Scholar]
- Pickering, T. E., Impey, C. D., van Gorkom, J. H., & Bothun, G. D. 1997, AJ, 114, 1858 [NASA ADS] [CrossRef] [Google Scholar]
- Puche, D., Westpfahl, D., Brinks, E., & Roy, J.-R. 1992, AJ, 103, 1841 [Google Scholar]
- Putman, M. E., Zheng, Y., Price-Whelan, A. M., et al. 2021, ApJ, 913, 53 [NASA ADS] [CrossRef] [Google Scholar]
- Soszyński, I., Gieren, W., Pietrzyński, G., et al. 2006, ApJ, 648, 375 [Google Scholar]
- Springob, C. M., Haynes, M. P., Giovanelli, R., & Kent, B. R. 2005, ApJS, 160, 149 [NASA ADS] [CrossRef] [Google Scholar]
- Steyrleithner, P., Hensler, G., & Boselli, A. 2020, MNRAS, 494, 1114 [Google Scholar]
- Walter, F., & Brinks, E. 1999, AJ, 118, 273 [NASA ADS] [CrossRef] [Google Scholar]
- Wang, J., Hammer, F., Yang, Y., et al. 2019, MNRAS, 486, 5907 [CrossRef] [Google Scholar]
- Wang, J., Hammer, F., Yang, Y., et al. 2024, MNRAS, 527, 7144 [Google Scholar]
- Westmeier, T., Kitaeff, S., Pallot, D., et al. 2021, MNRAS, 506, 3962 [NASA ADS] [CrossRef] [Google Scholar]
- Yang, Y., Ianjamasimanana, R., Hammer, F., et al. 2022, A&A, 660, L11 [NASA ADS] [CrossRef] [EDP Sciences] [Google Scholar]
All Tables
All Figures
|
Fig. 1. MeerKAT H I column density contours from multiple angular-resolution cubes of Sextans B overlaid on DECaLS gri composite images. This optical image is included for visual reference only and is not a deep optical map (see Fig. 2 for the deeper imaging used for the comparison). Each contour corresponds to the 3σ column density sensitivity of the respective cube. The colour bar indicates the beam size associated with each resolution. The ellipses in the lower-right corner show the synthesised beams, and the black horizontal line indicates the physical scale (in kpc). |
| In the text | |
|
Fig. 2. Highest-resolution MeerKAT H I maps of Sextans B. Panel (a): Integrated H I intensity (moment 0). Panel (b): Optical stellar emission (red contours, in arbitrary units) overlaid on the H I moment 0 map. The contours are at 5, 10, 20, 40, 80, and 100σ above the background noise (σ) of the optical image. Panel (c): Intensity-weighted velocity field (moment 1). Panel (d): Velocity dispersion map (moment 2). The maps show a centrally concentrated H I disc with a pronounced internal structure, including multiple cavities embedded in clumpy high-column-density gas, together with small-scale structure extending into the outer regions. |
| In the text | |
|
Fig. 3. Integrated H I spectrum of Sextans B from MeerKAT (orange), compared with KAT-7 (blue; Namumba et al. 2018) and single-dish measurements (black; Springob et al. 2005; Hunter et al. 2012). The arrow indicates the systemic velocity derived in Sect. 5. The horizontal dashed grey line marks the zero level. The profile is extracted from the mid-resolution data cube. |
| In the text | |
|
Fig. 4. Highest-resolution MeerKAT H I integrated intensity map of Sextans B highlighting filamentary structures. Open circles mark the locations of identified H I filaments, which appear as narrow, elongated extensions emerging from the outer disc. The filaments are distributed asymmetrically around the galaxy and are present only in the neutral gas, with no clear counterpart in the stellar or ionised components. |
| In the text | |
|
Fig. 5. Radial profiles derived from the TiRiFiC modelling of Sextans B, shown separately for the approaching (blue) and receding (red) sides of the galaxy. From top to bottom: Rotation velocity (Vrot), radial velocity component (Vrad), position angle (PA), inclination, H I surface density, and velocity dispersion. Radii are shown in arcseconds (bottom axis) and kiloparsecs (top axis). Error bars represent formal uncertainties from the TRM-errors analysis. |
| In the text | |
|
Fig. 6. Comparison between the observed H I velocity field and the best-fit kinematic model derived from the TiRiFiC modelling. Left: Intensity-weighted velocity field (moment 1). Observed velocities are shown as black contours and model velocities as white contours. Right: Residual velocity field computed as the difference between the observed velocity field and the best-fit kinematic model. The model reproduces the large-scale H I velocity gradient across the disc. The residuals are generally small, indicating good agreement between the data and the model. |
| In the text | |
|
Fig. 7. Position–velocity diagrams of Sextans B extracted along the kinematic major axis (left) and minor axis (right). Observed emission is shown as blue contours, with the TiRiFiC model overlaid in orange. The slices illustrate the velocity structure of the H I disc and the differences between the approaching and receding sides. |
| In the text | |
|
Fig. 8. Averaged rotation curve of Sextans B before and after asymmetric drift correction. Black points show the rotation velocities derived from the TiRiFiC modelling, while grey points indicate the corresponding circular velocities after correcting for pressure support. |
| In the text | |
|
Fig. 9. Evolution of the simulated galaxy. Top row: Evolution of the simulated galaxy described in Sect. 6 at three different epochs as the galaxy evolves in complete isolation without interacting with the IGM, no gas is stripped, and the gas disc symmetrically envelopes the stellar disc at all epochs. Bottom row: Snapshots at the same three epochs, showing the evolving morphology of the galaxy as it interacts with the IGM. It loses gas and tends towards a gaseous and stellar distribution similar to the observations. Column density maps are overlaid with stellar mass surface density contours of values 0.1,0.2,0.4,0.8,3.1, and 6.3 M⊙/pc−2 from the outside in. Bottom left: 2 Gyr into the IGM, the gaseous disc extends beyond the stellar disc. Bottom centre: 4.6 Gyr later, we have an asymmetry in the gas and stellar distribution. Bottom right: After losing gas to ram pressure for 8.85 Gyr, we arrive at an asymmetrical distribution of H I and the stellar disc; they are clearly offset in a similar fashion to the observations. The internal filamentary structure seen in Sextans B is seen at all epochs, though the system under ram pressure seems to have evolved larger, asymmetric ones. |
| In the text | |
|
Fig. 10. Simulated dwarf galaxy evolving through the IGM after 8.85 Gyr. Left: Column density map of a simulated dwarf galaxy like Sextans B evolving through the IGM after 8.85 Gyr, reaching a total stellar mass and HI mass very similar to the observed values. The contours represent the stellar mass surface density, with values of 0.4, 0.6, 0.8, 1.6, 3.0, 9.4, and 12.6 M⊙/pc−2 from the outside in. We can see that, similar to the observations presented in Fig. 2b, the stellar contours extend beyond the HI envelope towards the southern edge. The units used for the stellar contours in Fig. 2b differ from those presented here but serve an illustrative purpose to demonstrate an offset in the stellar and gaseous distributions. Right: Edge-on HI column density map of the same galaxy at the same epoch but evolving through a sparse IGM density of 4 × 10⁻⁶ atoms cm−3 and steadily losing gas as described in Sect. 6. This snapshot is the same as that presented in the bottom-right panel of Fig. 9. |
| In the text | |
|
Fig. 11. Radial profiles derived from the TiRiFiC modelling of the H I disc of the hydrodynamical simulation presented in Fig. 9 at 8.85 Gyr, shown separately for the approaching (blue) and receding (red) sides of the galaxy. From top to bottom: Rotation velocity (Vrot), radial velocity component (Vrad), position angle (PA), inclination, H I surface density, and velocity dispersion. Radii are shown in arcseconds (bottom axis) and kiloparsecs (top axis). |
| In the text | |
Current usage metrics show cumulative count of Article Views (full-text article views including HTML views, PDF and ePub downloads, according to the available data) and Abstracts Views on Vision4Press platform.
Data correspond to usage on the plateform after 2015. The current usage metrics is available 48-96 hours after online publication and is updated daily on week days.
Initial download of the metrics may take a while.