


Fig. 2.
Download original image
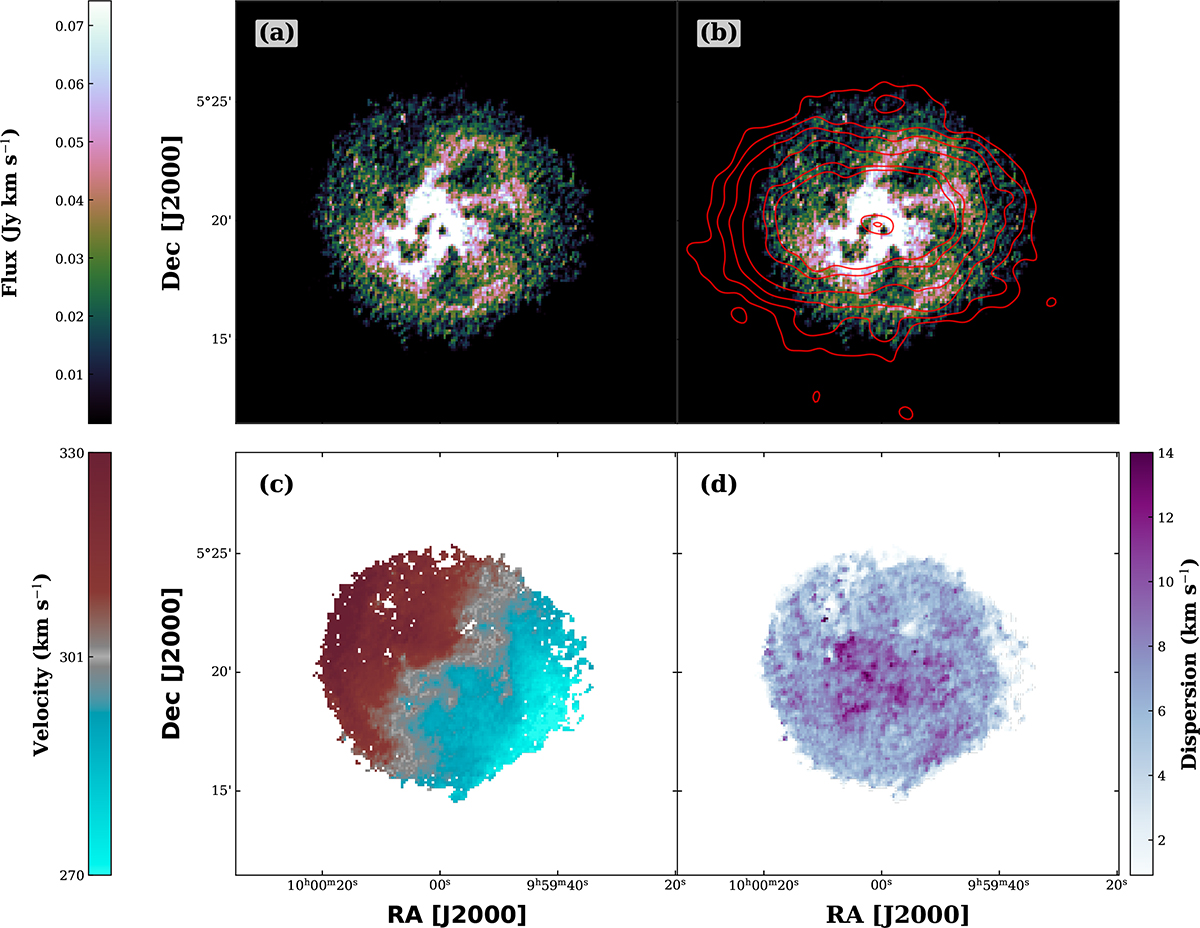
Highest-resolution MeerKAT H I maps of Sextans B. Panel (a): Integrated H I intensity (moment 0). Panel (b): Optical stellar emission (red contours, in arbitrary units) overlaid on the H I moment 0 map. The contours are at 5, 10, 20, 40, 80, and 100σ above the background noise (σ) of the optical image. Panel (c): Intensity-weighted velocity field (moment 1). Panel (d): Velocity dispersion map (moment 2). The maps show a centrally concentrated H I disc with a pronounced internal structure, including multiple cavities embedded in clumpy high-column-density gas, together with small-scale structure extending into the outer regions.
Current usage metrics show cumulative count of Article Views (full-text article views including HTML views, PDF and ePub downloads, according to the available data) and Abstracts Views on Vision4Press platform.
Data correspond to usage on the plateform after 2015. The current usage metrics is available 48-96 hours after online publication and is updated daily on week days.
Initial download of the metrics may take a while.