


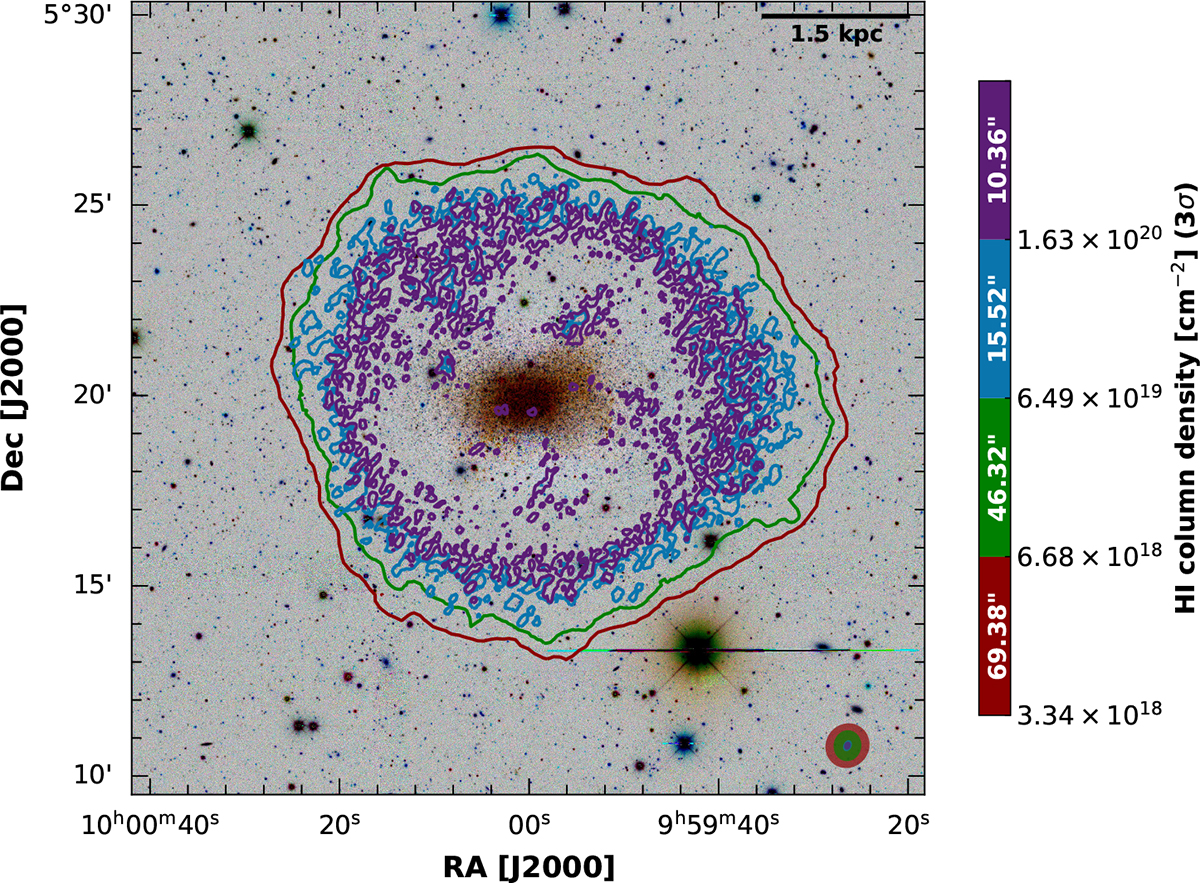
Fig. 1.
Download original image
MeerKAT H I column density contours from multiple angular-resolution cubes of Sextans B overlaid on DECaLS gri composite images. This optical image is included for visual reference only and is not a deep optical map (see Fig. 2 for the deeper imaging used for the comparison). Each contour corresponds to the 3σ column density sensitivity of the respective cube. The colour bar indicates the beam size associated with each resolution. The ellipses in the lower-right corner show the synthesised beams, and the black horizontal line indicates the physical scale (in kpc).
Current usage metrics show cumulative count of Article Views (full-text article views including HTML views, PDF and ePub downloads, according to the available data) and Abstracts Views on Vision4Press platform.
Data correspond to usage on the plateform after 2015. The current usage metrics is available 48-96 hours after online publication and is updated daily on week days.
Initial download of the metrics may take a while.