


Fig. 10.
Download original image
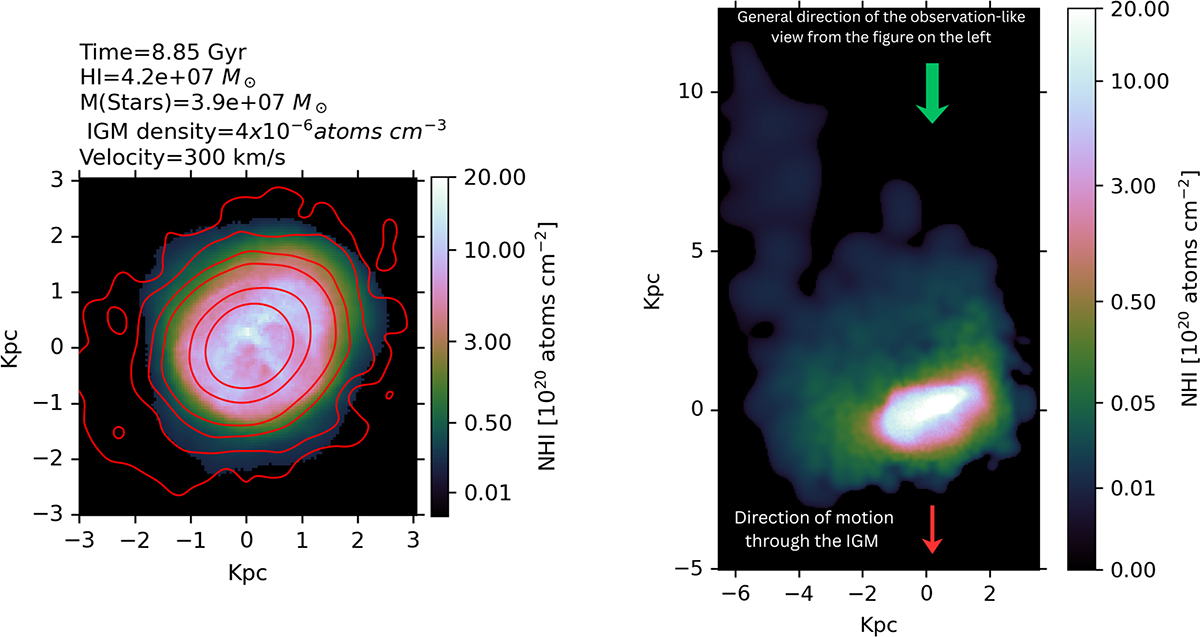
Simulated dwarf galaxy evolving through the IGM after 8.85 Gyr. Left: Column density map of a simulated dwarf galaxy like Sextans B evolving through the IGM after 8.85 Gyr, reaching a total stellar mass and HI mass very similar to the observed values. The contours represent the stellar mass surface density, with values of 0.4, 0.6, 0.8, 1.6, 3.0, 9.4, and 12.6 M⊙/pc−2 from the outside in. We can see that, similar to the observations presented in Fig. 2b, the stellar contours extend beyond the HI envelope towards the southern edge. The units used for the stellar contours in Fig. 2b differ from those presented here but serve an illustrative purpose to demonstrate an offset in the stellar and gaseous distributions. Right: Edge-on HI column density map of the same galaxy at the same epoch but evolving through a sparse IGM density of 4 × 10⁻⁶ atoms cm−3 and steadily losing gas as described in Sect. 6. This snapshot is the same as that presented in the bottom-right panel of Fig. 9.
Current usage metrics show cumulative count of Article Views (full-text article views including HTML views, PDF and ePub downloads, according to the available data) and Abstracts Views on Vision4Press platform.
Data correspond to usage on the plateform after 2015. The current usage metrics is available 48-96 hours after online publication and is updated daily on week days.
Initial download of the metrics may take a while.