


Fig. 9.
Download original image
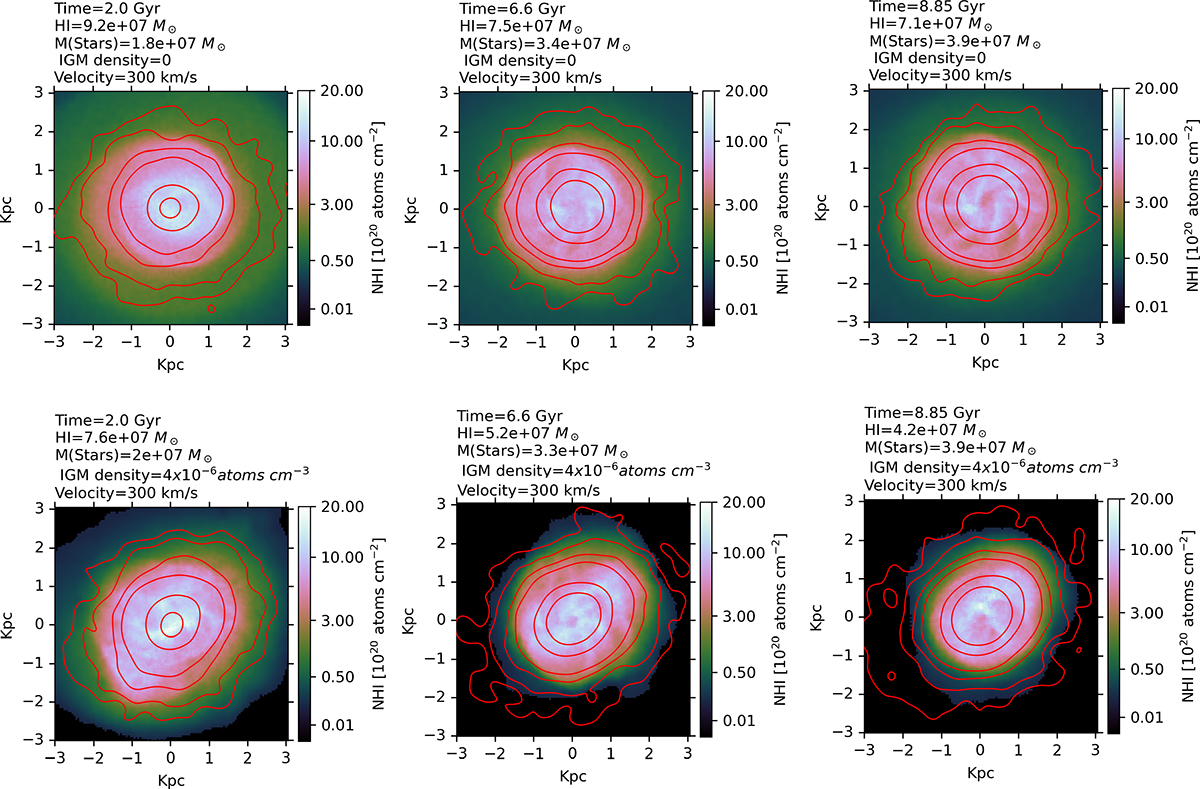
Evolution of the simulated galaxy. Top row: Evolution of the simulated galaxy described in Sect. 6 at three different epochs as the galaxy evolves in complete isolation without interacting with the IGM, no gas is stripped, and the gas disc symmetrically envelopes the stellar disc at all epochs. Bottom row: Snapshots at the same three epochs, showing the evolving morphology of the galaxy as it interacts with the IGM. It loses gas and tends towards a gaseous and stellar distribution similar to the observations. Column density maps are overlaid with stellar mass surface density contours of values 0.1,0.2,0.4,0.8,3.1, and 6.3 M⊙/pc−2 from the outside in. Bottom left: 2 Gyr into the IGM, the gaseous disc extends beyond the stellar disc. Bottom centre: 4.6 Gyr later, we have an asymmetry in the gas and stellar distribution. Bottom right: After losing gas to ram pressure for 8.85 Gyr, we arrive at an asymmetrical distribution of H I and the stellar disc; they are clearly offset in a similar fashion to the observations. The internal filamentary structure seen in Sextans B is seen at all epochs, though the system under ram pressure seems to have evolved larger, asymmetric ones.
Current usage metrics show cumulative count of Article Views (full-text article views including HTML views, PDF and ePub downloads, according to the available data) and Abstracts Views on Vision4Press platform.
Data correspond to usage on the plateform after 2015. The current usage metrics is available 48-96 hours after online publication and is updated daily on week days.
Initial download of the metrics may take a while.