


| Issue |
A&A
Volume 710, June 2026
|
|
|---|---|---|
| Article Number | A274 | |
| Number of page(s) | 13 | |
| Section | Extragalactic astronomy | |
| DOI | https://doi.org/10.1051/0004-6361/202659493 | |
| Published online | 19 June 2026 | |
A XRISM view of the iron line complex in NGC 1068: Rethinking the prototypical Compton-thick AGN
1
Dipartimento di Matematica e Fisica, Università degli Studi Roma Tre, Via della Vasca Navale 84, I-00146 Roma, Italy
2
European Space Agency (ESA), European Space Research and Technology Centre (ESTEC), Keplerlaan 1, 2201 AZ, Noordwijk, The Netherlands
3
Sterrenkundig Observatorium, Universiteit Gent, Krijgslaan 281 S9, 9000 Gent, Belgium
4
INAF Osservatorio Astrofisico di Arcetri, Largo E. Fermi 5, 50125 Firenze, Italy
5
INAF Osservatorio Astronomico di Brera, Via Bianchi 46, I-23807 Merate (LC), Italy
6
Department of Physics, Institute for Astrophysics and Computational Sciences, The Catholic University of America, Washington, DC 20064, USA
7
Dipartimento di Fisica, Università di Trento, Via Sommarive 14, 38123 Trento, Italy
8
INAF Osservatorio di Astrofisica e Scienza dello Spazio di Bologna (OAS), Via Gobetti 93/3, I-40129 Bologna, Italy
9
Dipartimento di Fisica, Università degli Studi di Roma “Tor Vergata”, Via della Ricerca Scientifica 1, I-00133 Roma, Italy
10
Dipartimento di Fisica, “Sapienza” Università di Roma, Piazzale Aldo Moro 2, I-00185 Roma, Italy
11
INAF Istituto di Astrofisica e Planetologia Spaziali, Via del Fosso del Cavaliere 100, I-00133 Roma, Italy
12
Department of Physics and Astronomy, Clemson University, Kinard Lab of Physics, Clemson, SC 29634, USA
13
Institut de Ciències del Cosmos (ICCUB), Universitat de Barcelona (IEEC-UB), Martí i Franquès, 1, 08028 Barcelona, Spain
14
ICREA, Pg Lluís Companys 23, 08010 Barcelona, Spain
15
Cahill Center for Astronomy & Astrophysics, California Institute of Technology, 1216 East California Boulevard, Pasadena, CA 91125, USA
16
INAF Osservatorio Astronomico di Roma, Via Frascati 33, 00078 Monte Porzio Catone (RM), Italy
17
ASI Agenzia Spaziale Italiana, Via del Politecnico snc, 00133 Roma, Italy
18
European Space Agency (ESA), European Space Astronomy Centre (ESAC), 28691 Villanueva de la Cañada, Madrid, Spain
19
Centro de Astrobiología (CAB), CSIC-INTA, Camino Bajo del Castillo s/n, 28692 Villanueva de la Cañada, Madrid, Spain
20
Université Grenoble Alpes, CNRS, IPAG, 38000 Grenoble, France
21
INAF IASF Palermo, Via U. La Malfa 153, I-90146 Palermo, Italy
22
Osservatorio Astronomico di Brera (INAF), Via E. Bianchi 46 Merate 23807, Italy
23
Max-Planck-Institut für Extraterrestrische Physik, Giessenbachstrasse, Garching 85748, Germany
24
Como Lake Center for Astrophysics (CLAP), DiSAT, Università degli Studi dell’Insubria, Via Valleggio 11, 22100 Como, Italy
25
Instituto de Estudios Astrofísicos, Facultad de Ingeniería y Ciencias, Universidad Diego Portales, Avenida Ejército Libertador 441 Santiago, Chile
26
INFN – Rome Tor Vergata, Via della Ricerca Scientifica 1, 00133 Rome, Italy
27
Dipartimento di Fisica e Astronomia ‘Augusto Righi’, Università degli Studi di Bologna, Via Gobetti 93/2, I-40129 Bologna, Italy
★ Corresponding author: This email address is being protected from spambots. You need JavaScript enabled to view it.
Received:
18
February
2026
Accepted:
27
April
2026
Abstract
Context. NGC 1068 has long served as the reference Compton-thick Seyfert 2 galaxy. Decades of X-ray observations have established the presence of both neutral reflection and ionized circumnuclear emission. However, the limited spectral capabilities of previous CCD and grating data in the Fe–K band have prevented a clean separation of these components, thus leaving large uncertainties on key properties, such as the optical depth, structure, and kinematics of the reprocessing and emitting regions, and on their connection to nuclear outflows and feedback.
Aims. We exploited high-resolution X-ray spectroscopy to disentangle the neutral and ionized iron emission in NGC 1068; constrained the physical properties of the cold reflector through line energies, widths, fluorescence ratios, and Compton-shoulder diagnostics; and investigated the origin, kinematics, and potential feedback role of the highly ionized Fe XXV and Fe XXVI emission.
Methods. We analyzed an XRISM/Resolve observation of NGC 1068, focusing on the Fe Kα and Fe Kβ fluorescent lines and on the Fe XXV and Fe XXVI emission complexes. Line centroid energies, intrinsic widths, flux ratios, and constraints on the Compton shoulder were derived through local spectral fitting, and compared with atomic calculations and theoretical predictions.
Results. The centroid energies of the Fe Kα and Fe Kβ lines tightly constrain the emitting material to be neutral or near neutral. The observed Fe Kβ/Kα ratio, together with the stringent upper limit on the Compton shoulder (≲8−11% of the core flux), disfavor reflection dominated by a homogeneous classical Compton-thick medium, indicating that most of the neutral Fe Kα emission arises in optically thin or moderately Compton-thick gas. The Fe XXV and Fe XXVI emission lines exhibit remarkably large velocity widths, of several thousand km s−1. These broad profiles closely resemble the integrated optical and infrared [O III] and [O IV] lines associated with the large-scale biconical outflow, and are naturally interpreted as the X-ray signature of a more highly ionized, faster, and more spatially confined phase of the same outflow.
Conclusions. The iron-K emission of NGC 1068 reveals a stratified circumnuclear environment in which neutral and highly ionized components arise in physically distinct regions. The neutral Fe K fluorescence originates predominantly in optically thin or mildly Compton-thick material, despite the persistently Compton-thick line-of-sight obscuration, indicating a geometrically complex cold reprocessor. The highly ionized iron emission lines trace a fast component consistent with a bipolar outflow on parsec scales, whose large velocities and inferred energetics suggest that it may represent an efficient channel for feedback. If similar ionized outflows and reflection geometries are common in heavily obscured Seyferts, they may constitute an underappreciated aspect of feedback and circumnuclear structure in this class of sources.
Key words: galaxies: active / galaxies: individual: NGC 1068 / galaxies: Seyfert / X-rays: galaxies
© The Authors 2026
 Open Access article, published by EDP Sciences, under the terms of the Creative Commons Attribution License (https://creativecommons.org/licenses/by/4.0), which permits unrestricted use, distribution, and reproduction in any medium, provided the original work is properly cited.
This article is published in open access under the Subscribe to Open model. This email address is being protected from spambots. You need JavaScript enabled to view it. to support open access publication.
1. Introduction
Obscured active galactic nuclei (AGN) provide a privileged view of the circumnuclear environment of accreting supermassive black holes (BHs). When the line-of-sight column density exceeds the Compton-thick threshold (NH ≳ 1.5 × 1024 cm−2), the direct X-ray continuum is strongly attenuated below ∼10 keV and no longer dominates the observed spectrum. In this high-contrast regime, fluorescent emission lines, Compton-scattered continua, and emission lines from ionized gas stand out more prominently against the diminished primary continuum. This allows the properties of the reprocessing gas, including its column density, ionization state, chemical composition, geometry, and kinematics, to be constrained from the reprocessed emission itself (e.g., Matt et al. 2000; Bianchi et al. 2012; Ramos Almeida & Ricci 2017). Nearby Compton-thick AGN therefore represent prime laboratories for mapping the structure of obscuration and reflection and for linking the reprocessing media to the multi-phase outflows observed on larger scales.
High-resolution microcalorimeter spectroscopy represents a major advance in the X-ray study of obscured AGN. By delivering an energy resolution of a few electronvolts across the entire Fe K band without dispersing the photons, and thus retaining the full effective area of the telescope, it enables direct measurements of line centroids, intrinsic widths, and profile asymmetries. The X-Ray Imaging and Spectroscopy Mission (XRISM; Tashiro et al. 2025) is the first mission to provide these capabilities for bright nearby AGN, through its Resolve instrument (Kelley et al. 2025; Ishisaki et al. 2025). These characteristics make XRISM/Resolve particularly well suited to disentangling neutral and ionized iron emission and to accessing directly the velocity structure of the reprocessing and emitting gas in heavily obscured systems.
NGC 1068 is the prototypical obscured AGN and a cornerstone of the orientation-based unification framework (Antonucci 1993). Its optical classification as a Seyfert 2 galaxy, together with the detection of broad permitted emission lines only in polarized light, provided early and compelling evidence for the presence of a luminous but heavily obscured nucleus (Antonucci & Miller 1985). Owing to its proximity and brightness, NGC 1068 has been studied in exceptional detail across the electromagnetic spectrum, revealing a complex circumnuclear environment extending from subparsec to kiloparsec scales. Optical and infrared observations have mapped a prominent narrow-line region with a well-defined biconical morphology and ordered velocity field, commonly interpreted as a large-scale outflow (e.g., Crenshaw & Kraemer 2000; Das et al. 2006; Marconcini et al. 2026). At smaller scales, infrared interferometry and high-resolution radio observations have provided direct evidence for a compact geometrically thick dusty structure surrounding the nucleus, commonly associated with the obscuring torus, and have revealed a complex morphology suggestive of clumpy dust and polar elongation (e.g., Jaffe et al. 2004; García-Burillo et al. 2016; López-Gonzaga & Jaffe 2016).
In X-rays, NGC 1068 is a textbook example of a Compton-thick AGN. Early Ginga and ASCA data showed that the direct nuclear continuum is heavily suppressed and that the spectrum is dominated by reprocessed emission, characterized by a flat hard X-ray continuum and an unusually strong Fe K emission-line complex, including both neutral and ionized components (Koyama et al. 1989; Ueno et al. 1994; Iwasawa et al. 1997). XMM-Newton later demonstrated that multiple reflecting components spanning different column densities and ionization states are required, pointing to a complex and stratified circumnuclear reprocessing medium (Matt et al. 2004). At hard X-ray energies, observations with BeppoSAX, Suzaku, and more recently NuSTAR have contributed to building a scenario in which the Compton reflection hump and the neutral Fe Kα emission do not originate entirely from the same material, pointing to the presence of multiple reflecting regions with different column densities and spatial distributions (Bauer et al. 2015). In addition, NuSTAR revealed variability of the hard X-ray emission on timescales of months to years, interpreted as changes in the column density or covering factor of the obscuring material along the line of sight (Marinucci et al. 2016; Zaino et al. 2020), thus providing direct evidence that the circumnuclear reprocessor in NGC 1068 is not static, but dynamically evolving. In addition, X-ray polarimetry with the Imaging X-ray Polarimetry Explorer (IXPE) has revealed significant 2−8 keV polarization in NGC 1068, with a polarization angle perpendicular to the parsec-scale radio axis, confirming that the observed emission is dominated by scattered radiation and providing direct geometrical constraints on the circumnuclear obscurer, similarly to the Circinus galaxy (Marin et al. 2024).
High angular resolution Chandra imaging showed that the soft X-ray emission is spatially extended over several hundred parsecs, with a clear correspondence to the ionization cones observed at optical wavelengths (e.g., Young et al. 2001; Ogle et al. 2003). This spatial association strongly suggests a physical connection between the soft X-ray–emitting gas and the large-scale outflowing narrow-line region, as observed in other obscured AGN (Bianchi et al. 2006). From a spectroscopic point of view, high-resolution observations with Chandra gratings and XMM-Newton/RGS revealed a rich emission-line spectrum dominated by He- and H-like transitions of light elements together with prominent radiative recombination continua, unambiguously indicating that photoionization is the dominant emission mechanism, as commonly found in obscured AGN (e.g., Guainazzi & Bianchi 2007). Detailed modeling of these spectra showed that multiple ionization components are required, spanning a broad range of ionization parameters and column densities, with little to negligible contribution from collisionally ionized plasma (Kinkhabwala et al. 2002; Ogle et al. 2003; Kallman et al. 2013; Grafton-Waters et al. 2021). In this context, radiation pressure compression (RPC) provides a physically motivated framework to describe the soft X-ray emission in NGC 1068 and in obscured AGN more generally, naturally producing a stratified ionization structure that successfully reproduces the observed emission measure distribution (e.g., Bianchi et al. 2019).
In this work we present the first high-resolution X-ray microcalorimeter spectrum of NGC 1068 obtained with XRISM/Resolve. These data provide an unprecedented view of the Fe K band in this prototypical Compton-thick AGN, enabling a detailed characterization of the neutral and ionized iron emission and their kinematic properties in the context of the complex, multi-phase circumnuclear environment described above.
2. Observations and data reduction
NGC 1068 was observed with the XRISM observatory on 2025 February 08 for a total on-source exposure of 115 ks (ObsID 201116010; PI: S. Bianchi). Both the Resolve microcalorimeter spectrometer (Ishisaki et al. 2025), in “PX_NORMAL” data mode, and the Xtend CCD imager (Noda et al. 2025), in full window mode, operated simultaneously during the observation. The target was placed at the nominal Resolve aimpoint. At the time of the observation the Resolve gate valve was closed, which restricted the energy band to ≳1.7 keV. The data were reprocessed with the XRISM pipeline included in HEASoft 6.36, using the calibration database (CALDB) 20250915. We applied standard screening criteria and a filter of the geomagnetic cutoff rigidity (COR) with a threshold of 6. The resulting net exposure is 110 ks.
For Resolve the source spectrum was extracted from the full field of view (∼3′ diameter), excluding pixel number 27, as recommended to avoid calibration uncertainties. This aperture fully encompasses the extended X-ray emission of NGC 1068, including the narrow-line region and circumnuclear reflection structures known from previous high-resolution imaging. Large (L) type redistribution matrix files (RMFs) and ancillary response files (ARFs) were produced with the pipeline tools, including gain and line spread function corrections. We selected only the high-resolution (Hp) events, following the XRISM data analysis guidelines; these account for 94% of all the events during this observation. The background spectrum was generated using the stacked non-X-ray background (NXB) event file provided by the XRISM team1. We first generated a good time interval (GTI) file for the source and the NXB events, with the same filtering criteria. Taking into account that the level of background may depend on the COR, we filtered the NXB event file with the same COR as per the source extraction. The task rslnxbgen was then used to extract the NXB spectrum from this screened background event file, considering only Hp events and excluding pixel 27. The Resolve light curve shows no evidence for flux variability during the 110 ks exposure. Nonetheless, we split the observation into two equal time segments and fitted the resulting spectra separately. No significant changes were detected in flux or spectral shape within the statistical uncertainties, and the full dataset was used for the final analysis.
All spectra were grouped using ftgrouppha with optimal binning (Kaastra & Bleeker 2016), with the additional requirement of a minimum signal-to-noise ratio of 3, and fitted using the Cash (1979) statistics as implemented in XSPEC v12.15.1 (Arnaud 1996). Unless otherwise stated, errors are quoted at the 1σ confidence level (c.l.) for one interesting parameter, and upper limits at 99% c.l. The redshift of NGC 1068 was fixed at z = 0.003793 (Huchra et al. 1999, based on H I 21 cm measurements compiled by Bottinelli et al. 1990), but we assume a luminosity distance DL = 10.1 Mpc (Padovani et al. 2024, see also Markham et al. 2026).
3. Spectral analysis
We performed a blind search for narrow emission and absorption features over the entire 1.7−12 keV Resolve band using a Gaussian line-scan procedure. At each trial energy, a narrow Gaussian component was added to the best-fit continuum model and its normalization was stepped logarithmically over positive and negative values, while recording the change in fit statistic. The resulting two-dimensional maps were used to identify statistically significant features.
Emission lines detected at more than 99% c.l. are shown and labeled in Fig. 1, and listed in Table 1. In addition to these lines, several other features are present at lower significance throughout the full 1.7−12 keV band. A more comprehensive and dedicated line-scan analysis, including a detailed assessment of statistical significance and physical interpretation, will be presented in a forthcoming paper. To aid the interpretation of the following results, we note that the in-flight calibration of Resolve demonstrates an energy determination accuracy of ≲0.2 eV (Porter et al. 2025), corresponding to ≲10 km s−1 in the Fe K band.
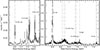 |
Fig. 1. XRISM/Resolve spectrum of NGC 1068 showing only emission lines detected at ≥99% confidence in the blind line scan (Sect. 3). For clarity, the detected lines are displayed in two separate energy bands, which encompass all features meeting the detection criterion. Vertical dashed lines mark the centroid energies of the detected features, which are labeled in the figure (see Table 1). |
Measured parameters of the main emission lines in the XRISM/Resolve spectrum of NGC 1068.
3.1. The neutral fluorescence lines
We started with a local fit in the energy range ∼6.0 − 6.5 keV, adopting a power law with Γ = 12 and free normalization as the baseline continuum. The neutral Fe Kα line is modeled using a zbfeklor component, available in XSPEC, which provides a phenomenological description of its intrinsic profile as measured in laboratory experiments and represents the current standard in high-resolution X-ray spectroscopy. In this model, the line is parameterized using seven Lorentzian components, yielding the most detailed representation of the Kα1–Kα2 doublet, which corresponds to the two main fluorescent transitions with an expected 2:1 intensity ratio. The relative energies and intensities of the components are fixed to the laboratory measurements of Hölzer et al. (1997). Higher-order satellite lines (Kα3, 4) are not included in this model; their expected contribution is ≲0.8% of the main Fe Kα emission (Shigeoka et al. 2004; Diamant et al. 2006), and is therefore negligible at the signal-to-noise of the present data. The only free parameters are the normalization and a velocity dispersion σ in km s−1, which broadens the overall line profile, as well as a velocity shift3 introduced with the convolution model vashift. The best-fit parameters are  and v = −36 ± 13 km s−1. Previous Chandra High Energy Transmission Grating (HETG) analyses reported Fe Kα widths of order σ ∼ 700 km s−1 or larger (Ogle et al. 2003; Kallman et al. 2013; Andonie et al. 2022), but Liu (2016) showed that first-order HEG measurements are likely overestimated and that the line is consistent with being unresolved when higher-order spectra are considered. Significant residuals are still present after this fit, particularly at the blue wing and the core of the line. We note that similar residuals are also apparent in the Chandra/HETG data (Kallman et al. 2013).
On the other hand, any Compton shoulder (CS), if present, appears to be very weak, given the absence of prominent residuals on the red wing of the line. To quantitatively test this, we built a simple top-hat profile extending from 6.24 to 6.40 keV, normalized to the unit area, broadened and shifted as the narrow core. This shape mimics the roughly flat energy distribution of first-order Compton down-scattered photons expected from reflection in cold optically thick matter (see, e.g., Matt 2002), while allowing a direct measurement of the total shoulder flux as a fraction of the core. The CS modeled in this way is not statistically required by the data, with an upper limit of 8% of the core flux. Replacing this CS component with a template based on the smoother profile that accounts for bound-electron scattering, as implemented in SKIRT (Vander Meulen et al. 2023)4, we obtain an upper limit of 11% of the core flux.
A very significant improvement of ΔC = 63 for 2 degrees of freedom (d.o.f.) is instead obtained by adding another zbfeklor, which reproduces a much broader (σ = 2400 ± 400 km s−1) base of the line. A further modest improvement (ΔC = 8.5 for 1 d.o.f.) comes from allowing the broad base to be shifted by  km s−1, confirming that it mostly corrects the blue wing of the line, with less effect on the red wing. The flux of the narrow core is 5.8 ± 0.2 × 10⁻⁵ photons cm−2 s−1, corresponding to an equivalent width (EW) of 710 ± 20 eV with respect to the local continuum; the flux of the broad component is 0.39 ± 0.06 that of the narrow core. The overall Fe Kα line is well reproduced by this model, with no obvious residuals, except for a weak resolved feature at ∼6.19 keV, barely above the 99% detection limit (see upper panel in Fig. 2).
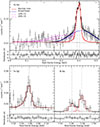 |
Fig. 2. Local fits to the neutral fluorescence lines in the XRISM/Resolve spectrum of NGC 1068. Top: Fe Kα complex (6.0−6.5 keV, rest frame). The black points show the data and the black histogram is the best-fitting model, consisting of a narrow core (red) and a broad base (blue; see text) added to the baseline continuum (gray). The magenta dashed curves show bound electron-scattering Compton-shoulder profiles with fluxes of 10 and 20% of the core. Bottom left: Fe Kβ band. Bottom right: Ni Kα band. The vertical dotted lines mark the nominal centroid energies of the neutral transitions. |
As a further step, we performed a combined fit with the neutral Fe Kβ and Ni Kα lines, adding the energy ranges ∼7 − 7.1 and ∼7.4 − 7.5 keV. In all three local fits the baseline continuum model is a power law with Γ = 1 and a free independent normalization. The Fe Kβ line is modeled with a zbfekblor component, which is a four-Lorentzian approximation to the line profile with energies, widths, and relative amplitudes as taken from Hölzer et al. (1997). The Ni Kα line is modeled with two zvgaussian components, corresponding to the Kα doublet, with energies fixed at 7.4781 and 7.4608 keV and a fixed intensity ratio of 2:1, since an experimental line profile for Ni is not available in XSPEC. The velocity shifts for Fe Kβ and Ni Kα are 30 ± 50 and  km s−1, respectively. The velocity broadening is essentially unconstrained for Fe Kβ, while for Ni Kα we obtain
  km s−1. Given these results, we tied both the velocity shift and broadening to be the same for the Fe Kα core, Fe Kβ, and Ni Kα lines, resulting in a good fit (C = 138/129 d.o.f.; see Fig. 2), with a common
  and v = −30 ± 12 km s−1. The Fe Kβ/Kα (core) ratio is 0.103 ± 0.016, while the Ni Kα/Fe Kα (core) ratio is 0.066 ± 0.012. When a broad component with the same width as that measured for the broad Fe Kα line is also included for Fe Kβ and Ni Kα, the resulting upper limits on the broad-to-core flux ratio are significantly higher than the value observed for Fe Kα, and therefore do not provide a meaningful constraint. We note that the Fe Kβ line is contaminated by the blue wing of the broad Fe XXVI feature (see next section). When this contamination is modeled, the inferred Fe Kβ flux decreases by approximately 15%, remaining consistent within 1σ with the ratio reported here.
3.2. The ionized medium
We performed a local fit in the ∼6.5 − 7.1 keV band, adopting a Γ = 1 power law as the baseline continuum and including the Fe Kβ emission line modeled in the previous section. Two broad Gaussian lines are required by the data, with rest-frame centroid energies of 6.674 ± 0.004 and 6.980 ± 0.010 keV and widths of  and 2700 ± 500 km s−1. These features are readily identified as emission from Fe XXV and Fe XXVI (see Fig. 3). Narrow residuals remain at ∼6.56 and ∼6.605 keV (observed), but modeling them as emission lines is not significant at the 99% c.l. Including narrow Gaussian components at these energies does not significantly alter the properties of the broad lines in this phenomenological fit, nor does it affect the parameters derived from the models presented in the following sections, which remain consistent within the uncertainties.
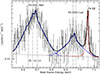 |
Fig. 3. XRISM/Resolve spectrum of NGC 1068 with the broad Fe XXV Heα and Fe XXVI Lyα emission lines. The spectrum is shown in the rest frame and is fitted with the outflow model described in Sect. 4.2.1. The model components for the Fe XXV and Fe XXVI lines are shown in blue; the total model is shown in black. The neutral Fe Kβ line, shown in red, is also included in the fit. The vertical dotted lines mark the laboratory energies of the main transitions. |
We therefore modeled the Fe XXVI feature as the Lyα doublet, with rest-frame energies fixed at 6.973 and 6.952 keV, a fixed intensity ratio of 2:15, and a common velocity width and shift. The Fe XXV Heα complex was modeled with four narrow components (w, x, y, z) at 6.700, 6.682, 6.668, and 6.637 keV6, tying their velocity width and shift to those of the Fe XXVI doublet. The relative intensities within the Fe XXV multiplet are basically unconstrained; for reference we report the standard diagnostic ratios  and G ≡ (x + y + z)/w > 0.2. Any centroid shift is also poorly constrained, with
  km s−1, while the common width is σ = 2400 ± 200 km s−1. The fit is statistically equivalent to the previous two-Gaussian fit, with C = 132/132 d.o.f.
Local fits were also performed in the range ∼2 − 2.7 keV to model the Si XIV, S XV, and S XVI lines. For the Lyα transitions of S XVI and Si XIV, we adopted doublets with fixed 2:1 intensity ratios, using NIST (Kramida et al. 2024) atomic energies of E1 = 2.6227 keV and E2 = 2.6197 keV, and E1 = 2.00608 keV and E2 = 2.00433 keV, respectively. The best-fit widths and shifts are  km s−1 and
  km s−1 for S XVI, and σ = 950 ± 250 km s−1 and v = −450 ± 200 km s−1 for Si XIV. For S XV Heα we used a triplet at 2.4304, 2.448, and 2.4606 keV with free relative normalizations, obtaining
  km s−1 and
  km s−1. When all the lines are fitted simultaneously, we obtain a common width of
  km s−1 and a shift of v = −100 ± 140 km s−1, with C = 32/25 d.o.f.
4. Discussion
4.1. The cold reflector
4.1.1. Location of the line-emitting region
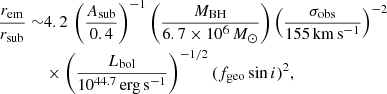
Assuming that the observed Gaussian broadening of the neutral fluorescent lines traces predominantly Keplerian motion at a characteristic emitting radius rem, we parameterize the line-of-sight velocity dispersion as σobs = fgeo vK sin i, where vK = (GMBH/rem)1/2 is the Keplerian speed, i is the inclination of the rotating structure with respect to the line of sight, and fgeo accounts for geometric effects. Adopting MBH = 6.7 × 10⁶ M⊙ (Padovani et al. 2024) and σobs = 155 km s−1 (see Sect. 3.1 and Table 1), this yields rem ≃ 1.2 (fgeo sin i)2 pc. We can compare this radius to the dust sublimation radius, estimated using the generic scaling  pc, where L45 ≡ Lbol/1045 erg s−1 and Asub is a normalization that depends on grain properties and sublimation temperature (Barvainis 1987; Nenkova et al. 2008). Combining the two, we obtain
 (1)
(1)
where the numerical factor is evaluated for our fiducial MBH and Lbol (Padovani et al. 2024), the measured σobs reported above, and Asub = 0.4, as valid for a sublimation temperature of 1500 K (Barvainis 1987; Nenkova et al. 2008).
Independent infrared and submillimetre observations of NGC 1068 directly resolve dusty structures over a similar range of radii: near-IR interferometry with VLTI/GRAVITY locates the hottest dust at r ≃ 0.2 pc, commonly identified with the dust sublimation region (GRAVITY Collaboration 2020; Vermot et al. 2021), while mid-IR interferometry with VLTI/MIDI requires warm dust components extending over a few parsecs (Raban et al. 2009; López-Gonzaga et al. 2014), and ALMA observations resolve a compact molecular and dusty structure with a characteristic diameter of ∼7 pc (García-Burillo et al. 2016, 2019). Thus, the radius inferred from the Fe Kα line width lies within the same order of magnitude as the directly observed dusty structures in NGC 1068, and is only a factor of a few larger than the hot-dust radius associated with the sublimation zone.
Incidentally, from Eq. (1) rem = rsub requires fgeo sin i ≃ 0.49. Two limiting cases are illustrative. If fgeo ≃ 1 (i.e., the measured Gaussian width closely tracks the full projected Keplerian speed scale), then sin i ≃ 0.49 (i ≃ 29°), which is inconsistent with the nearly edge-on orientation inferred for NGC 1068 from independent constraints based on NLR kinematics, H2O maser disk modeling, and mid-infrared interferometry (e.g., Das et al. 2006; Greenhill et al. 1996; Raban et al. 2009). Conversely, if a dust-sublimation bounded structure is close to edge-on (sin i ≃ 1), then fgeo ≃ 0.5, as might be expected for a rotation-dominated, flattened, or ring-like structure.
The emission radius inferred from the width of the Fe Kα core indicates that most of the line is produced in the inner circumnuclear region, on scales on the order of 1 parsec, although it does not exclude that a fraction of the emission arises at larger distances, contributing to a narrower profile. Consistently, the Resolve Fe Kα core flux is in agreement with that measured in the Chandra HETG spectra by Ogle et al. (2003) and Kallman et al. (2013), whose extractions encompass the central few arcseconds, corresponding to physical scales of order 100−200 pc (1″ ≃ 49 pc). Chandra observations nevertheless also provide evidence for Fe Kα emission on larger scales: Ogle et al. (2003) detected weaker off-nuclear fluorescence, while Kallman et al. (2013) showed that the measured line flux depends on the extraction width. A more explicit decomposition was presented by Bauer et al. (2015), who separated a compact (< 2″) and an extended (2″ − 75″) component, also using ACIS-S data, and found that about 30% of the Fe Kα core flux originates outside the central 2″ (but see Andonie et al. 2022, for evidence that this value may be overestimated and should be regarded as an upper limit when pile-up effects are properly accounted for). The intrinsic complexity of the line profile, as further highlighted by the Resolve spectrum, particularly in the modeling of the broad base, limits a more precise determination of the spatially extended fraction.
4.1.2. Ionization state and elemental abundances
The upper panel of Fig. 4 shows the centroid energy of the Fe Kβ line as a function of ionization stage, compared with the value measured in the XRISM/Resolve spectrum. Experimental measurements of the Fe Kβ centroid for neutral iron by Bearden (1967) and Hölzer et al. (1997) are in good agreement with the theoretical values computed by Palmeri et al. (2003), indicating that the absolute reference energy of the line is robust. The observed centroid is consistent with iron in ionization states lower than Fe V, while Fe VI and higher ionization stages are excluded at the ≳3σ level, as they would predict centroid shifts significantly larger than observed (Palmeri et al. 2003; Nagai et al. 2026). Although the Fe Kα line is measured with smaller statistical uncertainties, its diagnostic power is limited by significantly larger uncertainties in the expected centroid energies. Experimental measurements of neutral Fe Kα by Bearden (1967) and Hölzer et al. (1997) are mutually consistent, whereas theoretical calculations by Palmeri et al. (2003) predict different centroid energies for the individual Kα1 and Kα2 components (corresponding to offsets of ∼ − 70 and ∼ − 30 km s−1, respectively), reflecting the complex line profile produced by many closely spaced transitions. The same calculations also predict a redshift of the Fe Kα centroid with increasing ionization, at least in the first stages of ionization; for example, the shift from the neutral value to Fe VI corresponds to a velocity offset of ∼150 km s−1. Instead, the XRISM spectrum shows a blueshift with respect to the neutral reference. This again argues against a significantly ionized origin for the fluorescent emission and suggests that any measured blueshift is more naturally interpreted as being due to gas kinematics rather than ionization effects.
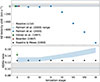 |
Fig. 4. Upper panel: Velocity shifts of the Fe Kβ centroid energy relative to the neutral reference of Hölzer et al. (1997), shown as a function of ionization stage. Blue diamonds show the shifts predicted by the atomic calculations of Palmeri et al. (2003), while the gray horizontal band indicates the value measured in the XRISM/Resolve spectrum (±1σ). The green square and red triangle mark the experimental neutral Fe Kβ centroid energies from Hölzer et al. (1997) and Bearden (1967), respectively. The measured centroid is consistent with neutral iron and rules out, within the statistical uncertainties, ionization stages higher than Fe V. Lower panel: Fe Kβ/Kα ratio as a function of ionization stage. The black circles show the values predicted by Kaastra & Mewe (1993), while the light blue shaded region indicates the envelope spanned by the theoretical calculations of Palmeri et al. (2003). The green square marks the experimental neutral Fe Kβ/Kα ratio from Hölzer et al. (1997), and the horizontal band indicates the ratio measured in the XRISM/Resolve spectrum (±1σ). The observed ratio is consistent, within the uncertainties, with the theoretical expectation for neutral Fe in the optically thin limit, although marginally lower than the nominal value. |
The lower panel of Fig. 4 shows that the observed Fe Kβ/Kα ratio is lower but marginally consistent within 1σ with the range predicted for neutral iron in the optically thin limit by current atomic calculations7 (e.g., Kaastra & Mewe 1993; Palmeri et al. 2003; however, we note the higher ratio reported by Hölzer et al. 1997). In the calculations of Kaastra & Mewe (1993), the Kβ/Kα ratio shows no significant variation with ionization stage at least up to Fe IX. In contrast, the calculations of Palmeri et al. (2003) predict a marked increase in the ratio at intermediate ionization stages, around Fe IV–Fe V. A decrease in the Kβ/Kα ratio is expected only at substantially higher ionization stages, which are already robustly excluded by the centroid-energy constraints discussed above. We also investigated the effect of optical depth on the expected Fe Kβ/Kα ratio by computing the line emission in the optically thick, semi-infinite slab limit using the analytical formalism of Basko (1978), adopting photoelectric cross sections from Verner et al. (1996) and fluorescent yields from Kaastra & Mewe (1993). The incident continuum was modeled as a power law with photon index 1.7 ≤ Γ ≤ 2.2, over which the angle-averaged Fe Kβ/Kα ratio shows only a weak dependence on Γ. In this regime, reflection from Compton-thick material is expected to enhance the Fe Kβ/Kα ratio with respect to the optically thin case by a factor of ∼8 − 15% (depending on the inclination, and including only unscattered photons) because the photoelectric opacity decreases with energy, allowing Kβ photons to escape more efficiently than Kα photons. This increases the discrepancy with the observed value rather than alleviating it. Taken together, the line centroid energies and relative line intensities consistently point to reflection from predominantly neutral iron close to the optically thin limit, indicating that, at the parsec-scale distances inferred above, the emitting material is not compatible with a homogeneous Compton-thick reflector and instead arises mostly in lower column density gas.
The observed Ni Kα/Fe Kα photon-flux ratio measured in the XRISM/Resolve spectrum of NGC 1068 is 0.066 ± 0.012. In the optically thin limit, Yaqoob & Murphy (2011a) predict a Ni Kα/Fe Kα ratio of 0.033 for Γ = 2, with a very weak dependence on photon index and none on geometry or covering factor. This implies a nickel overabundance, with respect to Anders & Grevesse (1989), by a factor of 2.0 ± 0.4. Using the same optically thick slab calculations described above, we also computed the Ni Kα/Fe Kα core-to-core line ratio in the Compton-thick limit. As for iron, the angle-averaged Ni/Fe ratio shows only a very weak dependence on Γ, and exceeds the optically thin prediction by only about 2%, leaving unchanged the required nickel overabundance. Evidence for a nickel overabundance in NGC 1068 was already suggested by previous studies based on lower-resolution data (Matt et al. 2004), with similar indications also reported for the Circinus galaxy (Molendi et al. 2003; The XRISM Collaboration 2026).
4.1.3. The Compton shoulder and reflector column density
We conclude this section with a particularly striking result that emerged from the analysis reported in Sect. 3.1, namely the apparent weakness of the CS associated with the neutral Fe Kα line. Given the long-standing classification of NGC 1068 as a prototypical Compton-thick Seyfert 2, and the presence of a strong narrow Fe Kα core, a prominent CS would naturally be expected. Instead, the data reveal no clear evidence for a substantial red Compton wing, allowing us to place an upper limit of ∼8−11% (depending on the adopted shape) on the CS flux relative to the line core.
In standard reflection scenarios in which the same homogeneous optically thick medium both obscures the nucleus and produces the bulk of the fluorescent emission, Monte Carlo calculations predict CS-to-core ratios of order ≳15−20%, depending on geometry and inclination (e.g., Matt 2002; Yaqoob & Murphy 2011b). The significantly weaker CS inferred here therefore disfavors a scenario in which the bulk of the observed Fe Kα emission arises in a uniform, classical Compton-thick reflector. This conclusion is fully consistent with the independent constraints derived above from the Fe Kβ/Fe Kα ratio, which already disfavor very large effective column densities in the line-emitting region. It is further supported by the depth of the Fe K absorption edge, for which we measure an optical depth τK = 0.85 ± 0.15. This latter constraint is more sensitive to the adopted continuum modeling within the simplified phenomenological fits presented here, and should therefore be treated with caution; nevertheless, it remains broadly suggestive of a reflector of moderate effective column density.
A natural interpretation is that absorption and reflection are governed by different characteristic column densities. In this scenario, the line-of-sight obscuration in NGC 1068 is persistently Compton-thick, consistent with an inner torus that reaches column densities high enough to be self-obscuring, so that reflection produced at small radii is itself strongly attenuated along our line of sight. As a result, emission from the highest column-density regions remains largely hidden, and the observed time-averaged reflected spectrum is dominated by more extended reprocessing material, as also indicated by mid-infrared interferometric studies (e.g., Raban et al. 2009) and by the evidence for a spatially extended component of the Fe Kα emission discussed above. This naturally dilutes the observed CS relative to the line core. A quantitative assessment of this picture, however, requires a comprehensive, self-consistent treatment of the full reflection spectrum. This will be addressed in a future companion paper, based on joint modeling of the XRISM/Resolve spectrum together with the simultaneous Xtend and NuSTAR data, using radiative transfer simulations (e.g., SKIRT; Vander Meulen et al. 2023) to robustly constrain the geometry and column-density distribution of the cold reflector.
4.2. A warm bipolar outflow scenario
High spatial resolution HST spectroscopy, together with MUSE integral-field spectroscopy and 3D kinematic modeling, has revealed that the NLR of NGC 1068 hosts very fast ionized gas components, with [O III] λ5007 clouds reaching deprojected velocities of up to ∼2000 km s−1 while flowing within a well-defined biconical outflow structure (e.g., Crenshaw & Kraemer 2000; Das et al. 2006; Marconcini et al. 2026). When the emission from the entire NLR is integrated, the superposition of clouds spanning this wide velocity field naturally produces a broad [O III] line profile, as explicitly illustrated in Fig. 4 of Crenshaw et al. (2010). The same phenomenology is observed at higher ionization: recent JWST integral-field spectroscopy has demonstrated that the [O IV] 26 μm emission traces the same global biconical outflow geometry inferred from the optical data, but requires a systematically faster kinematic component, with a deprojected maximum velocity larger by ∼300 km s−1 with respect to [O III] (Marconcini et al. 2026). These results indicate that higher-ionization lines preferentially sample dynamically hotter phases of the same outflow. In this context, the broad Fe XXV and Fe XXVI emission lines observed with XRISM/Resolve can be naturally interpreted as arising from an even more highly ionized component of the same large-scale outflow, whose kinematic signatures are integrated over the full extent of the emitting region.
4.2.1. Model setup and comparison with the data
We assume that the broad Fe XXV and Fe XXVI lines are emitted directly by a high-velocity outflow in the polar direction, extending above and below the obscuring torus. Following previous modeling of the optical [O III] and infrared [O IV] lines in NGC 1068 (Das et al. 2006; Marconcini et al. 2026), we adopted a biconical outflow with a half-opening angle of 30° and an angular width of 20° (see Fig. 5), viewed at an inclination of i = 85°. The radial velocity field is called the Hubble flow, and has a velocity magnitude that varies with radial distance (Das et al. 2005, 2006). From r = 0 up to the turnover radius rt, the velocity increases linearly from zero to vmax. Beyond rt, the velocity decreases linearly from vmax down to zero at r = rmax.
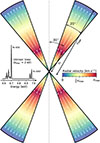 |
Fig. 5. High-velocity bi-polar outflow model adopted to reproduce the broad Fe XXV and Fe XXVI lines observed with XRISM. The intrinsic line spectrum was calculated with XSTAR; the integrated velocity profile was calculated with the SKIRT code. |
The intrinsic line spectra were computed with XSTAR (Kallman & Bautista 2001) (similar intrinsic spectra are obtained with CLOUDY, last described by Gunasekera et al. 2025a), assuming photoionized gas illuminated by a generic AGN spectral energy distribution, and adjusted such that, after convolution with a phenomenological broadening model, the profiles reproduce the observed line shapes. We applied an additional Gaussian broadening of 2 eV (∼90 km s−1 at these energies) to the intrinsic line spectrum, consistent with the local velocity dispersion measured with JWST (Marconcini et al. 2026), which is much smaller than the broadening observed in the Fe XXV and Fe XXVI line wings with XRISM. The radial emissivity profile of the biconical outflow is proportional to r−2, as expected for radiation-compressed, ionization-bounded gas (e.g., Stern et al. 2014). With this choice, the model is scale-invariant, and the predicted line profile is insensitive to the absolute values of rt and rmax, depending only on the velocity field and geometry of the biconical outflow (see also Sect. 4.2.2).
The integrated velocity profile corresponding to this model was calculated with the SKIRT code (Camps & Baes 2015, 2020), adopting a ConicalShellGeometry source with a HubbleRadialVectorField8 velocity field. All model parameters were fixed to the optical [O III] model (Das et al. 2006), except for vmax, which was varied between 2000 and 18 000 km s−1. The simulation results were converted into an XSPEC tabulated additive model, which can be directly fitted to the XRISM data.
The best fit using this model is equivalent to the ones presented in Section 3.2, with C = 138/134 d.o.f., and is shown in Fig. 3. The free parameters are a Fe XXVI/Fe XXV ratio of 0.28 ± 0.05, a common shift of 460 ± 90 km s−1, and a common vmax = 11 000 ± 1000 km s−1. No improvement is found if we allow vmax to be different for the two lines, while a marginal improvement (ΔC = 5 for 1 d.o.f. less) if the two velocity shifts are allowed to vary independently, with the velocity shift for Fe XXVI being consistent with 0. We note that the derived vmax is significantly higher than that found for the optical and the IR outflows.
To explore potential degeneracies that could reduce the inferred vmax, we ran a large grid of SKIRT simulations, varying all parameters relative to the optical [O III] reference values (i.e., the turnover radius, half-opening angle, angular width, maximum radius, inclination, and radial emissivity profile). We find that none of these parameters are constrained by the data, and none can significantly reduce vmax. This remains true even when allowing for large intrinsic line broadening via Gaussian smoothing, while increasing the viewing angle from 85° to 90° leads only to a marginal reduction of the best-fit vmax. This behavior is expected since the velocity field is anchored to the spatially resolved, empirically derived HST model of Das et al. (2006), whereas the XRISM spectrum is sensitive only to the velocity distribution integrated over the polar outflow; different radial profiles with the same emissivity-weighted average velocity therefore produce essentially indistinguishable line shapes. Overall, this exercise should be regarded as a toy model meant to compare the X-ray emitting gas with the optical outflow: while the higher velocity is robust, the remaining model parameters are not significantly constrained by the present data.
4.2.2. Consistency and physical implications
Having shown that the highly ionized Fe emission is broadly consistent with our outflow interpretation, we now perform a simple internal consistency check. For simplicity, we focus on the brightest Fe XXV He-α line and assess whether a biconical structure illuminated by the intrinsic AGN continuum can plausibly reproduce its observed luminosity, given the source’s hard X-ray output.
To this end, we adopt the optically thin formalism of Matt et al. (1996) and Yaqoob et al. (2001), in which the line luminosity is proportional to the number of continuum photons absorbed in the Fe K shell, multiplied by an effective fluorescent yield. We assume an AGN continuum described by a power law with photon index Γ = 2, normalized to an intrinsic 2 − 10 keV luminosity L2 − 10 = 1043.4 erg s−1 (Padovani et al. 2024); the medium is optically thin to Fe K-shell photoabsorption and is characterized by a uniform hydrogen column density along all directions from the central source intersecting the emitting region. Within this approximation, the geometry enters only through the covering factor Cf, defined as the fraction of solid angle subtended by the gas as seen from the central source.
The observed luminosity of the Fe XXV He-α complex is LFe XXV = 1039.75 erg s−1. For He-like iron, line emission arises from recombination rather than fluorescence; we therefore adopt an effective fluorescent yield Yeff = 0.76 (Matt et al. 1996), defined as the probability that the recombination cascade produces a K-shell photon, a K-shell threshold energy EK = 8.83 keV and a photoionization cross section at threshold σK(EK) = 1.96 × 10⁻²⁰ cm2 (Verner et al. 1996), with an E−3 dependence above. The adopted iron abundance is taken from Anders & Grevesse (1989), and the fraction of iron in the He-like charge state is fixed at its peak of fXXV = 0.5 (e.g., Mehdipour et al. 2016).
Under these assumptions, the ratio of the Fe XXV line luminosity to the intrinsic 2 − 10 keV luminosity depends only on the product Cf⟨NH⟩, where ⟨NH⟩ denotes the characteristic hydrogen column density encountered by rays intersecting the emitting region. Adapting and solving the Yaqoob et al. (2001) and Matt et al. (1996) equations yields
 (2)
(2)
For our hollow biconical geometry, defined by polar angles θ = 20° −40° from the symmetry axis, the covering factor is Cf = cos20° −cos40° = 0.1736. This implies an average hydrogen column density ⟨NH⟩ = 2.9 × 1022 cm−2, representative of the Fe XXV-emitting gas along directions intersecting the bicone walls. We therefore conclude that, at the order-of-magnitude level probed by this photon-budget test, a bipolar cone illuminated by the intrinsic AGN continuum is fully capable of producing the observed Fe XXV He-α luminosity. From this energetic standpoint, the proposed geometry is thus a viable and self-consistent scenario.
We emphasize that this photon-budget test accounts only for the recombination-driven component of the Fe XXV He-α complex. As discussed by Matt et al. (1996) and Bianchi et al. (2005a), resonant scattering can further enhance the Fe XXV emission in photoionized gas. Any such contribution would reduce the number of recombinations required and thus lower the column density needed to reproduce the observed line luminosity; the values of Cf⟨NH⟩ derived above should therefore be regarded as conservative upper limits on the required column. In any case, the observed large velocity spread is expected to reduce the efficiency of resonant scattering through Doppler de-saturation, while simultaneously suppressing resonant trapping and self-absorption that could otherwise reshape the line profile. The observed ionized Fe profiles are instead smooth and well reproduced by a simple biconical outflow model, indicating that these effects are not dominant.
We can extend this reasoning by combining the above column-density constraint with the ionization requirements for Fe XXV. The ionization parameter is defined as ξ ≡ Lion/(nHr2), where Lion is the ionizing luminosity. For NGC 1068 we adopt a bolometric luminosity log Lbol = 44.7 (Padovani et al. 2024), and assume  following Panda (2022), yielding Lion ≃ 2.5 × 1044 erg s−1. The Fe XXV ionic fraction peaks at ξ ≃ 103 erg cm s−1 (e.g., Mehdipour et al. 2016). Requiring this ionization state therefore implies that, if Fe XXV is produced over an extended range of radii, the gas density must scale as nH ∝ r−2. Combining this with the inferred column density, the characteristic radial thickness of the Fe XXV-emitting layer at radius r is
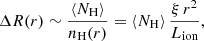
which increases rapidly with radius as ΔR ∝ r2. Imposing the minimum geometrical requirement ΔR ≲ r yields an upper bound on the radius at which a recombination-dominated Fe XXV component can be sustained,
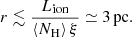 (3)
(3)
This indicates that, within a pure recombination scenario and assuming a roughly constant ionization parameter, the bulk of the Fe XXV emission is naturally expected to originate on parsec scales. This scale is comparable to our estimate for the bulk of the neutral Fe Kα emission derived from its velocity width (see Eq. 1). In a classical unification picture, this would suggest that the ionized outflow is observed at radii comparable to those of the dominant neutral reflector, implying limited radial separation between the obscuring structure and the emitting gas (e.g., Antonucci 1993). However, the neutral Fe Kα emission may also be partially or predominantly produced in a more extended medium, as suggested by the weak CS and by evidence for spatially extended reflection (see Sect. 4.1.3). In that case, the material responsible for blocking our direct view of the nucleus need not be co-spatial with the bulk of the neutral Fe Kα emitter, but may instead reside at smaller radii. In this geometry, the inner obscurer can remain sufficiently stable along the line of sight to avoid producing detectable variability below 10 keV, while changes in column density or covering factor affect only the hard X-ray transmitted component above 10 keV (Marinucci et al. 2016; Zaino et al. 2020). The ionized outflow can then be directly observed without requiring a finely tuned patchy configuration.
Similarly to the neutral Fe Kα line, a comparison between the ionized Fe line fluxes measured by XRISM/Resolve and those reported from Chandra/HETG provides constraints on the spatial origin of the ionized emission. For Fe XXVI, the Resolve flux is consistent, within the uncertainties, with the HETG nuclear measurements reported by Ogle et al. (2003) and Kallman et al. (2013), indicating that most of the emission is produced within the ∼100−200 pc nuclear region. In contrast, the Fe XXV flux measured by Resolve is higher than that reported in the HETG nuclear spectra. This difference is likely related to the fact that the HETG analyses report unresolved line profiles, with upper limits on the FWHM that are significantly smaller than the widths measured by Resolve, so that part of the flux associated with the broadest velocity components may not be fully recovered. At the same time, there are indications that a fraction of the Fe XXV emission may arise on larger spatial scales, as suggested by the HETG data presented by Kallman et al. (2013) and more explicitly quantified by Bauer et al. (2015), who decomposed the emission into compact and extended components and found that a non-negligible fraction of the Fe XXV flux may originate outside the central ∼100 pc. While these results do not exclude a contribution from extended ionized Fe emission, possibly associated with collisionally ionized gas on larger scales, they indicate that the bulk of the ionized Fe flux arises from a more compact region and can be naturally associated with the inner outflow, in agreement with the few-parsec limits derived above.
When placed in the context of the large-scale outflow, however, these parsec-scale constraints are much smaller than those inferred for the [O III] biconical outflow, modeled with the same geometry adopted here, which yield rt = 140 pc and rmax = 461.9 pc, as obtained by fitting a biconical kinematic model to the spatially resolved radial velocity field measured with HST (Das et al. 2006). From a kinematic point of view, the optical and infrared outflows already show a stratification with ionization state. In the biconical model of Das et al. (2006), the [O III] outflow reaches maximum deprojected velocities of vmax ≃ 2000 km s−1. Using the same kinematic prescription, Marconcini et al. (2026) find that the mid-infrared [O IV] 25.9 μm emission reaches systematically higher velocities, i.e., ∼300 km s−1 faster than [O III]. The ionized Fe emission detected by XRISM/Resolve extends this trend to much more extreme velocities, with an inferred maximum outflow velocity of vmax ≃ 11 000 km s−1. These velocities exceed not only those measured in the optical and infrared, but also those of lower-ionization X-ray lines, such as S and Si, whose FWHM are approximately a factor of three narrower than those of Fe XXV and Fe XXVI (see Sect. 3.2). Other soft X-ray emission lines observed with Chandra/HETG show velocity widths comparable to those of the Si and S lines and are spatially extended along the ionization cones (Kallman et al. 2013). Together, these measurements show that a kinematic stratification is already present within the X-ray band, with progressively higher velocities associated with higher-ionization states. The continuity of this trend from the optical and infrared to the hard X-rays is consistent with a spatially and kinematically stratified outflow across all wavebands.
An additional piece of evidence pointing toward a more complex circumnuclear environment is provided by the neutral Fe Kα line, whose broad component exhibits a velocity width comparable to that of the ionized Fe emission. If confirmed, this would suggest that at least a fraction of the Fe Kα-emitting material participates in the same dynamical environment as the highly ionized gas, for instance in the form of cold clumps embedded in the flow or fluorescence occurring in a compact, kinematically active region close to the nucleus. In any case, the interpretation of the Fe Kα profile requires further dedicated analysis, as part of the observed broadening may be due to the blending of emission from mildly ionized iron species (e.g., Kallman et al. 2004; Bianchi et al. 2005b).
4.2.3. Energetics and feedback implications
The discovery with XRISM/Resolve of a fast ionized outflow component allows us to derive order-of-magnitude estimates of its mass, momentum, and kinetic power by applying the standard scaling relations commonly used for AGN winds, which relate the outflow energetics to its characteristic velocity, column density, and radius (e.g., Krongold et al. 2007). Adopting the values inferred in (2) and (3), μH ≃ 1.4 as the mean atomic weight per hydrogen atom (as appropriate for solar abundances in Anders & Grevesse 1989), and v = 5500 km s−1 (the observed FWHM is ∼5600 km s−1 and the luminosity-weighted average velocity of our bipolar outflow model is vmax/2 ≃ 5500 km s−1; see Sects. 3.2 and 4.2.1), we obtain
 (4)
(4)
 (5)
(5)
These estimates are subject to substantial systematic uncertainties, as they rely on simplifying assumptions on the geometry, ionization structure, and emissivity of the gas (Sect. 4.2.2), and in particular on the use of a single characteristic radius, column density, and velocity to describe a likely stratified outflow. The resulting kinetic power corresponds to a fraction of the bolometric luminosity of order Ėk/Lbol ≃ 20%. Even adopting Lbol = LEdd as a conservative upper bound, the coupling would remain at the ∼10% level. These values are well above the typical thresholds of a few percent often invoked for AGN-driven feedback to be energetically significant (e.g., Di Matteo et al. 2005; Hopkins & Elvis 2010), indicating that this fast ionized component could play an important role in the coupling between the nuclear outflow and the surrounding medium. Although the spatial extent of the Fe-emitting gas is not directly resolved, it must originate outside the innermost obscured regions and is therefore likely distributed on subparsec scales to scales of a few parsecs. For characteristic radii of this order and velocities of several thousand km s−1, the implied dynamical timescales are of order tdyn ∼ R/v ∼ 10 − 103 yr. Even allowing for substantial uncertainties in both geometry and energetics, such timescales suggest that the outflow need not be a purely transient phenomenon, and could lead to significant cumulative energy deposition in the circumnuclear environment. In this context, it is worth noting that NGC 1068 is believed to be accreting at a substantial fraction of its Eddington rate (Lbol/LEdd ∼ 0.5; Padovani et al. 2024), a regime in which powerful winds are expected (e.g., King & Pounds 2015), so the presence of a particularly powerful and efficient outflow in this source may not be unexpected.
To date, XRISM has revealed resolved broad ionized Fe emission in two other AGN, NGC 7213 and M81*. In NGC 7213, the Fe XXV and Fe XXVI emission lines are detected with FWHM ≃ 3000 − 5000 km s−1, plausibly associated with an inner wind or dynamically hot plasma close to the nucleus (Kammoun et al. 2025; Murakami et al., in prep.). Similarly, M81* shows broadened Fe XXV–Fe XXVI emission with velocity widths of ∼2000 − 3000 km s−1, together with centroid redshifts indicative of complex inner kinematics (Miller et al. 2025). Fast Fe–K emission has also been reported with Chandra in the Compton-thick Seyfert 2 galaxy Mrk 34, where Maksym et al. (2023) detect extended Fe XXV–Fe XXVI emission associated with high-velocity (≳1.5 × 10⁴ km s−1) gas on large spatial scales. With the addition of NGC 1068, a coherent picture emerges in which broad ionized iron lines appear to be a common feature in nearby AGN spanning orders of magnitude in accretion rate, when observed at sufficient spectral resolution, tracing a previously underappreciated highly ionized wind component that may contribute significantly to AGN feedback.
4.2.4. Alternative scenarios
The observed broadening of the ionized Fe lines does not necessarily require bulk outflow motions, as comparable velocity widths can arise from Keplerian motions in the broad-line region (BLR), as observed for optical permitted lines in type 1 AGN. In obscured sources, however, the BLR is not directly visible, but is detected only in polarized light, indicating that the direct view of the inner BLR is fully blocked and that the broad lines are observed after scattering away from the equatorial plane (Antonucci & Miller 1985). In NGC 1068, these spectropolarimetric observations provided the foundational evidence for the AGN Unification Model (Miller et al. 1991; Antonucci et al. 1994), which explains the observed dichotomy between type 1 and type 2 Seyfert galaxies (Antonucci 1993; Urry & Padovani 1995; Netzer 2015). The hidden BLR in NGC 1068 exhibits broad permitted lines with observed FWHM of about 3000 − 3500 km s−1 in polarized light (Antonucci & Miller 1985; Miller et al. 1991), comparable in order of magnitude to the velocity widths measured for the ionized Fe lines with XRISM.
We therefore adopt the same optical broad-line model, consisting of an optically thick equatorial torus and a static polar reflector (the UM mirror), observed at high inclination (Miller et al. 1991; Ogle et al. 2003). We assume that broad Fe XXV and Fe XXVI lines with a FWHM of ∼5600 km s−1 are emitted from the inner BLR, which is fully obscured by the torus. We then simulate X-ray radiative transfer through this 3D geometry using the SKIRT code (Vander Meulen et al. 2023), which self-consistently treats photo-absorption, fluorescence, and scattering.
The SKIRT radiative transfer results are shown in Fig. 6, demonstrating that the scattered Fe XXV and Fe XXVI emission lines would be shifted by ∼80 eV relative to their intrinsic line energies. In the X-ray regime, electron scattering is inelastic because of Compton recoil: photons lose energy upon scattering by an amount that roughly scales as E2/mec2 and depends on the scattering angle, making the effect substantial at Fe-K energies but negligible in the optical regime. The total energy shift depends on the number of scatterings (and therefore on the optical depth of the UM mirror), but even a single scattering produces shifts of 75 eV and 77 eV for Fe XXV and Fe XXVI, respectively. The XRISM Resolve spectrum rules out an energy shift > 15 eV, conservatively derived from the outflow model (the phenomenological fit yields a shift consistent with zero), rejecting the hypothesis that the broad X-ray lines appear through scattering away from the equatorial plane.
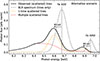 |
Fig. 6. Radiative transfer results for the scattering (UM mirror) scenario. The scattered Fe XXV and Fe XXVI lines are shifted by ∼80 eV due to inelastic Compton scattering, inconsistent with the observed line shift (ΔE < 15 eV, consistent with zero). |
A remaining possibility is that the broad ionized Fe lines arise from Keplerian motions in the inner BLR, and that we are observing this component directly through patchy obscuration. In this scenario, the equatorial absorber would remain optically thick at optical wavelengths, fully hiding the classical BLR, but could be partially transparent in hard X-rays, allowing a direct view of the rotating X-ray emitting region. To test this hypothesis, we convolved the same photoionized emission tables (Cloudy/XSTAR) adopted for the outflow with a blurring kernel (rdblur in XSPEC), representing emission from a rotating disk. This model provides a fit statistically comparable to that of the bipolar outflow scenario (C = 138/136), with an inner radius Rin = 150 ± 70 rg and inclination i = 15 ± 1°, while the outer radius (5000 rg) and emissivity index (q = −2) were kept fixed.
Although this demonstrates that Keplerian rotation at BLR-like radii can phenomenologically reproduce the observed line width, it implies a low inclination that is difficult to reconcile with the independently inferred, nearly edge-on geometry of NGC 1068 (e.g., Das et al. 2006; Greenhill et al. 1996; Raban et al. 2009). More importantly, a direct view of such a compact, rotationally broadened component would be expected to produce detectable variability in the X-ray continuum and/or in the ionized Fe line emission on timescales much shorter than those already probed by past observations. The remarkable stability of the X-ray spectrum and Fe K emission over more than two decades (e.g., Bauer et al. 2015; Marinucci et al. 2016) therefore disfavors a dominant contribution from a directly observed, rapidly varying BLR component. Future XRISM observations will further test this possibility by searching for variability in the ionized Fe line fluxes and profiles.
A purely collisional ionization equilibrium scenario was also explored by fitting the ionized iron emission with an APEC model. This model provides a statistically comparable description of the data to the outflow interpretation, with C = 134 for 135 d.o.f. The best-fit temperature is kT = 6.1 ± 0.4 keV, and an emission measure EM = (5.4 ± 0.6)×1063 cm−3. The fit still requires substantial line broadening, with a Gaussian velocity dispersion of σv = 2100 ± 200 km s−1. This is much larger than the thermal Doppler broadening expected for iron ions at this temperature, for which σvth ≃ 100 km s−1.
Producing and sustaining such velocities in a hot, collisionally ionized plasma would most naturally require strong shocks or large-scale dynamical motions. In practice, shocks capable of accelerating gas to these velocities would imply a rapidly expanding or flowing medium, effectively reintroducing an outflow scenario (e.g., Veilleux et al. 2005; King & Pounds 2015). Similarly, invoking turbulence at this level would require extreme and sustained energy injection, with velocity dispersions comparable to the sound speed of a kT ≃ 6.1 keV plasma. The emission measure implied by the APEC fit requires a substantial amount of hot gas, which for any reasonable characteristic size corresponds to a high thermal pressure. Combined with the bolometric thermal luminosity of the best-fit model, Lth, bol ≃ 1.3 × 1041 erg s−1, this implies that such a plasma would need to be continuously powered and would otherwise evolve on a short dynamical timescale (tdyn ∼ R/cs ≈ 8 × 10² (R/pc) yr for kT ≃ 6.1 keV). While these considerations do not rule out this interpretation, and the AGN could in principle supply the required power, they indicate that a purely collisional origin does not naturally account for the combination of high ionization and large velocity widths, and therefore does not appear favored compared to interpretations invoking a dynamically active inner outflow.
We note, however, that strong shocks and highly turbulent gas are indeed observed in NGC 1068 on larger scales. Integral-field optical spectroscopy reveals very broad emission-line profiles in regions perpendicular to the ionization cones and radio jet, interpreted as shock-heated, turbulent gas produced by jet–ISM interaction (Venturi et al. 2021). In the same work, the Chandra spectrum extracted from these extended, shock-dominated regions shows tentative evidence of ionized Fe emission. To further test this possibility, we fitted the XRISM spectrum with a non-equilibrium ionization shock model (bpshock). The fit converges toward parameters consistent with collisional ionization equilibrium, with an upper ionization timescale parameter τu ∼ 5 × 10¹³ s cm−3, indicating that no significant non-equilibrium effects are required by the data. However, the XRISM spectrum integrates over a much larger region and is dominated by the bright nuclear component; any extended shock contribution would therefore be substantially diluted in the total spectrum.
5. Conclusions
In this paper we presented the first high-resolution X-ray microcalorimeter view of the iron-K emission in the prototypical Compton-thick Seyfert galaxy NGC 1068, obtained with XRISM/Resolve. Exploiting the unprecedented spectral resolution across the Fe K band, we derived direct constraints on the ionization state, kinematics, and physical origin of the neutral and ionized iron emission. Our main results can be summarized as follows:
-
The centroid energies of the Fe K lines and the Fe Kβ/Kα flux ratio indicate that the fluorescent emission arises from genuinely neutral material and, together with the upper limit on the Compton shoulder (≲8−11% of the core flux), is dominated by optically thin or only mildly Compton-thick gas. This result is unexpected for a source long regarded as a prototypical Compton-thick AGN, although it is consistent with past evidence of significant clumpiness of the putative torus. The intrinsic width of the Fe Kα core (σ ≃ 155 km s−1) implies characteristic emission radii of order ∼1 pc, comparable to the directly resolved dusty structures, but likely distinct from the material responsible for the line-of-sight obscuration.
-
The Fe XXV and Fe XXVI emission lines are found to be remarkably broad, with Gaussian velocity dispersions of σ = 2400 ± 200 km s−1. Their smooth, symmetric profiles are well reproduced by a biconical outflow model previously developed to explain the [O III] and [O IV] emission, with the Fe XXV–Fe XXVI lines tracing a more highly ionized, much faster, and spatially more confined inner phase of the same large-scale bipolar outflow. The neutral Fe Kα profile also shows a broader base with a velocity width comparable to that of the ionized lines, possibly consistent with emission from cold clumps embedded in a multi-phase outflow.
-
Adopting fiducial parameters for the fast ionized phase (FWHM ≃ 5600 km s−1, CfNH ≃ 5 × 1021 cm−2, and a characteristic radius of a few parsecs), the inferred mass outflow rate is of order ∼10 M⊙ yr−1, while the associated kinetic power reaches ∼10−20% of the AGN bolometric luminosity, although these values are highly uncertain and may be overestimated due to the simplified treatment of the outflow structure and emissivity. This suggests that the inner, highly ionized outflow phase traced by the iron lines is energetically capable of providing significant AGN-driven feedback.
Overall, these results provide a revised view of the circumnuclear environment of NGC 1068, in which a clumpy and stratified cold reprocessor coexists with a fast, highly ionized inner outflow that carries a substantial fraction of the accretion power. Together with recent XRISM observations of other nearby AGN, this study shows that high-resolution X-ray spectroscopy is revealing a complex and structured picture of the innermost regions, in which multiple reprocessing and outflowing components with distinct ionization and kinematic properties coexist. Future XRISM observations will allow this emerging framework to be tested on a broader sample, while next-generation missions such as NewAthena will eventually extend these studies to higher-redshift and lower-luminosity regimes.
Acknowledgments
We thank S.B. Kraemer, A. Laor and M. Tsujimoto for useful discussions. ChatGPT (OpenAI) was used for language editing and code debugging during the preparation of this manuscript. All scientific content, analysis, and conclusions were independently developed and verified by the authors. SB and CP acknowledge funding from PRIN MUR 2022 SEAWIND 2022Y2T94C, supported by European Union-Next Generation EU, Mission 4, Component 1, CUP C53D23001330006. BV acknowledges support through the European Space Agency (ESA) Research Fellowship Programme in Space Science. P.O.P. acknowledges financial support from the CNRS “Action Thématique Phenomenes Extremes et Multimessangers” (ATPEM) as well as from the French spatial agency CNES. VEG acknowledges funding under NASA contract 80NSSC24K1403. RS acknowledges funding from the CAS-ANID grant number CAS220016. GM acknowledges support from grant n. PID2023-147338NB-C21 funded by Spanish MICIU/AEI/10.13039/501100011033 and ERDF/EU. KI acknowledges support under the grant PID2022-136828NB-C44 provided by MCIN/AEI/10.13039/501100011033/FEDER, UE. FN acknowledges support from the INAF-AF large grant X2X, ID 1.05.23.01.05 as well as the PRIN MUR 2022 DRAGON, ID 2022K9N5B4. GP acknowledges financial support from the European Research Council (ERC) under the European Union’s Horizon 2020 research and innovation program HotMilk (grant agreement No. 865637) and from the Framework per l’Attrazione e il Rafforzamento delle Eccellenze (FARE) per la ricerca in Italia (R20L5S39T9).
References
- Anders, E., & Grevesse, N. 1989, Geochim. Cosmochim. Acta, 53, 197 [Google Scholar]
- Andonie, C., Bauer, F. E., Carraro, R., et al. 2022, A&A, 664, A46 [NASA ADS] [CrossRef] [EDP Sciences] [Google Scholar]
- Antonucci, R. 1993, ARA&A, 31, 473 [Google Scholar]
- Antonucci, R. R. J., & Miller, J. S. 1985, ApJ, 297, 621 [NASA ADS] [CrossRef] [Google Scholar]
- Antonucci, R., Hurt, T., & Miller, J. 1994, ApJ, 430, 210 [NASA ADS] [CrossRef] [Google Scholar]
- Arnaud, K. A. 1996, ASP Conf. Ser., 101, 17 [Google Scholar]
- Barvainis, R. 1987, ApJ, 320, 537 [Google Scholar]
- Basko, M. M. 1978, ApJ, 223, 268 [Google Scholar]
- Bauer, F. E., Arévalo, P., Walton, D. J., et al. 2015, ApJ, 812, 116 [Google Scholar]
- Bearden, J. A. 1967, Rev. Mod. Phys., 39, 78 [Google Scholar]
- Bianchi, S., Matt, G., Nicastro, F., Porquet, D., & Dubau, J. 2005a, MNRAS, 357, 599 [Google Scholar]
- Bianchi, S., Miniutti, G., Fabian, A. C., & Iwasawa, K. 2005b, MNRAS, 360, 380 [Google Scholar]
- Bianchi, S., Guainazzi, M., & Chiaberge, M. 2006, A&A, 448, 499 [NASA ADS] [CrossRef] [EDP Sciences] [Google Scholar]
- Bianchi, S., Maiolino, R., & Risaliti, G. 2012, Adv. Astron., 2012, 782030 [CrossRef] [Google Scholar]
- Bianchi, S., Guainazzi, M., Laor, A., Stern, J., & Behar, E. 2019, MNRAS, 485, 416 [NASA ADS] [CrossRef] [Google Scholar]
- Biggs, F., Mendelsohn, L. B., & Mann, J. B. 1975, At. Data Nucl. Data Tables, 16, 201 [CrossRef] [Google Scholar]
- Bottinelli, L., Gouguenheim, L., Fouque, P., & Paturel, G. 1990, A&AS, 82, 391 [Google Scholar]
- Camps, P., & Baes, M. 2015, Astron. Comput., 9, 20 [Google Scholar]
- Camps, P., & Baes, M. 2020, Astron. Comput., 31, 100381 [NASA ADS] [CrossRef] [Google Scholar]
- Cash, W. 1979, ApJ, 228, 939 [Google Scholar]
- Crenshaw, D. M., & Kraemer, S. B. 2000, ApJ, 532, 247 [Google Scholar]
- Crenshaw, D. M., Schmitt, H. R., Kraemer, S. B., Mushotzky, R. F., & Dunn, J. P. 2010, ApJ, 708, 419 [Google Scholar]
- Das, V., Crenshaw, D. M., Hutchings, J. B., et al. 2005, AJ, 130, 945 [NASA ADS] [CrossRef] [Google Scholar]
- Das, V., Crenshaw, D. M., Kraemer, S. B., & Deo, R. P. 2006, AJ, 132, 620 [Google Scholar]
- Di Matteo, T., Springel, V., & Hernquist, L. 2005, Nature, 433, 604 [NASA ADS] [CrossRef] [Google Scholar]
- Diamant, R., Sharon, R., Caliebe, W. A., Kao, C.-C., & Deutsch, M. 2006, J. Phys. B At. Mol. Phys., 39, 651 [Google Scholar]
- García-Burillo, S., Combes, F., Ramos Almeida, C., et al. 2016, ApJ, 823, L12 [Google Scholar]
- García-Burillo, S., Combes, F., Ramos Almeida, C., et al. 2019, A&A, 632, A61 [Google Scholar]
- Grafton-Waters, S., Branduardi-Raymont, G., Mehdipour, M., et al. 2021, A&A, 649, A162 [NASA ADS] [CrossRef] [EDP Sciences] [Google Scholar]
- GRAVITY Collaboration (Pfuhl, O., et al.) 2020, A&A, 634, A1 [NASA ADS] [CrossRef] [EDP Sciences] [Google Scholar]
- Greenhill, L. J., Gwinn, C. R., Antonucci, R., & Barvainis, R. 1996, ApJ, 472, L21 [Google Scholar]
- Guainazzi, M., & Bianchi, S. 2007, MNRAS, 374, 1290 [Google Scholar]
- Gunasekera, C. M., van Hoof, P. A. M., Dehghanian, M., et al. 2025a, Rev. Mexicana Astron. Astrofis., 61, 120 [Google Scholar]
- Gunasekera, C. M., van Hoof, P. A. M., Tsujimoto, M., & Ferland, G. J. 2025b, A&A, 694, L13 [NASA ADS] [CrossRef] [EDP Sciences] [Google Scholar]
- Hölzer, G., Fritsch, M., Deutsch, M., Härtwig, J., & Förster, E. 1997, Phys. Rev. A, 56, 4554 [CrossRef] [Google Scholar]
- Hopkins, P. F., & Elvis, M. 2010, MNRAS, 401, 7 [NASA ADS] [CrossRef] [Google Scholar]
- Huchra, J. P., Vogeley, M. S., & Geller, M. J. 1999, ApJS, 121, 287 [Google Scholar]
- Ishisaki, Y., Kelley, R. L., Awaki, H., et al. 2025, J. Astron. Telesc. Instrum. Syst., 11, 042023 [Google Scholar]
- Iwasawa, K., Fabian, A. C., & Matt, G. 1997, MNRAS, 289, 443 [NASA ADS] [CrossRef] [Google Scholar]
- Jaffe, W., Meisenheimer, K., Röttgering, H. J. A., et al. 2004, Nature, 429, 47 [NASA ADS] [CrossRef] [Google Scholar]
- Kaastra, J. S., & Bleeker, J. A. M. 2016, A&A, 587, A151 [NASA ADS] [CrossRef] [EDP Sciences] [Google Scholar]
- Kaastra, J. S., & Mewe, R. 1993, A&AS, 97, 443 [NASA ADS] [Google Scholar]
- Kallman, T., & Bautista, M. 2001, ApJS, 133, 221 [Google Scholar]
- Kallman, T. R., Palmeri, P., Bautista, M. A., Mendoza, C., & Krolik, J. H. 2004, ApJS, 155, 675 [Google Scholar]
- Kallman, T., Evans, D. A., Marshall, H., et al. 2013, ApJ, 780, 121 [Google Scholar]
- Kammoun, E., Kawamuro, T., Murakami, K., et al. 2025, ApJ, 994, L13 [Google Scholar]
- Kelley, R. L., Ishisaki, Y., Costantini, E., et al. 2025, J. Astron. Telesc. Instrum. Syst., 11, 042026 [Google Scholar]
- King, A., & Pounds, K. 2015, ARA&A, 53, 115 [NASA ADS] [CrossRef] [Google Scholar]
- Kinkhabwala, A., Sako, M., Behar, E., et al. 2002, ApJ, 575, 732 [Google Scholar]
- Koyama, K., Inoue, H., Tanaka, Y., et al. 1989, PASJ, 41, 731 [NASA ADS] [Google Scholar]
- Kramida, A., Ralchenko, Yu., Reader, J., & NIST ASD Team 2024, NIST Atomic Spectra Database (ver. 5.12), [Online]. Available: https://www.nist.gov/pml/atomic-spectra-database [2026, January 12]. National Institute of Standards and Technology, Gaithersburg, MD [Google Scholar]
- Krongold, Y., Nicastro, F., Elvis, M., et al. 2007, ApJ, 659, 1022 [NASA ADS] [CrossRef] [Google Scholar]
- Liu, J. 2016, MNRAS, 463, L108 [NASA ADS] [CrossRef] [Google Scholar]
- López-Gonzaga, N., & Jaffe, W. 2016, A&A, 591, A128 [NASA ADS] [CrossRef] [EDP Sciences] [Google Scholar]
- López-Gonzaga, N., Jaffe, W., Burtscher, L., Tristram, K. R. W., & Meisenheimer, K. 2014, A&A, 565, A71 [NASA ADS] [CrossRef] [EDP Sciences] [Google Scholar]
- Maksym, W. P., Elvis, M., Fabbiano, G., et al. 2023, ApJ, 951, 146 [NASA ADS] [CrossRef] [Google Scholar]
- Marconcini, C., Marconi, A., Ceci, M., et al. 2026, A&A, in press, https://doi.org/10.1051/0004-6361/202558543 [Google Scholar]
- Marin, F., Marinucci, A., Laurenti, M., et al. 2024, A&A, 689, A238 [NASA ADS] [CrossRef] [EDP Sciences] [Google Scholar]
- Marinucci, A., Bianchi, S., Matt, G., et al. 2016, MNRAS, 456, L94 [Google Scholar]
- Markham, M., Bentz, M. C., Ferrarese, L., Onken, C. A., & Vestergaard, M. 2026, ApJ, 1000, 78 [Google Scholar]
- Matt, G. 2002, MNRAS, 337, 147 [Google Scholar]
- Matt, G., Brandt, W. N., & Fabian, A. C. 1996, MNRAS, 280, 823 [NASA ADS] [CrossRef] [Google Scholar]
- Matt, G., Fabian, A. C., Guainazzi, M., et al. 2000, MNRAS, 318, 173 [NASA ADS] [CrossRef] [Google Scholar]
- Matt, G., Bianchi, S., Guainazzi, M., & Molendi, S. 2004, A&A, 414, 155 [NASA ADS] [CrossRef] [EDP Sciences] [Google Scholar]
- Mehdipour, M., Kaastra, J. S., & Kallman, T. 2016, A&A, 596, A65 [NASA ADS] [CrossRef] [EDP Sciences] [Google Scholar]
- Miller, J. S., Goodrich, R. W., & Mathews, W. G. 1991, ApJ, 378, 47 [NASA ADS] [CrossRef] [Google Scholar]
- Miller, J. M., Behar, E., Awaki, H., et al. 2025, ApJ, 985, L41 [Google Scholar]
- Mochizuki, Y., Tsujimoto, M., Leutenegger, M. A., et al. 2025, PASJ, 77, S63 [Google Scholar]
- Molendi, S., Bianchi, S., & Matt, G. 2003, MNRAS, 343, L1 [Google Scholar]
- Nagai, Y., Enoto, T., Tsujimoto, M., et al. 2026, arXiv e-prints [arXiv:2601.17792] [Google Scholar]
- Nenkova, M., Sirocky, M. M., Nikutta, R., Ivezić, Ž., & Elitzur, M. 2008, ApJ, 685, 160 [Google Scholar]
- Netzer, H. 2015, ARA&A, 53, 365 [Google Scholar]
- Noda, H., Mori, K., Tomida, H., et al. 2025, PASJ, 77, S10 [Google Scholar]
- Ogle, P. M., Brookings, T., Canizares, C. R., Lee, J. C., & Marshall, H. L. 2003, A&A, 402, 849 [NASA ADS] [CrossRef] [EDP Sciences] [Google Scholar]
- Padovani, P., Resconi, E., Ajello, M., et al. 2024, Nat. Astron., 8, 1077 [Google Scholar]
- Palmeri, P., Mendoza, C., Kallman, T. R., Bautista, M. A., & Meléndez, M. 2003, A&A, 410, 359 [NASA ADS] [CrossRef] [EDP Sciences] [Google Scholar]
- Panda, S. 2022, Front. Astron. Space Sci., 9, 850409 [NASA ADS] [CrossRef] [Google Scholar]
- Porter, F. S., Kilbourne, C. A., Chiao, M., et al. 2025, J. Astron. Telesc. Instrum. Syst., 11, 042016 [Google Scholar]
- Raban, D., Jaffe, W., Röttgering, H., Meisenheimer, K., & Tristram, K. R. W. 2009, MNRAS, 394, 1325 [Google Scholar]
- Ramos Almeida, C., & Ricci, C. 2017, Nat. Astron., 1, 679 [Google Scholar]
- Shigeoka, N., Oohashi, H., Ito, Y., et al. 2004, J. Phys. B At. Mol. Phys., 37, 2303 [Google Scholar]
- Stern, J., Laor, A., & Baskin, A. 2014, MNRAS, 438, 901 [NASA ADS] [CrossRef] [Google Scholar]
- Sunyaev, R. A., & Churazov, E. M. 1996, Astron. Lett., 22, 648 [NASA ADS] [Google Scholar]
- Tashiro, M., Kelley, R., Watanabe, S., et al. 2025, PASJ, 77, S1 [Google Scholar]
- The XRISM Collaboration 2026, Nat. Astron., https://doi.org/10.1038/s41550-026-02817-6 [Google Scholar]
- Ueno, S., Mushotzky, R. F., Koyama, K., et al. 1994, PASJ, 46, L71 [NASA ADS] [Google Scholar]
- Urry, C. M., & Padovani, P. 1995, PASP, 107, 803 [NASA ADS] [CrossRef] [Google Scholar]
- Vander Meulen, B., Camps, P., Stalevski, M., & Baes, M. 2023, A&A, 674, A123 [NASA ADS] [CrossRef] [EDP Sciences] [Google Scholar]
- Veilleux, S., Cecil, G., & Bland-Hawthorn, J. 2005, ARA&A, 43, 769 [NASA ADS] [CrossRef] [Google Scholar]
- Venturi, G., Cresci, G., Marconi, A., et al. 2021, A&A, 648, A17 [NASA ADS] [CrossRef] [EDP Sciences] [Google Scholar]
- Vermot, P., Clénet, Y., Gratadour, D., et al. 2021, A&A, 652, A65 [NASA ADS] [CrossRef] [EDP Sciences] [Google Scholar]
- Verner, D. A., Ferland, G. J., Korista, K. T., & Yakovlev, D. G. 1996, ApJ, 465, 487 [Google Scholar]
- Yaqoob, T., & Murphy, K. D. 2011a, MNRAS, 412, 1765 [Google Scholar]
- Yaqoob, T., & Murphy, K. D. 2011b, MNRAS, 412, 277 [Google Scholar]
- Yaqoob, T., George, I. M., Nandra, K., et al. 2001, ApJ, 546, 759 [Google Scholar]
- Young, A. J., Wilson, A. S., & Shopbell, P. L. 2001, ApJ, 556, 6 [Google Scholar]
- Zaino, A., Bianchi, S., Marinucci, A., et al. 2020, MNRAS, 492, 3872 [Google Scholar]
We fix Γ = 1 as a convenient approximation to the locally flat shape of a pure reflection spectrum. We note that the choice of the photon index does not affect the results on the line parameters in such a restricted energy range.
All velocity shifts quoted in this work are measured relative to the systemic redshift adopted above, which is based on H I 21 cm measurements tracing the large-scale kinematics of the host galaxy.
In SKIRT, the bound-electron momentum distribution is based on Compton profiles from Biggs et al. (1975), introducing an effective dispersion comparable to scattering on a 10-eV free-electron plasma (Sunyaev & Churazov 1996; The XRISM Collaboration 2026).
This ratio is strictly valid only in the optically thin limit; the column density inferred in Sect. 4.2.2 is consistent with this regime, supporting the validity of this assumption (e.g., Gunasekera et al. 2025b).
Satellite lines are likely to contribute significantly (see, e.g., Bianchi et al. 2005a; Mochizuki et al. 2025), but it is impossible to disentangle them in a blended broad feature in the current data.
Accounting for contamination from the blue wing of Fe XXVI reduces the Fe Kβ flux by ∼15% (Sect. 3.1), hence the Fe Kβ/Kα ratio, slightly increasing the tension with the neutral optically thin expectation.
In the context of this work, we implemented the Hubble flow vector field in SKIRT; see https://skirt.ugent.be/skirt9/class_hubble_radial_vector_field.html
All Tables
Measured parameters of the main emission lines in the XRISM/Resolve spectrum of NGC 1068.
All Figures
|
Fig. 1. XRISM/Resolve spectrum of NGC 1068 showing only emission lines detected at ≥99% confidence in the blind line scan (Sect. 3). For clarity, the detected lines are displayed in two separate energy bands, which encompass all features meeting the detection criterion. Vertical dashed lines mark the centroid energies of the detected features, which are labeled in the figure (see Table 1). |
| In the text | |
|
Fig. 2. Local fits to the neutral fluorescence lines in the XRISM/Resolve spectrum of NGC 1068. Top: Fe Kα complex (6.0−6.5 keV, rest frame). The black points show the data and the black histogram is the best-fitting model, consisting of a narrow core (red) and a broad base (blue; see text) added to the baseline continuum (gray). The magenta dashed curves show bound electron-scattering Compton-shoulder profiles with fluxes of 10 and 20% of the core. Bottom left: Fe Kβ band. Bottom right: Ni Kα band. The vertical dotted lines mark the nominal centroid energies of the neutral transitions. |
| In the text | |
|
Fig. 3. XRISM/Resolve spectrum of NGC 1068 with the broad Fe XXV Heα and Fe XXVI Lyα emission lines. The spectrum is shown in the rest frame and is fitted with the outflow model described in Sect. 4.2.1. The model components for the Fe XXV and Fe XXVI lines are shown in blue; the total model is shown in black. The neutral Fe Kβ line, shown in red, is also included in the fit. The vertical dotted lines mark the laboratory energies of the main transitions. |
| In the text | |
|
Fig. 4. Upper panel: Velocity shifts of the Fe Kβ centroid energy relative to the neutral reference of Hölzer et al. (1997), shown as a function of ionization stage. Blue diamonds show the shifts predicted by the atomic calculations of Palmeri et al. (2003), while the gray horizontal band indicates the value measured in the XRISM/Resolve spectrum (±1σ). The green square and red triangle mark the experimental neutral Fe Kβ centroid energies from Hölzer et al. (1997) and Bearden (1967), respectively. The measured centroid is consistent with neutral iron and rules out, within the statistical uncertainties, ionization stages higher than Fe V. Lower panel: Fe Kβ/Kα ratio as a function of ionization stage. The black circles show the values predicted by Kaastra & Mewe (1993), while the light blue shaded region indicates the envelope spanned by the theoretical calculations of Palmeri et al. (2003). The green square marks the experimental neutral Fe Kβ/Kα ratio from Hölzer et al. (1997), and the horizontal band indicates the ratio measured in the XRISM/Resolve spectrum (±1σ). The observed ratio is consistent, within the uncertainties, with the theoretical expectation for neutral Fe in the optically thin limit, although marginally lower than the nominal value. |
| In the text | |
|
Fig. 5. High-velocity bi-polar outflow model adopted to reproduce the broad Fe XXV and Fe XXVI lines observed with XRISM. The intrinsic line spectrum was calculated with XSTAR; the integrated velocity profile was calculated with the SKIRT code. |
| In the text | |
|
Fig. 6. Radiative transfer results for the scattering (UM mirror) scenario. The scattered Fe XXV and Fe XXVI lines are shifted by ∼80 eV due to inelastic Compton scattering, inconsistent with the observed line shift (ΔE < 15 eV, consistent with zero). |
| In the text | |
Current usage metrics show cumulative count of Article Views (full-text article views including HTML views, PDF and ePub downloads, according to the available data) and Abstracts Views on Vision4Press platform.
Data correspond to usage on the plateform after 2015. The current usage metrics is available 48-96 hours after online publication and is updated daily on week days.
Initial download of the metrics may take a while.