


Fig. 2.
Download original image
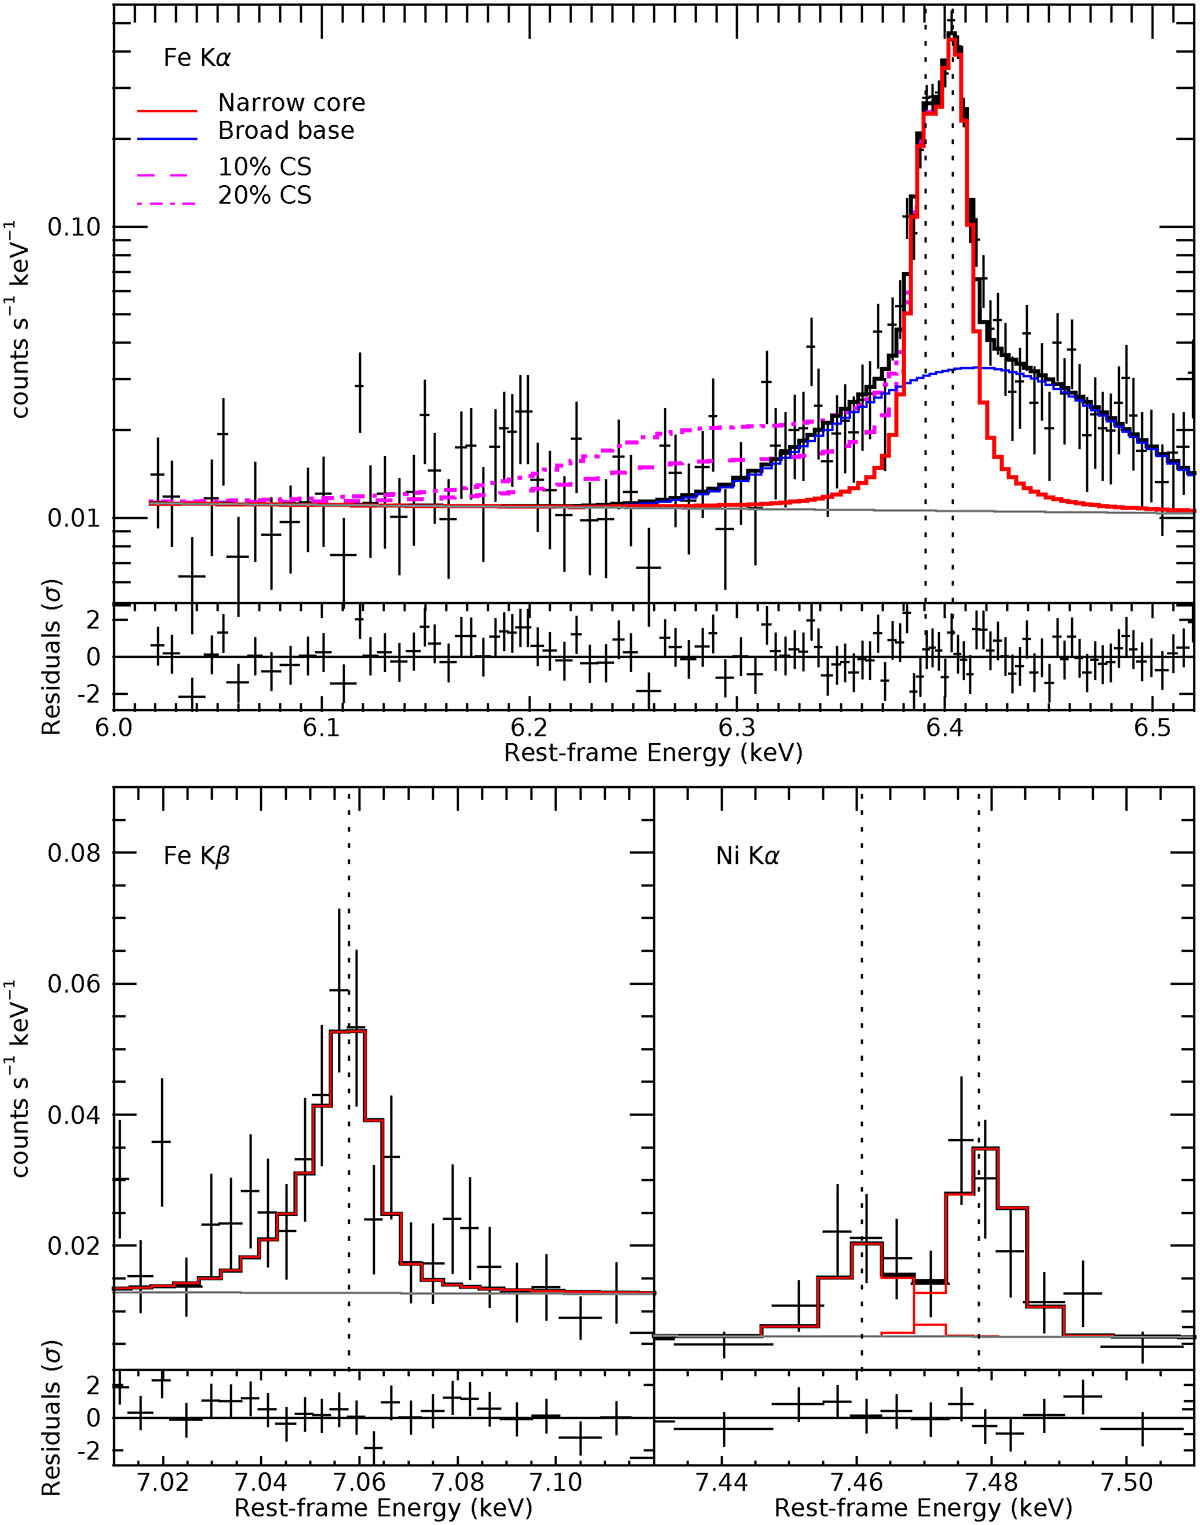
Local fits to the neutral fluorescence lines in the XRISM/Resolve spectrum of NGC 1068. Top: Fe Kα complex (6.0−6.5 keV, rest frame). The black points show the data and the black histogram is the best-fitting model, consisting of a narrow core (red) and a broad base (blue; see text) added to the baseline continuum (gray). The magenta dashed curves show bound electron-scattering Compton-shoulder profiles with fluxes of 10 and 20% of the core. Bottom left: Fe Kβ band. Bottom right: Ni Kα band. The vertical dotted lines mark the nominal centroid energies of the neutral transitions.
Current usage metrics show cumulative count of Article Views (full-text article views including HTML views, PDF and ePub downloads, according to the available data) and Abstracts Views on Vision4Press platform.
Data correspond to usage on the plateform after 2015. The current usage metrics is available 48-96 hours after online publication and is updated daily on week days.
Initial download of the metrics may take a while.