


Fig. 4.
Download original image
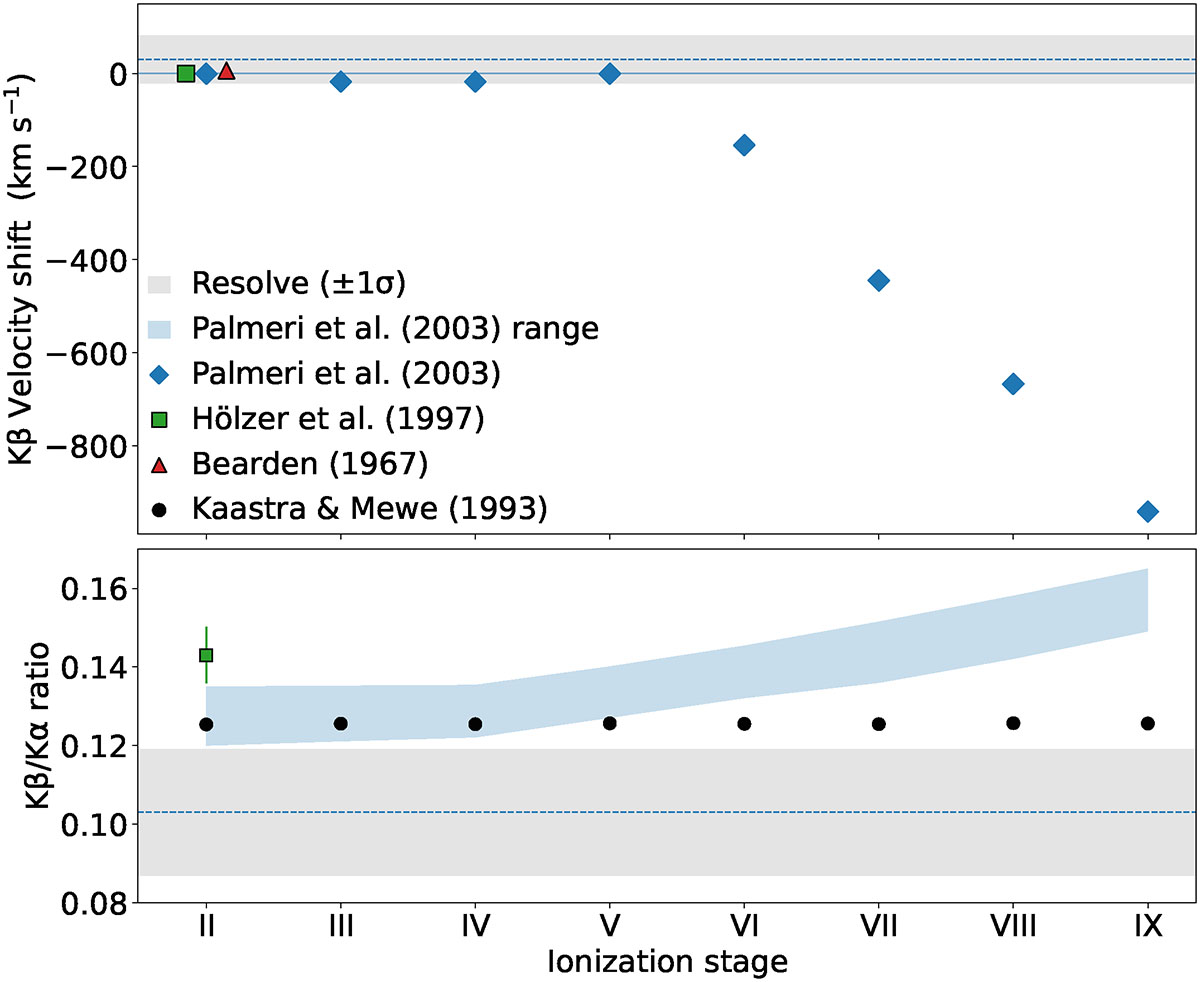
Upper panel: Velocity shifts of the Fe Kβ centroid energy relative to the neutral reference of Hölzer et al. (1997), shown as a function of ionization stage. Blue diamonds show the shifts predicted by the atomic calculations of Palmeri et al. (2003), while the gray horizontal band indicates the value measured in the XRISM/Resolve spectrum (±1σ). The green square and red triangle mark the experimental neutral Fe Kβ centroid energies from Hölzer et al. (1997) and Bearden (1967), respectively. The measured centroid is consistent with neutral iron and rules out, within the statistical uncertainties, ionization stages higher than Fe V. Lower panel: Fe Kβ/Kα ratio as a function of ionization stage. The black circles show the values predicted by Kaastra & Mewe (1993), while the light blue shaded region indicates the envelope spanned by the theoretical calculations of Palmeri et al. (2003). The green square marks the experimental neutral Fe Kβ/Kα ratio from Hölzer et al. (1997), and the horizontal band indicates the ratio measured in the XRISM/Resolve spectrum (±1σ). The observed ratio is consistent, within the uncertainties, with the theoretical expectation for neutral Fe in the optically thin limit, although marginally lower than the nominal value.
Current usage metrics show cumulative count of Article Views (full-text article views including HTML views, PDF and ePub downloads, according to the available data) and Abstracts Views on Vision4Press platform.
Data correspond to usage on the plateform after 2015. The current usage metrics is available 48-96 hours after online publication and is updated daily on week days.
Initial download of the metrics may take a while.