


Fig. 1.
Download original image
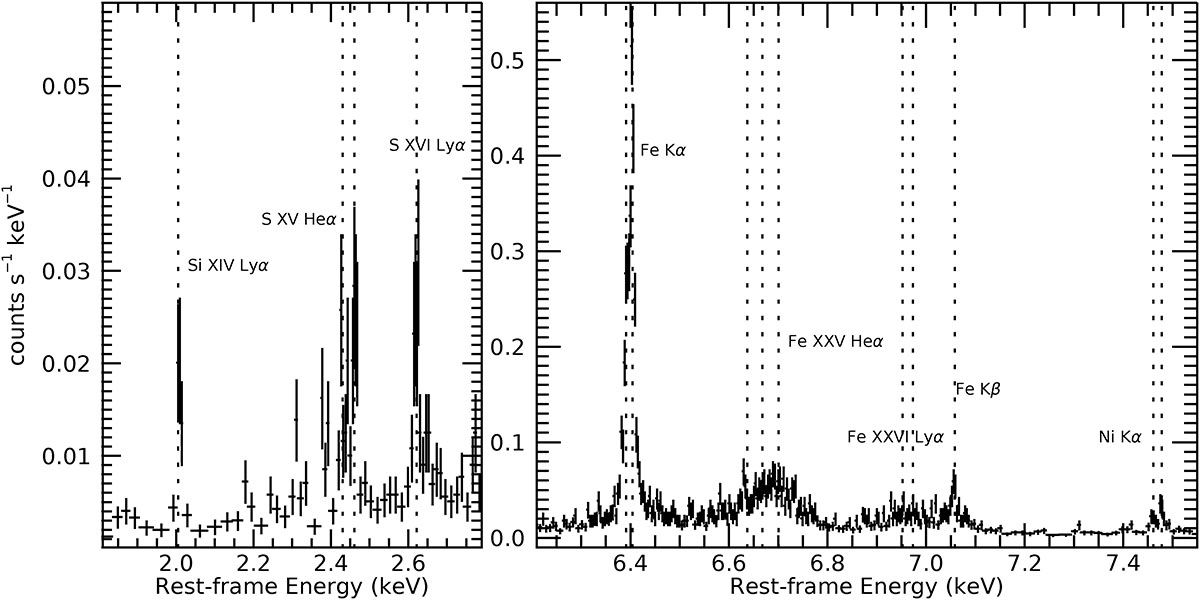
XRISM/Resolve spectrum of NGC 1068 showing only emission lines detected at ≥99% confidence in the blind line scan (Sect. 3). For clarity, the detected lines are displayed in two separate energy bands, which encompass all features meeting the detection criterion. Vertical dashed lines mark the centroid energies of the detected features, which are labeled in the figure (see Table 1).
Current usage metrics show cumulative count of Article Views (full-text article views including HTML views, PDF and ePub downloads, according to the available data) and Abstracts Views on Vision4Press platform.
Data correspond to usage on the plateform after 2015. The current usage metrics is available 48-96 hours after online publication and is updated daily on week days.
Initial download of the metrics may take a while.