


Fig. 3.
Download original image
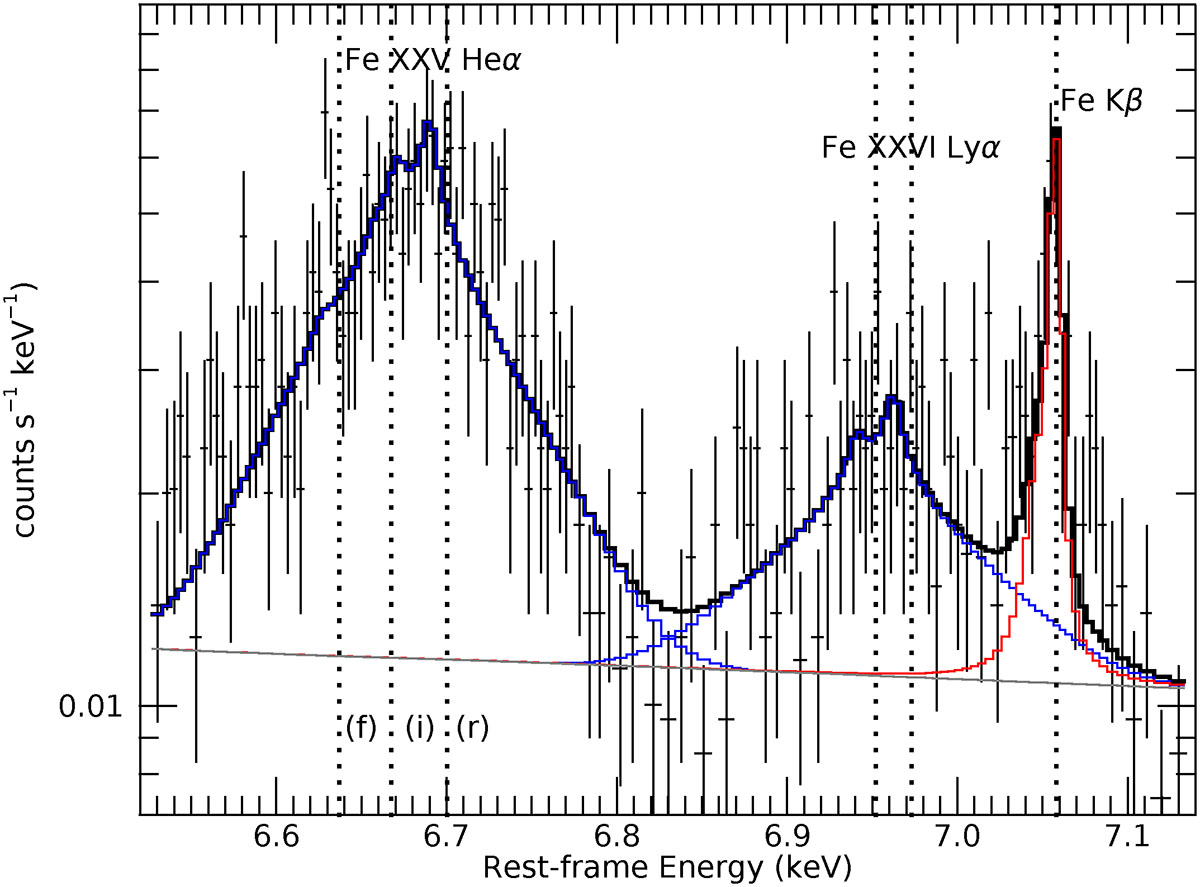
XRISM/Resolve spectrum of NGC 1068 with the broad Fe XXV Heα and Fe XXVI Lyα emission lines. The spectrum is shown in the rest frame and is fitted with the outflow model described in Sect. 4.2.1. The model components for the Fe XXV and Fe XXVI lines are shown in blue; the total model is shown in black. The neutral Fe Kβ line, shown in red, is also included in the fit. The vertical dotted lines mark the laboratory energies of the main transitions.
Current usage metrics show cumulative count of Article Views (full-text article views including HTML views, PDF and ePub downloads, according to the available data) and Abstracts Views on Vision4Press platform.
Data correspond to usage on the plateform after 2015. The current usage metrics is available 48-96 hours after online publication and is updated daily on week days.
Initial download of the metrics may take a while.