


| Issue |
A&A
Volume 709, May 2026
|
|
|---|---|---|
| Article Number | A240 | |
| Number of page(s) | 15 | |
| Section | Extragalactic astronomy | |
| DOI | https://doi.org/10.1051/0004-6361/202558441 | |
| Published online | 19 May 2026 | |
High-redshift galactic outflows: orientation effects, kinematics, and metallicity in TNG50 and SERRA
1
Scuola Normale Superiore, Piazza dei Cavalieri 7, 50126, Pisa, Italy
2
Dipartimento di Fisica “Enrico Fermi”, Universitá di Pisa, Largo Bruno Pontecorvo 3, Pisa, I-56127, Italy
★ Corresponding author: This email address is being protected from spambots. You need JavaScript enabled to view it.
Received:
6
December
2025
Accepted:
16
February
2026
Abstract
Context. Galactic outflows driven by central black holes and supernovae play a crucial role in the formation and evolution of galaxies. Recently, JWST/NIRSpec observations have provided the first detections of warm ionised outflows in low-mass (M★ ∼ 107 M⊙) galaxies at high redshifts (z > 3), revealing an occurrence rate of 25−40% depending on the intensity of the emission lines. This fraction is lower than predicted by theoretical models and simulations, which suggest that fast outflowing gas should be a common feature of all star-forming galaxies in the early Universe.
Aims. In order to better understand the discrepancies between simulations and observations, we identified and characterised outflows in high-redshift galaxies using the TNG50 cosmological and SERRA zoom-in simulations. Our study examines how outflow detectability depends on the line of sight, explores the properties of the fast gas, and investigates its relationship with key galactic properties.
Methods. We analysed approximately 6 × 10⁴ galaxies from TNG50 and 3 × 10³ galaxies from SERRA over the redshift ranges z = 3 − 5 and z = 4 − 5, respectively, spanning stellar masses of M★ = 107.5 − 1011 M⊙. Outflows in the immediate vicinity of each galaxy were identified using a Gaussian mixture model algorithm that uses the gas velocity, star formation rate, and location as input parameters. We subsequently compared the simulated outflows to those observed in the JWST/JADES NIRSpec survey.
Results. Outflow masses in both TNG50 and SERRA broadly reproduce the JWST/JADES measurements within roughly 0.5 dex, though simulations tend to predict slightly higher values, suggesting that optical emission lines capture only a fraction of the multiphase outflow. However, simulated outflow velocities are typically an order of magnitude lower than those inferred from observations. TNG50 indicates a clear orientation dependence since outflows in face-on galaxies are approximately 15 percent more likely to be detected than in edge-on systems, with this difference increasing to nearly 40 percent for more massive, disc-shaped galaxies.
Key words: galaxies: evolution / galaxies: high-redshift / galaxies: structure
© The Authors 2026
 Open Access article, published by EDP Sciences, under the terms of the Creative Commons Attribution License (https://creativecommons.org/licenses/by/4.0), which permits unrestricted use, distribution, and reproduction in any medium, provided the original work is properly cited.
This article is published in open access under the Subscribe to Open model. This email address is being protected from spambots. You need JavaScript enabled to view it. to support open access publication.
1. Introduction
Galactic outflows, primarily driven by supernova explosions and radiation feedback from active galactic nuclei (AGNs), are expected to play a crucial role in regulating star formation and shaping the long-term evolution of galaxies (e.g. Debuhr et al. 2012; Li et al. 2017; Nelson et al. 2019; Mitchell et al. 2020; Pandya et al. 2021). The general consensus is that the primary impact of outflows is the removal of gas from the galactic interior, leading to the depletion of the star-forming reservoir. In massive galaxies, only the fastest outflows can escape the deep gravitational potential, while most of the gas eventually falls back and is recycled into subsequent star formation. In contrast, lower-mass galaxies, with shallower potential wells, can lose a significant fraction of their gas, often resulting in the early quenching of star formation (e.g. Tremonti et al. 2004; Christensen et al. 2016). Yet, despite significant progress, the role of outflows in shaping their host galaxies remains highly uncertain and debated.
Spectroscopic observations typically identify galactic outflows through broad components in the emission lines of a galaxy’s spectrum. Such broad components indicate the presence of fast-moving gas with velocities exceeding the circular velocity of the disc, suggesting that it may be able to escape into the intergalactic medium. Several works have mainly studied the profile of the rest-frame optical line of Hα and [OIII] that maps the ionised gas with a temperature of 104 − 5 K (e.g. Arribas et al. 2014; Förster Schreiber et al. 2014; Harrison et al. 2016; Cicone et al. 2016; Concas et al. 2017; Rakshit & Woo 2018; Perna et al. 2017; Leung et al. 2019; Förster Schreiber et al. 2019; Davies et al. 2019; Kakkad et al. 2020; Reichardt Chu et al. 2022; Concas et al. 2022; Llerena et al. 2023; Rodríguez Del Pino et al. 2024; Venturi et al. 2025; Perna et al. 2025; Zamora et al. 2025; Bertola et al. 2025; Rodríguez Del Pino et al. 2026). In recent years, spectroscopic studies have detected outflows in high-mass galaxies (M★ > 1010 M⊙) with an incidence rate exceeding 30% at redshifts z = 0 − 3 (e.g. Carniani et al. 2015; Cicone et al. 2016; Concas et al. 2017; Rakshit & Woo 2018; Förster Schreiber et al. 2019; Venturi et al. 2025).
Additionally, outflows in high-mass galaxies at high redshifts (z > 4) have been studied using rest-frame far-infrared lines of atomic carbon ([C II] 158 μm) and the hydroxyl molecule (OH 119 μm). Deep and observationally expensive millimetre interferometric observations have revealed both emission and absorption features in these far-infrared lines associated with outflowing gas, with velocities reaching up to ∼2000 km/s (Gallerani et al. 2018; Herrera-Camus et al. 2019, 2020; Jones et al. 2019; Bischetti et al. 2019, 2024, 2025; Ginolfi et al. 2020; Butler et al. 2023; Tripodi et al. 2023; Solimano et al. 2024; Parlanti et al. 2025). Some studies have also reported evidence for extended [C II] emission on spatial scales of ∼10 − 20 kpc, which can be naturally interpreted as a by-product of star-formation-driven outflows undergoing radiative cooling. Collectively, these results provide strong evidence for the presence of outflows in massive galaxies in the distant Universe (Pizzati et al. 2023).
Low-mass (M★ < 1010 M⊙) galaxies at high redshifts (z > 3) remain difficult to study as their optical emission lines are redshifted into the near-infrared. Understanding the outflow properties of these galaxies is crucial for assessing quenching mechanisms in the early Universe.
The advent of the James Webb Space Telescope (JWST; Gardner et al. 2006, 2023) with its Near Infrared Spectrograph (NIRSpec; Ferruit et al. 2022; Jakobsen et al. 2022) has provided the sensitivity needed for kinematic analysis of the optical lines at very high redshifts, up to z = 9, and to low stellar masses ∼107 M⊙ where the emission of the broad component is more challenging to observe from ground-based facilities. Several studies, including those based on data from the Cosmic Evolution Early Release Science (CEERS; Bagley et al. 2023; Finkelstein et al. 2023), Early Release Observation (ERO; Pontoppidan et al. 2022), and GLASS-JWST Early Release Science (GLASS-JWST-ERS; Treu et al. 2022) surveys, have identified broad emission-line components likely originating from galactic outflows in low-mass galaxies (M★ = 107 − 109 M⊙) (Tang et al. 2023; Zhang et al. 2024; Xu et al. 2024). Recent analysis of low-mass galaxies in a similar mass range from the JWST Advanced Deep Extragalactic Survey (JADES) survey (Carniani et al. 2024) has reported an outflow incidence rate of approximately 40% depending on the strength of the emission line. The authors suggest that the lack of a ubiquitous detection of a broad component in all galaxies, as expected from cosmological simulations, is mainly due to the sensitivity of the observations and the projection effect of a biconical outflow along the line of sight. Clarifying the intrinsic incidence and orientation dependence of outflows is therefore essential for constraining the morphology of the observed outflowing gas.
The goals of this study are to investigate the physical factors that characterise galactic outflows at high redshifts and to describe the mechanisms driving the observed incidence rate of outflows reported by Carniani et al. (2024) in JADES galaxies, thereby improving our understanding of their origin and properties. To this end, we analysed simulated galaxies from TNG50 and SERRA to explore how outflow detection depends on the viewing angle, gas-phase metallicity, and stellar feedback strength, and to assess whether the relatively low occurrence rate found by JWST can be explained by orientation effects, the physical conditions of the outflowing gas, or limitations in observational sensitivity. We developed a novel approach based on a Gaussian mixture model to identify outflows in the immediate vicinity of galaxies, effectively distinguishing them from the galactic gas. This allowed us to identify those outflows that would be directly observed in telescopes as opposed to complementary works, for example (Nelson et al. 2019), which primarily focus on outflows at a > 10 kpc distance from the galactic centre. By utilising two simulations built on fundamentally different frameworks, we aimed to identify inconsistencies between the models themselves and to disentangle discrepancies with observations that arise from numerical or physical differences. This comparative approach provides deeper insights into the reliability of simulated outflow properties and their connection to real-world observations.
This paper is structured as follows: In Sect. 2, we introduce the two simulations used in our study and describe the algorithm developed to identify galactic outflows. In Sect. 3, we analyse the properties of these outflows and compare them to the observational data from the JADES survey. Finally, in Sect. 4, we summarise our findings and present our conclusions.
2. Methodology
This section is divided into four parts. In Sect. 2.1, we describe the TNG50 cosmological simulation, and in Sect. 2.2, the SERRA zoom-in simulation, both of which provide the data for our analysis. In Sect. 2.3, we describe the selection of our galaxy sample from each simulation. Finally, in Sect. 2.4, we outline the methodology developed to separate outflowing gas from material associated with the galactic disc or inflows feeding the galaxy.
2.1. The TNG50 simulation
The TNG50 simulation (Pillepich et al. 2018a; Springel et al. 2018; Naiman et al. 2018; Nelson et al. 2018; Marinacci et al. 2018) is a cosmological hydrodynamic simulation covering a comoving volume of (51.7 cMpc)3. Together with the TNG100 and TNG300 simulations, it is part of the IllustrisTNG project, which aims to provide detailed insights into galaxy formation and the processes driving it. TNG50 offers the highest resolution within this suite, achieving a baryonic mass resolution of mb = 8.5 × 10⁴ M⊙ and a dark matter mass resolution of mdm = 4.5 × 10⁵ M⊙. The spatial resolution spans a broad dynamic range because the particle masses are nearly fixed: it reaches tens of parsecs in overdense regions such as, galaxies but is substantially lower in the diffuse intergalactic medium.
Gas dynamics within TNG50 are simulated using the AREPO code (Springel 2010), which solves the equations of ideal magnetohydrodynamics (MHD) on a Voronoi mesh, allowing for accurate tracking of gas evolution. The galaxy formation physics models follow the prescriptions developed by Weinberger et al. (2017) and Pillepich et al. (2018b). Radiation feedback from stellar populations is not explicitly simulated. To prevent artificial gravitational collapse of dense, star-forming gas in the absence of such feedback, the subgrid model of Springel & Hernquist (2003) is employed. This model maintains hydrodynamic stability by enforcing pressure equilibrium within the star-forming interstellar medium.
Star formation is modelled by stochastically converting gas cells that exceed a critical density threshold of nH = 0.1 cm−3 into stellar particles according to the Kennicutt–Schmidt relation. Each stellar particle represents a stellar population that initially follows a Chabrier initial mass function (IMF) (Chabrier 2003). Because the two-phase structure of the interstellar medium (ISM) is not explicitly resolved, supernova feedback would not be able to propagate through the low-density phase and would instead be artificially suppressed by a smooth ISM. To circumvent this, feedback from stellar particles is implemented via hydrodynamically decoupled kinetic wind particles (Pillepich et al. 2018b). These particles later recouple to the gas phase once they have left the dense ISM and the gas density has dropped below the critical threshold of nrecouple = 0.005 cm−3. While radiation transport is not explicitly simulated, a uniform ultraviolet (UV) background based on Faucher-Giguère et al. (2009) is activated at z = 6. The simulation tracks chemical enrichment of gas, including the elements C, N, O, Ne, Mg, Si, Fe, and Eu individually.
Black holes are seeded into the centres of galaxies exceeding a halo mass of approximately 1010.8 M⊙, with initial masses of 5 × 10⁵ M⊙. Their subsequent growth is modelled via gas accretion following Bondi formalism, limited by the Eddington accretion rate, or through mergers between black holes. Feedback from black holes includes kinetic, thermal, and indirect radiative components, following the formalism developed by Weinberger et al. (2017).
The TNG50 simulation uses cosmological parameters derived from the Planck 2016 measurements (Planck Collaboration I 2016): Ωm = 0.3089, Ωb = 0.0486, ΩΛ = 0.6911, h = 0.6774, σ8 = 0.8159, and ns = 0.9667. Initial conditions are generated at a redshift of z = 127 using the N-GenIC code (Springel et al. 2005), and the simulation is evolved down to z = 0.
In our analysis, we retrieve galaxies from the TNG50 catalogues, which have been identified using the SubFind algorithm (Springel et al. 2001), which employs the friends-of-friends method (Davis et al. 1985) to detect gravitationally bound structures. Groups exceeding a particle-count threshold of 20 are classified as subhalos.
2.2. The SERRA simulation
The SERRA simulation (Pallottini et al. 2022) comprises a suite of cosmological zoom-in simulations employing a significantly different numerical methodology compared to TNG50. SERRA utilises the RAMSES adaptive mesh refinement (AMR) hydrodynamic code (Teyssier 2002) with an on-the-fly radiative transfer module (Rosdahl et al. 2013). Radiation transport employs a momentum-based method with M1 closure and tracks five separate photon energy bins, with gas-radiation interactions that are coupled via KROME (Grassi et al. 2014; Pallottini et al. 2017a), which incorporates a non-equilibrium chemical network tracking the abundances of species such as H, H+, H−, He, He+, He++, H2, and H , and that is coupled with radiative transfer (Pallottini et al. 2019). Star formation is modelled on a Kennicutt–Schmidt-like relation based on molecular hydrogen density, with stellar particles created stochastically following a Kroupa IMF (Kroupa 2001). Stars act as a source of mechanical, chemical, and radiative feedback according to PADOVA stellar tracks (Bertelli et al. 1994) and directly coupled with the gas (see Pallottini et al. 2017b, for details) without adopting an explicit 2-phase subgrid assumption.
Adopting Planck cosmological parameters, the MUSIC framework (Hahn & Abel 2011) was used to generate various sets of zoom-in initial conditions, with mass resolutions of up to mb = 1.2 × 10⁴ M⊙ for baryonic matter and mdm = 7.2 × 10⁴ M⊙ for dark matter, with spatial resolution reaching ≃30 pc at z = 6 in the highest-resolution regions, while being substantially lower in the diffuse intergalactic medium.
2.3. Sample selection
For our analysis of TNG50 galaxies, we select all systems with stellar masses M★ > 107.5 M⊙ within the redshift range 3 ≤ z ≤ 6, yielding a sample of approximately 60 000 galaxies. The goal is to select a sample whose redshift range matches that of the JADES galaxies, which, with the exception of a single outlier, all fall within this interval. At this mass scale, the simulation provides sufficient numerical resolution of ≳104 gas particles per galaxy.
For the SERRA simulation, we focus on zoom-in regions targeting the most massive haloes (Mh ≥ 1011 M⊙) and their satellite populations, with volumes extending to roughly six times each halo’s virial radius. In this study, we include galaxies evolved down to z = 4 (see Kohandel et al. 2024, for the sample). From these zoom-ins, we extract all galaxies with halo masses Mh ≥ 109 M⊙, corresponding to typical stellar masses of M★ ≳ 107.5 M⊙ within the redshift interval 4 ≤ z ≤ 6. This selection yields a sample of about 3000 SERRA galaxies.
We compare our results with a sample of 14 galaxies for which ionised gas outflows were detected in the JWST Advanced Deep Extragalactic Survey (JADES). The analysis of this sample is presented in Carniani et al. (2024). The galaxy sample used for our comparison is summarised in Table 1.
Sample of high-redshift galaxies with observed ionised gas outflows.
In both simulations, the selected galaxies do not represent independent populations but, to a certain extent, trace the same systems observed at different cosmic epochs. Because the SERRA zoom-ins are centred on massive halos, their galaxy populations are dominated by satellites residing in highly overdense environments. Fig. 1 shows the number of galaxies in each sample as a function of stellar mass. Note that TNG50 provides a representative sampling of the cosmic web, whereas the SERRA sample is intrinsically biased towards dense regions surrounding massive central halos.
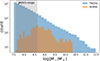 |
Fig. 1. Number of galaxies as a function of stellar mass analysed in this work. The blue and orange histograms report the distribution for TNG50 and SERRA, respectively. The shaded region indicated the mass range of galaxies observed in JADES. |
2.4. Identification of outflows
The primary previous study of galactic outflows in the TNG simulations is Nelson et al. (2019). In that work, outflow rates were estimated by measuring the mass flux through spherical shells at fixed radii, primarily at r = 10 kpc from the galactic centre. This approach targets outflows that are already spatially separated from the main body of the galaxy. In contrast, the goal of the present study is to mimic observational analyses, which probe outflows in and immediately around galaxies, where outflowing gas remains strongly intertwined with the galactic material and a shell-based flux measurement becomes difficult to apply.
Accordingly, our outflow definition differs fundamentally from that of Nelson et al. (2019) Rather than selecting gas at fixed radii (10−20 kpc), we define outflows within fixed apertures mimicking those used to measure the [O III] and Hα emission lines. This focuses our analysis on outflows close to the galaxy, but introduces the challenge of separating outflowing gas from non-outflowing galactic material. To address this, we developed a separation algorithm based on a multivariate Gaussian mixture model, supplemented by physically motivated selection criteria.
Initially, for each TNG50 galaxy, we define a cut-out radius of 5 times the star-formation radius1rSFR for M★ < 109 M⊙ galaxies and 10rSFR for more massive systems, reflecting the fact that star formation in higher-mass galaxies is typically more centrally concentrated in comparison to the more diffuse lower-mass system. For galaxies from the SERRA simulation, the cut-out scale was selected to be twice the size of the field of view, with a radius of 0.6″2. The different choices are made to ensure that most of the outflows are contained within the analysed volume while preferably avoiding neighbouring galaxies.
As a first step in our outflow selection process, we select gas particles exhibiting outward radial velocities relative to the galactic centre, defined by the condition vr = v ⋅ r0 > 0, where r0 is the normalised position vector of the particle relative to the galaxy centre, and v is its velocity vector relative to the galactic centre. This essentially sets a first prior for our selection algorithm.
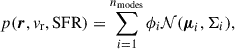
Subsequently, we distribute the selected particles into a 5D space spanned by their spatial coordinates (xi), outward radial velocities (vr), and star formation rate (SFR). The choice of this space is based on the assumption that outflowing gas typically exhibits higher outward velocities, has a different spatial distribution (that is, larger scales) and morphology (that is, biconical), and displays lower star formation activity than the gas comprising the galaxy. Based on these assumptions, we classify gas particles using a Gaussian mixture model (Dempster et al. 1977). We model the distribution of particles in the aforementioned 5D space with a multimodal Gaussian profile defined by
 (1)
(1)
where ϕi represents the weight of the i-th Gaussian mode out of a total of nmodes modes, 𝒩 characterised by mean3μi and covariance matrix Σi. First, we determine the maximum likelihood configuration of the aforementioned probability distribution to best fit the distribution of gas particles. Subsequently, each gas particle is assigned to the mode to which it has the highest likelihood of belonging.
To determine the number of modes, we inspected a sample of galaxies and attempted to separate the outflows by using Equation (1) with different values of nmodes. We performed visual inspections of galaxy samples to guide the classification. We found nmodes = 3 to be the most effective choice, as a higher number of modes often resulted in the galaxy being separated into more than one mode, while having only two modes frequently led to the inclusion of outflows close to the galaxy into the galactic mode. We note that a model with three Gaussian modes usually associates one mode with all particles closer to the galaxy centre, and we assign this mode to the gas in the galaxy. The other two modes are attributed to the outflow component.
Finally, as an additional selection criterion, we consider gas particles that, while not necessarily having positive radial velocities and thus do not satisfy our initial prior, exhibit nonetheless substantial velocities perpendicular to the galactic plane4. This additional criterion is motivated by the possibility of gas being launched tangentially, resulting in minimal radial velocity. We thus introduce a second outflow identification criterion based on the velocity component perpendicular to the galactic plane:
 (2)
(2)
where σ denotes the 1D velocity dispersion5. This criterion ensures that the outflows selected this way are statistically unlikely to belong to the galaxy.
Fig. 2 illustrates our outflow selection process for four representative galaxies: two from the TNG50 simulation and two from SERRA. For each simulation, we depict a low-mass galaxy with M★ = 108 M⊙ and a high-mass galaxy with M★ = 2 − 5 × 10¹⁰ M⊙.
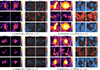 |
Fig. 2. Two sample galaxies from the TNG50 (top) and SERRA (bottom) simulations shown in edge-on and face-on view together with their corresponding radial velocity maps, respectively. From top to bottom, each column shows the full projected gas of the galaxy, the fraction of gas identified as outflows, and the fraction of gas associated with the galaxy itself. |
For TNG50, we see that the lower-mass galaxy is significantly more diffuse and lacks a clearly discernible disc structure. The higher-mass galaxy, on the other hand, has a clear disc structure, and we see an outflow jet originating from the galactic centre.
In SERRA, the lower-mass galaxy on the left is undergoing a merger. Based on visual inspection of a representative galaxy sample, we find that approximately 60% of the SERRA galaxies are in the process of merging. As illustrated here, the extraction algorithm consequently assigns part of the companion galaxy to the outflow component and is currently unable to robustly distinguish between tidal features and feedback-driven outflows. This behaviour is expected, as both the tidal arm and parts of the galactic disc exhibit significant outward velocities relative to the central galaxy. Such kinematic features, as discussed in Kohandel et al. (2019), would likely appear as a broad component in observational data, effectively mimicking what telescopes would detect.
By analysing TNG50 and SERRA simulations, we note that the latter tend to form disc-like structures at lower masses (M★ < 108 M⊙) and earlier times with respect to TNG50 (compare with Kohandel et al. 2024). As a result, the gas in SERRA galaxies is more clumpy and less diffuse than the gas in the TNG50 counterparts of similar mass, such as the example on the left in Fig. 2 (see also Fujimoto et al. 2025, for similar comparison). The galactic morphology of higher-mass (M★ > 1010 M⊙) galaxies in SERRA seems more comparable to those in the TNG50 simulation.
3. Results
3.1. General outflow properties
Once outflows are identified in simulations, we estimate their physical properties and compare them with the observations. To ensure a fair comparison with observational constraints, we compute outflow masses within an area of 0.6″, corresponding to a physical radius of r = 3.5 − 4.7 kpc, from the galactic centre to mimic the spatial coverage of the JWST/NIRSpec MOS observations (Jakobsen et al. 2022). Fig. 3 shows the distribution of galaxies in our sample as a function of stellar mass and associated outflow mass. We note a mild correlation between outflow and stellar masses in both sets of simulations. The outflow mass estimates of both TNG50 and SERRA are broadly consistent with JADES observations by Carniani et al. (2024). However, TNG50 outflows are on average ∼0.5 dex higher than those estimated from observations.
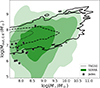 |
Fig. 3. Mass of outflowing gas as a function of galactic stellar mass, measured within a radius of 0.6″. The green contours represent the 1, 2, and 3σ distribution of SERRA galaxies, while the black contours represent the same for TNG50 galaxies. Black stars represent galaxy observations from JADES. |
This offset might indicate that JADES may capture only a fraction (∼35%) of the total outflowing material. The discrepancy likely reflects the multiphase nature of outflows: our model accounts for gas across all phases and temperatures, whereas Hα or [O III] emission maps isolate only the warm ionised component at 104 − 5 K. On the other hand, the observations seem to be consistent with the predictions from SERRA indicating that the optical lines probe a large fraction of gas in the outflows expected from SERRA. A subset of SERRA galaxies exhibits outflow masses lower than 106.5 M⊙ that are not seen in the TNG50 simulation. This difference is likely driven by the different feedback implementations: while in TNG50 the star formation is mostly suppressed via outflows, in SERRA it is more gently regulated via preventative feedback that is, molecular hydrogen photodissociation and turbulence injection (see Pallottini et al. 2025 for a more complete discussion). Thus, large-scale winds are expected to be less prominent.
In summary, Fig. 3 shows that both simulations broadly reproduce the observed trend between stellar mass and outflow mass. On average, the simulated outflow masses are higher by a factor of ∼3, which can plausibly be explained by the limited traceability of a significant fraction of the outflowing material in current observations.
Fig. 4 depicts the SFR–M★ relations for TNG50, SERRA together with the JADES observations. Symbols and distribution are colour-coded by the measured outflow mass. In addition, we over-plot two fits to the star-forming main sequence (SFMS): one based on the meta-analysis prescription of Speagle et al. (2014) and one derived from the FIR-anchored measurements of Pearson et al. (2018). In each case, we adopt the average redshift of our simulation sample when evaluating the respective prescriptions.
 |
Fig. 4. Star formation rate as a function of stellar mass. The colour bar indicates the average mass of outflowing gas in each bin for the total outflowing gas of TNG50 (left) galaxies, the outflowing gas within the aperture of TNG50 galaxies (centre), and the corresponding values for SERRA galaxies (right). Overplotted stars represent galaxies observed by JADES, with their colours representing the outflow mass following the same scale as the respective panels. The dashed green and blue lines show fits based on the SFMS prescriptions of Speagle et al. (2014) and Pearson et al. (2018), respectively. |
The left panel shows the total outflow mass of TNG50 galaxies the central panel restricts this to outflows within the aperture, while the right panel presents the aperture-limited outflows of SERRA galaxies. For the latter, an extended field of view is not informative, as in almost all cases this would include additional galaxies contaminating the data. Intuitively, the outflow mass is expected to scale with the 10 Myr averaged SFR at fixed stellar mass. This is particularly true for lower-mass galaxies, as in this case outflows are predominantly powered by supernovae from massive stars, which typically occur a few Myr after their formation. While this should hold in a quasi-steady state situation, if burstiness becomes important on a timescale different than 10 Myr (Pallottini & Ferrara 2023; Sun et al. 2025), a decoupling can be expected between SFR and subsequent outflows.
The observed galaxies have an approximately 1.5 orders of magnitude higher SFR with respect to the average SFR of the mass-matched galaxies from TNG50 and are thus located outside the 3σ contour. Because TNG50 is calibrated to reproduce the observed stellar masses at redshift zero, the total SFR integrated over cosmic time is correct by construction. A mismatch at higher redshift therefore points to two possibilities. Either the evolution of the SFH differs from the model, meaning that star formation occurs at different epochs than TNG predicts, or, more plausibly, burstiness is higher than what the model predicts. Enhanced burstiness would naturally broaden the distribution of SFRs at fixed stellar mass. This higher burstiness is likely to be especially prominent in lower-mass galaxies (M★ ∼ 108 M⊙) (Asada et al. 2024; Simmonds et al. 2025) and at higher redshifts (Cole et al. 2025; McClymont et al. 2025), consistent with the properties of our comparison sample. Indeed, the substantial diversity of SFHs across a wide range of timescales reported for a variety of models by Iyer et al. (2020) illustrates that significant power on short timescales is compatible with a range of modelling assumptions. Additionally, this result could suggest that observations are biased towards detecting outflows only in starburst galaxies driving larger outflows.
In contrast to the TNG50 results, the SFRs seen in the SERRA sample align well with the JADES observations. The observations are still located between 1−3σ from the average value. However, unlike TNG50, SERRA is not calibrated to reproduce the stellar mass function at redshift zero. Moreover, the plot seems to slightly indicate that galaxies with higher SFRs tend to exhibit greater outflow masses. However, no strong correlation is visible, likely due to a substantial portion of the outflows being associated with tidal features from merger events rather than being driven by stellar feedback.
When investigating the total outflows in TNG50 (left plot in Fig. 4), galaxies with low stellar masses (M★ ≲ 109 M⊙), the total mass of outflowing gas correlates with the SFR at fixed stellar mass, whereas this correlation weakens or disappears at higher stellar masses. As discussed in Appendix B, this is mainly caused by the fact that a significant fraction of the outflows in higher-mass galaxies is contained in the hydrodynamically decoupled wind particles. Once these particles are included (see Fig. B.2), the correlation is also clearly seen in more massive galaxies.
When limiting the outflowing mass to only the aperture, the correlation for low-mass galaxies with SFR vanishes while a slight correlation can be seen for galaxies with M★ > 109.5 M⊙. This likely arises due to the fact that low-mass galaxies are highly diffuse in TNG50 (see Fig. 2), such that even at larger radii the gas density remains relatively high. Given that wind particles only hydrodynamically recouple to the surrounding medium at a threshold density of 0.005 cm−3 (see Sect. 2.1), some of the outflows are missed at closer distances as they only recouple later on.
When comparing our results to the two SFMS fits, we find that the simulated galaxies are in good agreement with the relation from Pearson et al. (2018). In contrast, the JADES galaxy sample is broadly consistent with the prescription of Speagle et al. (2014), although most galaxies lie systematically above the fitted relation. Part of this difference may therefore be attributable to the fact that the simulations are calibrated against a specific choice of SFMS. However, the systematic offset of the JADES galaxies above even the upper SFMS fit suggests that the sample is likely biased towards more actively star-forming systems.
In summary, Fig. 4 shows that TNG50 underpredicts the SFRs of JADES galaxies at fixed stellar mass, likely due to insufficient burstiness and observational selection effects favouring starburst systems, whereas the SERRA sample exhibits SFRs broadly consistent with the observations. In TNG50, the weak correlation between SFR and outflow mass can be attributed to excluded outflow material at larger radii in low-mass galaxies (M★ < 109 M⊙) and to the exclusion of hydrodynamically decoupled wind particles in higher-mass systems (M ★ > 109 M⊙). In SERRA, the lack of a clear correlation is instead driven by the substantial contribution of merger-induced tidal features to the measured outflow masses.
In observations, outflow velocities are typically inferred from the line width of the component associated with fast gas. For example, Carniani et al. (2024) measured the outflow velocity as vout = |vbroad − vnarrow|+2σbroad where |vbroad − vnarrow| is the velocity shift between the peak of the broad and narrow emission line components, and σbroad is the velocity dispersion of the broad component. The results in the work seem to suggest that this measurement should weakly depend on the outflow orientation with respect to the line of sight. In simulations, however, there is no unique definition for the outflow velocity, as each particle has its own value. By studying the distribution of radial velocities of outflowing particles, we find that the range varies significantly across targets. We therefore adopt an approach similar to that used in observational studies and define the outflow velocity as the 80th percentile of the radial velocity distribution, hereafter denoted as vr, 80. In Fig. 5, we investigate the outflow velocity vr, 80 as a function of galactic stellar mass. The colour scale indicates the average outflow mass within each bin, revealing an anti-correlation between outflow velocity and outflow mass for TNG50 galaxies, while no noticeable correlation can be seen for SERRA galaxies. Two potential explanations could account for this trend. First, physically, if a fixed amount of energy from supernovae is distributed among a larger mass of gas, the resulting average kinetic energy per gas particle will be lower. Alternatively, the observed trend might stem from a numerical artefact, whereby higher outflow masses result from the misclassification of galactic gas as outflowing material, which in turn tends to be slower.
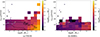 |
Fig. 5. Velocity of the 80th percentile of outflowing gas as a function of stellar mass. Velocities are measured within a radius corresponding to an observed radius of 0.6″ for TNG50 galaxies (left) and SERRA galaxies (right). The colour bar indicates the average velocity value in each bin. Stars represent galaxies observed by JADES, with colours following the same scale as the histograms. |
In both cases, we find that most JADES galaxies exhibit far higher outflow velocities than those found in either TNG50 or SERRA. In TNG50, outflow velocities are determined by the specific implementation of wind particles (see Sect. 2.1). In particular, their velocities are prescribed to scale with the host halo’s velocity dispersion, although this relationship may not hold in reality or may deviate from a strictly linear scaling. In summary, most JADES galaxies exhibit substantially higher outflow velocities than those predicted by either TNG50 or SERRA. In TNG50, the comparatively low velocities arise from the wind model, in which outflow speeds are tied to the host halo velocity dispersion, while in SERRA the absence of similarly high velocities is likely related to the dominant contribution of slower tidal flows associated with merger events. Systematic uncertainties in observationally inferred outflow velocities may additionally contribute to the observed discrepancy.
Finally, in Fig. 6, we investigate the metallicities of the outflows by examining the ratio of the metallicity of the outflowing gas, Zout, to that of the galactic gas, Zgal. We observe that outflows typically exhibit significantly lower metallicities compared to their host galaxies. For TNG the average metallicity ratio is ⟨Zout/Zgal⟩TNG = 0.52, and for SERRA the ratio is even lower at ⟨Zout/Zgal⟩SERRA = 0.16. Several factors might explain this difference.
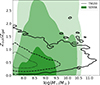 |
Fig. 6. Ratio between the metallicity of the outflowing gas and the metallicity of the galactic gas as a function of galactic stellar mass, measured within a radius of 0.6″. The green contours represent the 1, 2, and 3 σ distribution of SERRA galaxies, while the black contours represent the same for TNG50 galaxies. |
First, outflows originate in regions of intense star formation, where the surrounding gas is actively being metal-enriched. This contrasts with older stellar populations, in which the majority of supernova-produced metals have already been deposited into the interstellar medium. Second, supernova-driven outflows can sweep up gas that lies outside the star-forming regions or even gas still undergoing inflow, which has not yet mixed thoroughly with metal-enriched gas. Third, in the TNG50 simulation, the mass loading due to star formation is scaled down with the metallicity of the star-forming region based on the idea that high metallicity regions are more efficient at dissipating energy through radiation (Pillepich et al. 2018b). Fourth, if the feature identified as an outflow actually corresponds to a tidal tail generated during a merger event, as is often the case in SERRA, the observed low metallicity may be explained by the presence of accreting gas that has not yet undergone star formation.
An important implication of this result is that the mass of outflows may be systematically underestimated when metal emission lines such as [O III] are used as tracers. Observationally, the [O III] luminosity is converted into an outflow mass by adopting an assumed oxygen abundance. This introduces a bias if the outflowing gas does not, in fact, share the same metallicity as the host galaxy.
In summary, Fig. 6 shows that outflows are systematically metal-poor relative to their host galaxies, with average metallicity ratios of ⟨Zout/Zgal⟩≃0.5 in TNG50 and ≃0.16 in SERRA. This implies that outflow masses inferred from metal emission lines such as [O III] may be systematically underestimated if the metallicity of the outflowing gas is assumed to be comparable to that of the host galaxy.
3.2. Orientation dependence
In this section, we examine how galaxy orientation influences the detectability of galactic outflows. From an observational point of view, outflows are typically identified by the presence of a broad component in the emission line profile, which indicates high-velocity gas along the line of sight. If the outflowing gas moves predominantly perpendicular to the line of sight, the projected velocity is close to zero. As a result, the spectral signature lacks the broadened wings associated with fast-moving gas, making the outflow much harder to detect (see e.g. Phillips et al. 2025). Galaxies that are converging toward a disc-like morphology are expected to exhibit outflows that are more easily detectable in face-on orientations than in edge-on views. This is due to several factors. First, the gas density perpendicular to the galactic disc is typically lower, providing less resistance to escaping material and allowing outflows to develop more prominently. Second, because there is no rotational component in the direction perpendicular to the disc, the gas velocity component in this direction is generally lower than within the plane, which makes it easier to identify outflowing components. Third, since star formation is concentrated in the galactic disc, outflows are often launched preferentially along the minor axis, perpendicular to the plane, where they are more visible in face-on orientations.
Carniani et al. (2024) and Xu et al. (2024) suggest that the relatively low incidence rate of outflows–around 30% in high-z galaxies may be influenced by galaxy inclination. To investigate this possibility, we projected the velocities of both outflow and remain gas particles along various lines of sight relative to the plane of the galaxy, defined as the plane perpendicular to its angular momentum vector. The distribution of projected velocities is expected to approximate the spectral profile of the emission line produced by the same gas particles.
We stress, however, that the observed emission-line profile matches the velocity distribution only under the assumption that all gas particles emit with luminosity proportional to their mass6. We then calculated the width of the distribution using W80, defined as the difference between the velocities at the 90th and 10th percentiles. For a Gaussian profile, W80 is comparable to the FWHM.
In Fig. 7, we apply this method to the two representative TNG50 galaxies shown in Fig. 2. An edge-on viewing angle clearly broadens the velocity distribution of the galactic gas, thereby reducing the width ratio between the outflowing and galactic components. For the lower-mass galaxy (M★ ≈ 108 M⊙), this effect is modest, with W80, out/W80, gal decreasing from 1.36 to 1.17. In contrast, the more massive galaxy (M★ ≈ 5 × 10¹⁰ M⊙) exhibits a dramatic reduction in the width ratio, from ≈2 in the face-on view to 0.52 when viewed edge-on. Consequently, depending on the viewing angle, outflows in massive systems may either appear as a clearly identifiable broad component or become effectively undetectable when relying solely on line broadening.
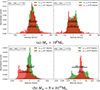 |
Fig. 7. Line-of-sight projected normalised velocity distributions for the two example TNG50 galaxies shown in Fig. 2, illustrating their respective W80 measurements for a face-on view (left) and an edge-on view (right). The corresponding W80, out/W80, gal ratio is indicated in the top-left corner of each panel. |
Initially, we analysed the results from the TNG50 simulation. The left panels of Fig. 8 show the distribution of ratios of the W80, out of the “outflow” gas and W80, gal of the “remain” gas particles for face-on (0 deg) and edge-on (90 deg) galaxies. The dashed line at W80, out/W80, gal = 1.2 represents the prior criterion used by Carniani et al. (2024) to identify outflows. According to this criterion, galaxies positioned to the left of this threshold line would not be recognised as having detectable outflows.
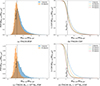 |
Fig. 8. Top-left: Normalised distribution (PDF) of the ratios of the velocity distribution widths between the outflows (W80, out) and the galaxy (W80, gal) in TNG50 galaxies for a face-on orientation (0°) and an edge-on orientation (90°). The ratio of 1.2, indicated by the vertical line, represents minimal ratio used by JADES to separate outflows from galactic gas. Top-right: Complement cumulative distribution 1–CDF of the width ratios for various galactic orientation angles. Bottom: Same as above but limited to galaxies with M★ > 108.5 M⊙. |
Because low-mass galaxies at early epochs often lack clearly defined disc structures, differentiating between edge-on and face-on orientations can be challenging. Therefore, to highlight the impact of galaxy orientation on more structured systems, we additionally examine galaxies with stellar masses M★ > 108.5 M⊙ in the bottom panels of Fig. 8. The right panels show the complementary cumulative distributions of W80, out/W80, gal values for four different orientation angles.
In the case of the full sample of galaxies, approximately 70% of face-on galaxies and around 55% of edge-on galaxies meet the JADES detectability prior. Hence, the detectability does depend on the viewing angle, but the difference in occurrence rate is of the order of 10−15%. For galaxies within the mass range probed by JADES and assuming random orientations of their galactic planes, we find that 66.4% of priors exhibit a W80 ratio > 1.2, thereby fulfilling the condition for outflow detectability.
When examining the sample of more massive (M★ > 108.5 M⊙) galaxies below, we observe that orientation plays a significantly larger role. For these disc-shaped galaxies, outflows viewed face-on are detectable in about 65% of cases, whereas detectability drastically decreases to approximately 25% for an edge-on orientation due to overlapping velocity distributions with the galactic gas. While these galaxies are more massive than most of those observed in the JADES sample, it is important to note that TNG50 galaxies are generally more diffuse than expected at high redshift. Consequently, the angle dependence identified in the more massive simulated systems may well extend to real galaxies of lower mass.
Finally, in Fig. 9, we examine the orientation dependence of galactic outflow detectability in SERRA. This figure is analogous to the top row of Fig. 8. We notice that only about 10−15% of SERRA outflows would be detectable, which is a factor of 3−4 lower than what is observed in the JADES study. Given that most SERRA galaxies have cooled into disc-like structures, one might expect a larger angular dependence compared to TNG50. Surprisingly, the opposite appears to be true: the difference in outflow detectability between face-on and edge-on orientations is only marginal. For lower-mass galaxies, this unexpected result can be attributed to the high frequency of mergers, which dominate the outflow signatures. In a merger, the orientation of the tidal tail of the merger is independent of the galaxy orientation, thus resulting in a weak angular dependence of the identified outflows. Interestingly, this lack of angular dependence persists even when the sample is restricted to only high-mass galaxies, as was done for the TNG50 sample in the bottom row of Fig. 87. In this regime, major mergers are much less common, and yet no strong orientation dependence emerges. This likely reflects the longer merger timescales, which leave prominent merger remnants that obscure the underlying galactic morphology and, with it, any preferred outflow direction. An example is the massive SERRA galaxy shown in Fig. 2, where residual rotational features appear misaligned with the galactic disc. This feature is present in a substantial fraction of SERRA galaxies and offers a natural explanation for the lack of orientation dependence. The origin of these frequently observed secondary discs is likely tied to merger events. Typically, SERRA galaxies are not fully disrupted and reassembled during mergers (Kohandel et al. 2020, 2024), instead, they tend to interpenetrate and gradually coalesce, allowing remnants of the merging systems–such as misaligned gaseous discs–to persist temporarily as distinct rotational components. Although some systems do exhibit clear directional outflows (Kohandel et al. 2025), such cases seem rare and do not appear to dominate the overall statistics.
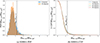 |
Fig. 9. Left: Distribution of the ratios of the velocity distribution widths between the outflows (W80, out) and the galaxy (W80, gal) in SERRA galaxies for a face-on orientation (0°) and an edge-on orientation (90°). The ratio of 1.2, indicated by the vertical line, represents minimal ratio used by JADES to separate outflows from galactic gas. Right: Complement cumulative distribution of the width ratios for various galactic orientation angles. |
In summary, galaxy orientation has a measurable but modest impact on outflow detectability in TNG50, increasing the detection fraction by only ∼10 − 15% for face-on systems in the full sample, although the effect becomes significantly stronger in more massive, disc-dominated galaxies, which may represent more realistic morphological analogues of the systems observed in JADES. In contrast, SERRA exhibits generally low outflow detectability with only a weak dependence on viewing angle, consistent with a dominant contribution from merger-driven structures that obscure any preferred outflow direction.
3.3. Evolution of outflows over time
In Fig. 10, we examine the temporal evolution of outflows within individual galaxies from the TNG50 simulation. To this end, we follow the most massive progenitors of selected galaxies across the redshift range considered, computing their outflow properties at each snapshot. Because our algorithm tracks galaxies that consistently remain the most massive within their host halos, we focus on a small set of representative cases for which a progenitor can be reliably identified at every snapshot.
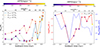 |
Fig. 10. Left: Evolution of the ratio of the outflow gas mass to galactic stellar mass for three medium-sized galaxies as a function of lookback time with the sSFR at a given snapshot depicted on the colour scale. Hereby M★, fin represents the stellar mass at the most recent time. Right: Evolution of the same ratio but on a logarithmic scale for one massive galaxy with the blue line representing the rate of black hole. |
In the left-hand plot, we highlight three galaxies that reach a final stellar mass of approximately M★, fin = 109.5 M⊙ at redshift z = 3. This choice was made to ensure that the sample contains galaxies without an active AGN while being massive enough to have a history spanning multiple redshifts. From this group, we selected three examples that exhibited particularly strong evolution in their specific SFR (sSFR). We find that long-term increases in the relative mass of outflows correlate closely with increases in sSFR. However, there are notable abrupt increases in outflow activity that cannot be solely explained by star formation bursts; these are likely driven in part by tidal interactions with neighbouring galaxies. The selected examples show a general trend of declining star formation and outflow activity at later times.
On the right-hand side, we show the evolution of outflows in one of the most massive galaxies in the TNG50 simulation, with a final stellar mass of M★, fin = 1011.5 M⊙ at z = 3. This massive galaxy exhibits notably different behaviour compared to less massive examples. Initially, we observe a similar decrease in sSFR and a corresponding decline in outflow activity. However, outflows increase again at a lookback time of approximately 12.2 Gyr (note the logarithmic scaling is needed due to large fluctuations). As indicated by the blue line representing the black hole growth rate, the resurgence of outflow activity at later times is likely driven by increased black hole accretion, resulting in powerful outflow jets from the central AGN.
In summary, low-mass (M★, fin ≲ 1010 M⊙) galaxies, where outflows are predominantly supernova-driven, exhibit a close correlation between outflow mass and sSFR, with outflows declining at lower redshifts once the galaxy becomes more quenched. In massive galaxies (M★, fin ≳ 1010 M⊙), the same trend is initially observed; however, at later times (z ≲ 4), the central black hole emerges as the dominant driver of outflows. As a result, the outflow mass continues to rise toward lower redshifts, even as the sSFR declines substantially.
4. Conclusions and outlook
Recent advances in observations have opened new possibilities for examining galactic outflows in unprecedented detail. In order to accurately interpret these observations, a comparison with their theoretical counterpart is crucial. For this purpose, we developed a novel methodology to study outflows in the immediate vicinity of galaxies drawn from two distinct simulations, TNG50 (Pillepich et al. 2018a) and SERRA (Pallottini et al. 2022). To extract these outflows, we employed a Gaussian mixture model to assign gas particles in and around each galaxy to different modes based on their properties, including spatial position, velocity, and star formation rate. This approach allowed us to disentangle overlapping gas components and robustly separate outflowing from galactic gas. Our goal was to investigate the properties of galactic outflows in simulated galaxies and assess their connections to recent JWST observations. In particular, we examined outflow masses, the coupling between star formation and feedback, gas-phase metallicities, outflow velocities, and the detectability of outflows as a function of their orientation relative to the observer. In addition, we analysed the time evolution of outflows in a small set of representative galaxies. Our main findings can be summarised as follows:
-
Outflow mass: The outflow masses estimated in both the TNG50 and SERRA simulations span a wide range, from 105 to 109 M⊙, depending on galaxy mass. At the stellar masses of JADES galaxies (∼108 M⊙), the average outflow mass is 107.5 M⊙ and 107 M⊙ for TNG50 and SERRA, respectively, and they are about 0.5−1 dex higher than the median values inferred from observations. This offset may suggest that optical lines trace only a fraction of the total outflow. However, considering the full distribution of outflow masses in the simulations, we note that the discrepancy is not severe and predictions and observations agree within 1 − 2σ. We also note that the JADES sample by Carniani et al. (2024) includes only 14 galaxies, which is not sufficient to obtain a complete distribution of outflow mass estimates.
-
SFR: Galaxies observed in JADES typically show star formation rates at the upper end of, or exceeding, those in the TNG50 simulations. This points to a combination of an underestimation of star-formation burstiness in low-mass galaxies in TNG50 and a selection bias in JADES toward more actively star-forming systems. Furthermore, we find that the correlation between outflow mass and star formation rate is weak, but becomes stronger when outflows are measured at larger radii.
-
Velocities: Outflow velocities inferred from simulations are, on average, a factor of about 10 lower than those observed. Notably, a subset of targets shows velocities that exceed the predictions of both SERRA and TNG50. This discrepancy likely reflects model assumptions and parameter choices that systematically underpredict wind velocities, such as the halo mass dependent wind speed in TNG50.
-
Metallicities: The observed metallicities of outflows tend to be lower than those of their host galaxies, suggesting that estimates of outflow mass derived from metal-line emission (such as [OIII]) could be systematically underestimated, potentially by a factor of two to eight.
-
Orientation effects: In TNG50, the detection of outflows as a broad spectral component is strongly affected by galaxy orientation. Face-on systems generally exhibit higher detectability than edge-on systems. While on average the difference of detectability is 15% it increases to 40% for more massive (M★ ≳ 108.5 M⊙) galaxies, which tend to have a disc-like morphology. In contrast, the more merger-driven outflows in SERRA do not display a comparable orientation dependence, suggesting that their kinematic signatures are dominated by merger-induced dynamics.
-
Time evolution: For intermediate-mass galaxies (M★ ≈ 109.5 M⊙), we observe a decrease in outflow activity from z = 6 to z = 3, likely associated with a decreasing star formation activity, as evidenced by declining sSFR. In contrast, massive galaxies (M★ ≈ 1011 M⊙) show a resurgence of outflow activity at later times due to increased feedback from central AGN.
This study has compared outflows in the immediate vicinity of galaxies with their observational counterparts from JWST. By employing two independent simulations, we were able to disentangle intrinsic physical trends from model-specific features, thereby increasing the robustness of our interpretation.
Data availability
Data directly related to this publication and its figures are available on request from the corresponding author. The IllustrisTNG simulations, including TNG50, are publicly available and accessible at www.tng-project.org/data (see Nelson et al. 2019).
Acknowledgments
We acknowledge support by the European Union’s HE ERC Starting Grant No. 101040227 – WINGS (PI: Carniani). Any dissemination of results must indicate that it reflects only the author’s view and that the Commission is not responsible for any use that may be made of the information it contains. We acknowledge the CINECA award under the ISCRA initiative, for the availability of high-performance computing resources and support from the Class B project SERRA HP10BPUZ8F (PI: A. Pallottini). We gratefully acknowledge the computational resources of the Center for High Performance Computing (CHPC) at SNS. The authors extend their gratitude to Ruediger Pakmor for insightful discussions that have contributed to the development of this work, in particular, on the characteristics of the TNG50 dataset.
References
- Arribas, S., Colina, L., Bellocchi, E., Maiolino, R., & Villar-Martín, M. 2014, A&A, 568, A14 [NASA ADS] [CrossRef] [EDP Sciences] [Google Scholar]
- Asada, Y., Sawicki, M., Abraham, R., et al. 2024, MNRAS, 527, 11372 [Google Scholar]
- Bagley, M. B., Finkelstein, S. L., Koekemoer, A. M., et al. 2023, ApJ, 946, L12 [NASA ADS] [CrossRef] [Google Scholar]
- Bertelli, G., Bressan, A., Chiosi, C., Fagotto, F., & Nasi, E. 1994, A&AS, 106, 275 [NASA ADS] [Google Scholar]
- Bertola, E., Cresci, G., Venturi, G., et al. 2025, A&A, 699, A220 [NASA ADS] [CrossRef] [EDP Sciences] [Google Scholar]
- Binney, J., & Tremaine, S. 2008, Galactic Dynamics: Second Edition (Princeton: Princeton University Press) [Google Scholar]
- Bischetti, M., Maiolino, R., Carniani, S., et al. 2019, A&A, 630, A59 [NASA ADS] [CrossRef] [EDP Sciences] [Google Scholar]
- Bischetti, M., Choi, H., Fiore, F., et al. 2024, ApJ, 970, 9 [NASA ADS] [CrossRef] [Google Scholar]
- Bischetti, M., Feruglio, C., Carniani, S., et al. 2025, ApJ, 990, L31 [Google Scholar]
- Butler, K. M., van der Werf, P. P., Topkaras, T., et al. 2023, ApJ, 944, 134 [NASA ADS] [CrossRef] [Google Scholar]
- Carniani, S., Marconi, A., Maiolino, R., et al. 2015, A&A, 580, A102 [NASA ADS] [CrossRef] [EDP Sciences] [Google Scholar]
- Carniani, S., Venturi, G., Parlanti, E., et al. 2024, A&A, 685, A99 [NASA ADS] [CrossRef] [EDP Sciences] [Google Scholar]
- Chabrier, G. 2003, PASP, 115, 763 [Google Scholar]
- Christensen, C. R., Davé, R., Governato, F., et al. 2016, ApJ, 824, 57 [CrossRef] [Google Scholar]
- Cicone, C., Maiolino, R., & Marconi, A. 2016, A&A, 588, A41 [NASA ADS] [CrossRef] [EDP Sciences] [Google Scholar]
- Cole, J. W., Papovich, C., Finkelstein, S. L., et al. 2025, ApJ, 979, 193 [Google Scholar]
- Concas, A., Popesso, P., Brusa, M., et al. 2017, A&A, 606, A36 [NASA ADS] [CrossRef] [EDP Sciences] [Google Scholar]
- Concas, A., Maiolino, R., Curti, M., et al. 2022, MNRAS, 513, 2535 [NASA ADS] [CrossRef] [Google Scholar]
- Davies, R. L., Förster Schreiber, N. M., Übler, H., et al. 2019, ApJ, 873, 122 [Google Scholar]
- Davis, M., Efstathiou, G., Frenk, C. S., & White, S. D. 1985, ApJ, 292, 371 [NASA ADS] [CrossRef] [Google Scholar]
- Debuhr, J., Quataert, E., & Ma, C.-P. 2012, MNRAS, 420, 2221 [NASA ADS] [CrossRef] [Google Scholar]
- Dempster, A. P., Laird, N. M., & Rubin, D. B. 1977, J. Roy. Stat. Soc. Ser. B (Methodol.), 39, 1 [Google Scholar]
- Faucher-Giguère, C.-A., Lidz, A., Zaldarriaga, M., & Hernquist, L. 2009, ApJ, 703, 1416 [Google Scholar]
- Ferruit, P., Jakobsen, P., Giardino, G., et al. 2022, A&A, 661, A81 [NASA ADS] [CrossRef] [EDP Sciences] [Google Scholar]
- Finkelstein, S. L., Bagley, M. B., Ferguson, H. C., et al. 2023, ApJ, 946, L13 [NASA ADS] [CrossRef] [Google Scholar]
- Förster Schreiber, N. M., Genzel, R., Newman, S. F., et al. 2014, ApJ, 787, 38 [Google Scholar]
- Förster Schreiber, N. M., Übler, H., Davies, R. L., et al. 2019, ApJ, 875, 21 [Google Scholar]
- Fujimoto, S., Ouchi, M., Kohno, K., et al. 2025, Nat. Astron., 9, 1553 [Google Scholar]
- Gallerani, S., Pallottini, A., Feruglio, C., et al. 2018, MNRAS, 473, 1909 [Google Scholar]
- Gardner, J. P., Mather, J. C., Clampin, M., et al. 2006, Space Sci. Rev., 123, 485 [Google Scholar]
- Gardner, J. P., Mather, J. C., Abbott, R., et al. 2023, PASP, 135, 068001 [NASA ADS] [CrossRef] [Google Scholar]
- Ginolfi, M., Jones, G. C., Béthermin, M., et al. 2020, A&A, 633, A90 [NASA ADS] [CrossRef] [EDP Sciences] [Google Scholar]
- Grassi, T., Bovino, S., Schleicher, D. R. G., et al. 2014, MNRAS, 439, 2386 [Google Scholar]
- Hahn, O., & Abel, T. 2011, MNRAS, 415, 2101 [Google Scholar]
- Harrison, C. M., Alexander, D. M., Mullaney, J. R., et al. 2016, MNRAS, 456, 1195 [Google Scholar]
- Herrera-Camus, R., Tacconi, L., Genzel, R., et al. 2019, ApJ, 871, 37 [NASA ADS] [CrossRef] [Google Scholar]
- Herrera-Camus, R., Sturm, E., Graciá-Carpio, J., et al. 2020, A&A, 633, L4 [Google Scholar]
- Iyer, K. G., Tacchella, S., Genel, S., et al. 2020, MNRAS, 498, 430 [NASA ADS] [CrossRef] [Google Scholar]
- Jakobsen, P., Ferruit, P., Alves de Oliveira, C., et al. 2022, A&A, 661, A80 [NASA ADS] [CrossRef] [EDP Sciences] [Google Scholar]
- Jones, G. C., Maiolino, R., Caselli, P., & Carniani, S. 2019, A&A, 632, L7 [NASA ADS] [CrossRef] [EDP Sciences] [Google Scholar]
- Kakkad, D., Mainieri, V., Vietri, G., et al. 2020, A&A, 642, A147 [NASA ADS] [CrossRef] [EDP Sciences] [Google Scholar]
- Kohandel, M., Pallottini, A., Ferrara, A., et al. 2019, MNRAS, 487, 3007 [NASA ADS] [CrossRef] [Google Scholar]
- Kohandel, M., Pallottini, A., Ferrara, A., et al. 2020, MNRAS, 499, 1250 [Google Scholar]
- Kohandel, M., Pallottini, A., Ferrara, A., et al. 2024, A&A, 685, A72 [NASA ADS] [CrossRef] [EDP Sciences] [Google Scholar]
- Kohandel, M., Pallottini, A., & Ferrara, A. 2025, A&A, 704, A39 [NASA ADS] [CrossRef] [EDP Sciences] [Google Scholar]
- Kroupa, P. 2001, MNRAS, 322, 231 [NASA ADS] [CrossRef] [Google Scholar]
- Leung, G. C. K., Coil, A. L., Aird, J., et al. 2019, ApJ, 886, 11 [NASA ADS] [CrossRef] [Google Scholar]
- Li, M., Bryan, G. L., & Ostriker, J. P. 2017, ApJ, 841, 101 [NASA ADS] [CrossRef] [Google Scholar]
- Llerena, M., Amorín, R., Pentericci, L., et al. 2023, A&A, 676, A53 [NASA ADS] [CrossRef] [EDP Sciences] [Google Scholar]
- Lutz, D., Sturm, E., Janssen, A., et al. 2020, A&A, 633, A134 [NASA ADS] [CrossRef] [EDP Sciences] [Google Scholar]
- Marinacci, F., Vogelsberger, M., Pakmor, R., et al. 2018, MNRAS, 480, 5113 [NASA ADS] [Google Scholar]
- McClymont, W., Tacchella, S., Smith, A., et al. 2025, MNRAS, 544, 513 [Google Scholar]
- Mitchell, P. D., Schaye, J., Bower, R. G., & Crain, R. A. 2020, MNRAS, 494, 3971 [Google Scholar]
- Naiman, J. P., Pillepich, A., Springel, V., et al. 2018, MNRAS, 477, 1206 [Google Scholar]
- Nelson, D., Pillepich, A., Springel, V., et al. 2018, MNRAS, 475, 624 [Google Scholar]
- Nelson, D., Pillepich, A., Springel, V., et al. 2019, MNRAS, 490, 3234 [Google Scholar]
- Nelson, D., Springel, V., Pillepich, A., et al. 2019, Comput. Astrophys. Cosmol., 6, 2 [Google Scholar]
- Pallottini, A., & Ferrara, A. 2023, A&A, 677, L4 [NASA ADS] [CrossRef] [EDP Sciences] [Google Scholar]
- Pallottini, A., Ferrara, A., Bovino, S., et al. 2017a, MNRAS, 471, 4128 [NASA ADS] [CrossRef] [Google Scholar]
- Pallottini, A., Ferrara, A., Gallerani, S., et al. 2017b, MNRAS, 465, 2540 [CrossRef] [Google Scholar]
- Pallottini, A., Ferrara, A., Decataldo, D., et al. 2019, MNRAS, 487, 1689 [Google Scholar]
- Pallottini, A., Ferrara, A., Gallerani, S., et al. 2022, MNRAS, 513, 5621 [NASA ADS] [Google Scholar]
- Pallottini, A., Ferrara, A., Gallerani, S., et al. 2025, A&A, 699, A6 [NASA ADS] [CrossRef] [EDP Sciences] [Google Scholar]
- Pandya, V., Fielding, D. B., Anglés-Alcázar, D., et al. 2021, MNRAS, 508, 2979 [NASA ADS] [CrossRef] [Google Scholar]
- Parlanti, E., Carniani, S., Pallottini, A., et al. 2023, A&A, 673, A153 [NASA ADS] [CrossRef] [EDP Sciences] [Google Scholar]
- Parlanti, E., Carniani, S., Venturi, G., et al. 2025, A&A, 695, A6 [NASA ADS] [CrossRef] [EDP Sciences] [Google Scholar]
- Pearson, W. J., Wang, L., Hurley, P. D., et al. 2018, A&A, 615, A146 [NASA ADS] [CrossRef] [EDP Sciences] [Google Scholar]
- Perna, M., Lanzuisi, G., Brusa, M., Mignoli, M., & Cresci, G. 2017, A&A, 603, A99 [NASA ADS] [CrossRef] [EDP Sciences] [Google Scholar]
- Perna, M., Arribas, S., Ji, X., et al. 2025, A&A, 694, A170 [NASA ADS] [CrossRef] [EDP Sciences] [Google Scholar]
- Phillips, S., Rizzo, F., Kohandel, M., Smit, R., & Pallottini, A. 2025, MNRAS, 544, 2758 [Google Scholar]
- Pillepich, A., Nelson, D., Hernquist, L., et al. 2018a, MNRAS, 475, 648 [Google Scholar]
- Pillepich, A., Springel, V., Nelson, D., et al. 2018b, MNRAS, 473, 4077 [Google Scholar]
- Pizzati, E., Ferrara, A., Pallottini, A., et al. 2023, MNRAS, 519, 4608 [NASA ADS] [CrossRef] [Google Scholar]
- Planck Collaboration I. 2016, A&A, 594, A1 [NASA ADS] [CrossRef] [EDP Sciences] [Google Scholar]
- Pontoppidan, K. M., Barrientes, J., Blome, C., et al. 2022, ApJ, 936, L14 [NASA ADS] [CrossRef] [Google Scholar]
- Rakshit, S., & Woo, J.-H. 2018, ApJ, 865, 5 [Google Scholar]
- Reichardt Chu, B., Fisher, D. B., Nielsen, N. M., et al. 2022, MNRAS, 511, 5782 [NASA ADS] [CrossRef] [Google Scholar]
- Rodríguez Del Pino, B., Perna, M., Arribas, S., et al. 2024, A&A, 684, A187 [NASA ADS] [CrossRef] [EDP Sciences] [Google Scholar]
- Rodríguez Del Pino, B., Arribas, S., Perna, M., et al. 2026, A&A, in press, https://doi.org/10.1051/0004-6361/202558697 [Google Scholar]
- Rosdahl, J., Blaizot, J., Aubert, D., Stranex, T., & Teyssier, R. 2013, MNRAS, 436, 2188 [Google Scholar]
- Simmonds, C., Tacchella, S., McClymont, W., et al. 2025, MNRAS, 544, 4551 [Google Scholar]
- Solimano, M., González-López, J., Aravena, M., et al. 2024, A&A, 689, A145 [NASA ADS] [CrossRef] [EDP Sciences] [Google Scholar]
- Speagle, J. S., Steinhardt, C. L., Capak, P. L., & Silverman, J. D. 2014, ApJS, 214, 15 [Google Scholar]
- Springel, V. 2010, MNRAS, 401, 791 [Google Scholar]
- Springel, V., & Hernquist, L. 2003, MNRAS, 339, 289 [Google Scholar]
- Springel, V., White, S. D., Tormen, G., & Kauffmann, G. 2001, MNRAS, 328, 726 [NASA ADS] [CrossRef] [Google Scholar]
- Springel, V., White, S. D., Jenkins, A., et al. 2005, Nature, 435, 629 [Google Scholar]
- Springel, V., Pakmor, R., Pillepich, A., et al. 2018, MNRAS, 475, 676 [Google Scholar]
- Sun, G., Muñoz, J. B., Mirocha, J., & Faucher-Giguère, C.-A. 2025, JCAP, 2025, 034 [Google Scholar]
- Tang, M., Stark, D. P., Chen, Z., et al. 2023, MNRAS, 526, 1657 [NASA ADS] [CrossRef] [Google Scholar]
- Teyssier, R. 2002, A&A, 385, 337 [CrossRef] [EDP Sciences] [Google Scholar]
- Tremonti, C. A., Heckman, T. M., Kauffmann, G., et al. 2004, ApJ, 613, 898 [Google Scholar]
- Treu, T., Roberts-Borsani, G., Bradac, M., et al. 2022, ApJ, 935, 110 [NASA ADS] [CrossRef] [Google Scholar]
- Tripodi, R., Lelli, F., Feruglio, C., et al. 2023, A&A, 671, A44 [NASA ADS] [CrossRef] [EDP Sciences] [Google Scholar]
- Venturi, G., Carniani, S., Bertola, E., et al. 2025, A&A, submitted [arXiv:2512.09996] [Google Scholar]
- Weinberger, R., Springel, V., Hernquist, L., et al. 2017, MNRAS, 465, 3291 [Google Scholar]
- Xu, Y., Ouchi, M., Yajima, H., et al. 2024, ApJ, 976, 142 [Google Scholar]
- Zamora, S., Carniani, S., Bertola, E., et al. 2025, A&A, submitted [arXiv:2512.09022] [Google Scholar]
- Zhang, Y., Ouchi, M., Nakajima, K., et al. 2024, ApJ, 970, 19 [NASA ADS] [CrossRef] [Google Scholar]
The star formation radius is defined as the radius at which half of the galaxy’s star formation rate is reached. This scale is essentially arbitrary; it only needs to ensure that the galaxy and most of its outflows are included, while not being so large as to include additional galaxies in the neighbourhood.
Here, the choice was made differently as SERRA galaxies are less diffuse, such that the rSFR sets a scale that is too small.
In our case μi = (xi, vr, SFR).
By galactic plane, we refer to the plane perpendicular to the angular momentum vector of the galaxy. Thus, this definition also includes low-mass diffuse galaxies which do not necessarily have a disc structure.
While for TNG50 σ is provided in the data release, for SERRA σ is computed by taking the square root of the variance of the velocity of the gas located within 2.5 kpc from the galactic centre.
A more detailed analysis will be presented in future work, where mock rest-frame optical lines will be generated. Some analysis of individual SERRA galaxies is presented in Kohandel et al. (2025) and Phillips et al. (2025).
Given that restricting the sample to high-mass galaxies does not significantly alter the outcome, we have not plotted this subset separately.
Appendix A: Verifying the Gaussian outflow selection
To evaluate the performance of our outflow–selection model, we applied it to a synthetic galaxy system for which the ground truth is known. We used a simplified model in which the gas in the galaxy is represented by ∼106 point-like synthetic emitting sources (hereafter referred to as particles) distributed according to a prescribed geometric configuration. For the disc component, we assumed that the particles are distributed in a thin disc following an exponential surface density profile. We adopted a scale radius of 1.5 kpc and assumed a disc height equal to one fifth of the scale radius. Each particle in the disc is assigned a 3D velocity vector composed of the expected circular velocity for an exponential disc with a dynamical mass of 1010M⊙ (Binney & Tremaine 2008; see also eq. 6 Parlanti et al. 2023) and a random velocity component of ∼50 km s−1. We adopted a bi-conical geometry for the outflow, with an opening angle of 45 degrees and an extent of 5 kpc. The particles were distributed throughout the volume of the two cones under the assumption that the average volume density of the outflowing gas decreases in the outward direction with the square of the radius. This is consistent with a scenario in which the mass outflow rate is constant with time (Lutz et al. 2020). The outflow particles were also assigned a 3D velocity vector composed of a constant radial velocity of 500 km s−1 and an additional random 3D velocity component with a magnitude of 300 km s−1.
The model galaxy used for testing is shown in Fig. A.1. It contains 106 particles representing the galactic gas and 104 particles associated with the outflow. We apply our algorithm, as described in Section 2.4, to the full gas sample. In this setup, however, we modify the definition of the galactic gas: instead of identifying it as the mode with the smallest average distances from the centre, we define it as the mode comprising particles with the lowest average flow velocities. This adjustment reflects that, in our example galaxy, the galaxy is more spatially extended than the outflow regions.
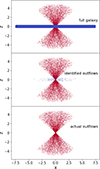 |
Fig. A.1. Test of the outflow selection algorithm. Top: Galaxy particles (blue) together with outflow particle (red), centre: particles identifies as outflows using the Gaussian mixture model approach, bottom: ground truth, that is actual outflows. |
We find that the algorithm performs robustly (see central panel of Fig. A.1), despite the large dynamic range, spanning two orders of magnitude–between galactic and outflow particles. In total, 308 particles, corresponding to 3.1% of the outflow sample, are falsely identified as galactic gas. These are typically located close to the overlapping regions between the galaxy and its outflows. Conversely, only 61 particles (0.6%) of the outflow population are missed, that is incorrectly classified as galactic. Overall, the algorithm demonstrates excellent performance in distinguishing outflows from galactic gas, even in regions such as the galactic centre where both components are strongly interwoven.
Appendix B: Contribution of TNG50 wind particles to galactic outflows
As described in Sec. 2.1, outflows from star-forming regions in the TNG50 simulation are initialised as non-interacting wind particles that propagate through the galaxy before they hydrodynamically recouple once the density falls below 0.005cm−3. This means that we miss some of the outflows that have not recoupled yet if we consider only gas particles. The goal of this appendix is to investigate the contribution of wind particles to the total outflow.
In Fig. B.1, we compare the outflow mass for galactic outflows with and without wind-particles as a function of galactic stellar mass. The plot on the left only contains the mass of the gas particles such that the contours match those in Fig. 3, while the plot on the right also includes wind particles. As one can see, the contribution of wind is negligible to the outflow mass in the galactic stellar mass range 107.5 − 108.5M⊙ encompassing the range of most galaxies observed in JADES. However, for larger galaxies, the contribution of wind particles becomes increasingly significant, raising the lower limit of the outflow masses while leaving the upper limit mostly unchanged. This indicates that in the galaxies with higher outflows, the wind-particles are typically already recoupled, while very low outflow masses tend to reflect the fact that most of the outflows have not yet recoupled rather than a physically lower value.
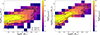 |
Fig. B.1. Distribution of the TNG50 outflow mass as a function of galactic stellar mass, without wind particles (left) and with wind particles included (right). |
Given that wind particles contribute significantly to the outflow mass, particularly in more massive galaxies, in Fig. B.2 we re-examine the correlation between outflows and SFR previously shown in Fig. 4, this time including wind particles. For galaxies with M★ ≳ 109M⊙, the correlation with SFR indeed becomes more apparent, as indicated by a clear colour gradient at fixed stellar mass. These findings support our earlier hypothesis that the apparent lack of correlation between outflow mass and SFR in higher-mass galaxies is primarily due to the most recent outflows, driven by star formation within the past 10 Myr, having not yet hydrodynamically recoupled.
 |
Fig. B.2. Median outflow mass as a function of galactic stellar mass and SFR without wind particles (left), with wind particles (centre) and only including wind particles (right). |
All Tables
All Figures
|
Fig. 1. Number of galaxies as a function of stellar mass analysed in this work. The blue and orange histograms report the distribution for TNG50 and SERRA, respectively. The shaded region indicated the mass range of galaxies observed in JADES. |
| In the text | |
|
Fig. 2. Two sample galaxies from the TNG50 (top) and SERRA (bottom) simulations shown in edge-on and face-on view together with their corresponding radial velocity maps, respectively. From top to bottom, each column shows the full projected gas of the galaxy, the fraction of gas identified as outflows, and the fraction of gas associated with the galaxy itself. |
| In the text | |
|
Fig. 3. Mass of outflowing gas as a function of galactic stellar mass, measured within a radius of 0.6″. The green contours represent the 1, 2, and 3σ distribution of SERRA galaxies, while the black contours represent the same for TNG50 galaxies. Black stars represent galaxy observations from JADES. |
| In the text | |
|
Fig. 4. Star formation rate as a function of stellar mass. The colour bar indicates the average mass of outflowing gas in each bin for the total outflowing gas of TNG50 (left) galaxies, the outflowing gas within the aperture of TNG50 galaxies (centre), and the corresponding values for SERRA galaxies (right). Overplotted stars represent galaxies observed by JADES, with their colours representing the outflow mass following the same scale as the respective panels. The dashed green and blue lines show fits based on the SFMS prescriptions of Speagle et al. (2014) and Pearson et al. (2018), respectively. |
| In the text | |
|
Fig. 5. Velocity of the 80th percentile of outflowing gas as a function of stellar mass. Velocities are measured within a radius corresponding to an observed radius of 0.6″ for TNG50 galaxies (left) and SERRA galaxies (right). The colour bar indicates the average velocity value in each bin. Stars represent galaxies observed by JADES, with colours following the same scale as the histograms. |
| In the text | |
|
Fig. 6. Ratio between the metallicity of the outflowing gas and the metallicity of the galactic gas as a function of galactic stellar mass, measured within a radius of 0.6″. The green contours represent the 1, 2, and 3 σ distribution of SERRA galaxies, while the black contours represent the same for TNG50 galaxies. |
| In the text | |
|
Fig. 7. Line-of-sight projected normalised velocity distributions for the two example TNG50 galaxies shown in Fig. 2, illustrating their respective W80 measurements for a face-on view (left) and an edge-on view (right). The corresponding W80, out/W80, gal ratio is indicated in the top-left corner of each panel. |
| In the text | |
|
Fig. 8. Top-left: Normalised distribution (PDF) of the ratios of the velocity distribution widths between the outflows (W80, out) and the galaxy (W80, gal) in TNG50 galaxies for a face-on orientation (0°) and an edge-on orientation (90°). The ratio of 1.2, indicated by the vertical line, represents minimal ratio used by JADES to separate outflows from galactic gas. Top-right: Complement cumulative distribution 1–CDF of the width ratios for various galactic orientation angles. Bottom: Same as above but limited to galaxies with M★ > 108.5 M⊙. |
| In the text | |
|
Fig. 9. Left: Distribution of the ratios of the velocity distribution widths between the outflows (W80, out) and the galaxy (W80, gal) in SERRA galaxies for a face-on orientation (0°) and an edge-on orientation (90°). The ratio of 1.2, indicated by the vertical line, represents minimal ratio used by JADES to separate outflows from galactic gas. Right: Complement cumulative distribution of the width ratios for various galactic orientation angles. |
| In the text | |
|
Fig. 10. Left: Evolution of the ratio of the outflow gas mass to galactic stellar mass for three medium-sized galaxies as a function of lookback time with the sSFR at a given snapshot depicted on the colour scale. Hereby M★, fin represents the stellar mass at the most recent time. Right: Evolution of the same ratio but on a logarithmic scale for one massive galaxy with the blue line representing the rate of black hole. |
| In the text | |
|
Fig. A.1. Test of the outflow selection algorithm. Top: Galaxy particles (blue) together with outflow particle (red), centre: particles identifies as outflows using the Gaussian mixture model approach, bottom: ground truth, that is actual outflows. |
| In the text | |
|
Fig. B.1. Distribution of the TNG50 outflow mass as a function of galactic stellar mass, without wind particles (left) and with wind particles included (right). |
| In the text | |
|
Fig. B.2. Median outflow mass as a function of galactic stellar mass and SFR without wind particles (left), with wind particles (centre) and only including wind particles (right). |
| In the text | |
Current usage metrics show cumulative count of Article Views (full-text article views including HTML views, PDF and ePub downloads, according to the available data) and Abstracts Views on Vision4Press platform.
Data correspond to usage on the plateform after 2015. The current usage metrics is available 48-96 hours after online publication and is updated daily on week days.
Initial download of the metrics may take a while.