| Issue |
A&A
Volume 708, April 2026
|
|
|---|---|---|
| Article Number | A305 | |
| Number of page(s) | 13 | |
| Section | Extragalactic astronomy | |
| DOI | https://doi.org/10.1051/0004-6361/202558378 | |
| Published online | 17 April 2026 | |
The broad-lined type Ic supernova 2020lao experienced an energetic explosion with no central-engine signatures
1
Department of Physics and Astronomy, Chalmers University of Technology, SE-412 96 Göteborg, Sweden
2
Department of Physics and Astronomy, Aarhus University, Ny Munkegade 120, DK-8000 Aarhus C, Denmark
3
National Astronomical Observatory of Japan, National Institutes of Natural Sciences, 2-21-1 Osawa, Mitaka, Tokyo 181-8588, Japan
4
Graduate Institute for Advanced Studies, SOKENDAI, 2-21-1 Osawa, Mitaka, Tokyo 181-8588, Japan
5
School of Physics and Astronomy, Monash University, Clayton, VIC 3800, Australia
6
Astrophysics Research Institute, Liverpool John Moores University, IC2, Liverpool Science Park, 146 Brownlow Hill, Liverpool L3 5RF, UK
7
Max-Planck-Institut für Astrophysik, Karl-Schwarzschild-Str. 1, 85741 Garching bei München, Germany
8
The Oskar Klein Centre, Department of Astronomy, Stockholm University, AlbaNova 10691, Stockholm, Sweden
9
Institute for Astronomy, University of Hawai’i, 2680 Woodlawn Drive, Honolulu, HI 96822, USA
10
Institut d’Estudis Espacials de Catalunya (IEEC), E-08034 Barcelona, Spain
11
Institute of Space Sciences (ICE, CSIC), Campus UAB, Carrer de Can Magrans, s/n, E-08193 Barcelona, Spain
12
Planetary Science Institute, 1700 East Fort Lowell Road, Suite 106 Tucson, AZ 85719-2395, USA
13
Space Telescope Science Institute, 3700 San Martin Drive, Baltimore, MD 21218-2410, USA
14
INAF – Osservatorio Astronomico di Padova, Vicolo dell’Osservatorio 5, I-35122 Padova, Italy
15
Department of Physics, Florida State University, 77 Chieftain Way, Tallahassee, FL 32306, USA
16
INAF – Astrophysics and Space Science Observatory, Via P. Gobetti 101, 40129 Bologna, Italy
17
School of Physics and Astronomy, University of Leicester, University Road, Leicester LE1 7RH, UK
★ Corresponding author: This email address is being protected from spambots. You need JavaScript enabled to view it.
Received:
3
December
2025
Accepted:
7
March
2026
Abstract
We present infant-phase observations of the broad-line Type Ic supernova (SN Ic-BL) 2020lao, including optical spectroscopy beginning within about 48 hours of the inferred explosion epoch and extending to nearly 100 days. The explosion time was constrained by power-law fits to the rising TESS and ZTF light curves, with the first ZTF detection occurring only ∼27 hours after explosion. The optical light curves show a rapid rise that lasted for ≈8.8 days and a peak luminosity typical of SNe Ic-BL (i.e., Mr ≃ −18.5 mag). Unlike some engine-driven SN Ic-BL events, the early light curve of SN 2020lao shows no evidence of an optical afterglow or excess emission, and the absence of any detectable shock–cooling component in the TESS and ZTF data constrains the progenitor to a compact Wolf-Rayet-like star whose R★ is less than or equal to a few times the R⊙, ruling out any extended envelope. The spectra resemble those of the X-ray-flash-associated SN 2006aj but with systematically higher expansion velocities. From Arnett-type fits to the bolometric light curve and measured Fe IIλ5169 line velocities, we infer a 56Ni mass of 0.23 ± 0.03 M⊙, an ejecta mass (Mej) of 3.2 ± 0.8 M⊙, and a kinetic energy (EK) of ∼(23.1 ± 12.4)×1051 erg, corresponding to a specific kinetic energy (EK/Mej) of ≈(7.2 ± 3.5)×1051 erg M⊙−1. Spectral synthesis modeling broadly reproduces the photospheric-phase spectra of SN 2020lao and suggests EK/Mej ≈ 4.9 × 1051 erg M⊙−1. SN 2020lao and SN 2006aj synthesized comparable amounts of 56Ni, yet SN 2020lao exhibits EK/Mej values on the order of 5–10 times larger. Published VLA and Swift/XRT non-detections reveal no afterglow emission, allowing us to place stringent limits on relativistic ejecta and dense circumstellar material. Given that SN 2020lao reaches a specific kinetic energy typical of engine-driven SNe Ic-BL, the lack of an early optical excess together with the non-detections in the radio and X-ray bands suggests that if a relativistic jet was launched, the explosion must have been viewed far off axis or the jet was choked before breakout. If there was no relativistic jet, SN 2020lao would therefore be an extreme nonrelativistic SN Ic-BL. This underscores the importance of continued infant-phase, multiwavelength monitoring of these explosions.
Key words: radiative transfer / gamma-ray burst: general / supernovae: general / supernovae: individual: SN 2020lao
© The Authors 2026
 Open Access article, published by EDP Sciences, under the terms of the Creative Commons Attribution License (https://creativecommons.org/licenses/by/4.0), which permits unrestricted use, distribution, and reproduction in any medium, provided the original work is properly cited.
This article is published in open access under the Subscribe to Open model. This email address is being protected from spambots. You need JavaScript enabled to view it. to support open access publication.
1. Introduction
Historically, the earliest discoveries of exploding stars depended on the detection of high-energy emissions associated with long-duration gamma-ray bursts (GRBs) and X-ray flashes (XRFs; Galama et al. 1998; Campana et al. 2006; Pian et al. 2006; Soderberg et al. 2006; Ashall et al. 2019). Follow-up observations of such objects can capture an optical and/or radio afterglow accompanied by the emergence of broad-line Type Ic supernovae (hereafter SNe Ic-BL; Kulkarni et al. 1998; Patat et al. 2001; Soderberg et al. 2006). Some of these events are thought to be powered by a central engine, originally proposed in the collapsar framework (Woosley 1993; MacFadyen & Woosley 1999; Woosley 2002) and more recently in magnetar-driven models (Mazzali et al. 2014; Metzger et al. 2015; Suzuki & Maeda 2018; Piro & Morozova 2019), where the collapse of a massive star leaves behind a compact remnant that drives relativistic jets and injects energy into the ejecta. In recent years, an increasing number of SNe Ic-BL have been discovered through optical transient surveys rather than high-energy emissions (e.g., Anand et al. 2024). It remains uncertain whether these events produced high-energy emission that went undetected because of observational limitations or unfavorable viewing angles (e.g., MacFadyen & Woosley 1999; Tanaka et al. 2007; Mazzali et al. 2005) or arose from a distinct mechanism such as a “choked” jet in which the central engine fails to drive a relativistic outflow through the progenitor star (e.g., Irwin et al. 2019; MacFadyen et al. 2001; Ramirez-Ruiz et al. 2002; Lazzati et al. 2012; Piran et al. 2019), or if they instead reflect a fundamentally nonrelativistic explosion.
The advent of robotic telescopes with high-cadence, all-sky imaging capabilities, combined with machine learning techniques for near-real-time transient identification, has ushered in an era where supernova (SN) discovery rates have soared to thousands per year, with an increasing number detected within hours to a day after the time of the explosion (hereafter, texp). For example, the Automated Learning for the Rapid Classification of Events (ALeRCE) identified ZTF20abbplei (hereafter SN 2020lao) within public stream Zwicky Transient Facility (ZTF; Bellm et al. 2019) images taken 2020 May 25.41 UT (i.e., JD 2458994.91; Forster et al. 2020). As there were already a handful of previous ZTF non-detections, the source was flagged as a rising SN candidate. A week after discovery, Burke et al. (2020) reported the candidate to be a bona fide SN Ic-BL.
SN 2020lao was fortuitously located within the Transiting Exoplanet Survey Satellite (TESS) footprint, with observations covering its position prior to discovery. The full TESS light curve was presented by Vallely et al. (2021), who inferred a texp of 2020 May 25.13 UT (i.e., JD 2458994.63 ± 0.06). More recently, Anand et al. (2024) estimated a texp of JD 2458993.57 ± 0.75 based on power-law fits to the early ZTF g- and r-band photometry. A reexamination of these datasets (see below) yields a texp value a day earlier, that is, on JD  , which is adopted throughout this work.
In this study we analyzed optical broadband photometry and spectroscopy of SN 2020lao beginning within 48 hours of texp. This constitutes a rare dataset of an infant SN Ic-BL that showed no evidence of high-energy or radio emission (Corsi et al. 2023; Anand et al. 2024) and no associated optical afterglow component (Burke et al. 2020). To verify these absences, we searched archival high-energy transient catalogs over a broad time window around the inferred explosion epoch and found no reported GRB or X-ray transient spatially and temporally coincident with SN 2020lao. Despite the lack of such high-energy signatures, its light curve shape, luminosity, and spectra closely resemble those of the XRF-associated SN 2006aj (XRF 060218; Mazzali et al. 2006; Pian et al. 2006; Sollerman et al. 2006), albeit with spectral lines suggesting an even more energetic explosion. These similarities, together with the absence of clear engine-driven signatures, raise the question of whether SN 2020lao is related to a GRB viewed off-axis, the outcome of a choked jet, or instead a purely nonrelativistic explosion.
2. Distance, reddening, and host properties
With J2000 coordinates RA = 17h06m54s.602 and Dec  , SN 2020lao occurred within the face-on, barred spiral galaxy CGCG 169-041 (see Fig. 1). The NASA/IPAC Extragalactic Database (NED) reports a heliocentric redshift of z = 0.031162 ± 0.000117 (e.g., Marzke et al. 1996). Correcting for the Virgo Cluster, Great Attractor, and Shapley supercluster peculiar velocity model (Mould et al. 2000) yields a redshift of z = 0.03245. Using cosmological parameters Ωm = 0.27, ΩΛ = 0.73 (Komatsu et al. 2009), and H0 = 73.30 ± 1.04 km s−1 Mpc−1 (Riess et al. 2022), this adjusted redshift corresponds to the adopted luminosity distance of 132.7 ± 9.3 Mpc, or μ = 35.61 ± 0.15 mag.
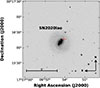 |
Fig. 1. An r-band image from the NOT showing the position of SN 2020lao within its host galaxy, CGCG 169-041. |
The Milky Way (MW) reddening in the direction of SN 2020lao is E(B − V)MW = 0.044 mag (Schlafly & Finkbeiner 2011). The host-galaxy reddening appears to be minimal, as indicated by the absence of Na I D in the optical spectra and the post-maximum optical colors (see Sect. 4.2).
We obtained host-galaxy properties through the Blast website (Jones et al. 2024)1. Blast estimates galaxy properties through spectral energy distribution (SED) fitting implemented using the Prospector-α model with a nonparametric star formation history (Leja et al. 2019; Johnson et al. 2021; Wang et al. 2023; see also Appendix A in Jones et al. 2024 for more information). The fitted data include photometry from the Two Micron All Sky Survey (Skrutskie et al. 2006), the Wide-field Infrared Survey Explorer (Wright et al. 2010), the Sloan Digital Sky Survey (SDSS; Fukugita et al. 1996; York et al. 2000), and the Panoramic Survey Telescope and Rapid Response System (Chambers et al. 2016) using point-spread-function-matched elliptical apertures.
We find the following properties for CGCG 169-041: a stellar mass of  , a star formation rate of
  , a specific star formation rate of
  , and a mass-weighted mean stellar age
  Gyr. These are consistent with CGCG 169-041 being a young, massive, highly star-forming galaxy.
3. Observations
Imaging data were collected with the Nordic Optical Telescope (NOT) by the NOT Unbiased Transient (NUTS2)2 collaboration, supplemented with imaging obtained with the Las Cumbres Observatory Global Network (LCOGT), and the Liverpool Telescope (LT). Imaging data were reduced following standard procedures. NOT images were processed using the ALFOSCGUI pipeline3, LCOGT images were retrieved from the LCOGT science archive reduced using the BANZI pipeline, while fully reduced images were retrieved from the observatory’s data products archive.
Before computing photometry, host-template subtraction was performed on all science images using IMAGEMATCH4. Templates were created by stacking multiple archival LCOGT images from 2014. Point-spread function photometry was then measured using the Aarhus-Barcelona peculiar velocity FLOWS project’s photometry pipeline5, which employs the effective point-spread-function methodology of Anderson & King (2000). Calibration was carried out using nightly zero points, determined by comparing the instrumental photometry of field stars with standard catalog magnitudes from REFCAT2 (Tonry et al. 2018).
Our focused observations are combined with observations obtained by ZTF. ZTF g- and r-band photometry was obtained using the ZTF forced photometry service, with careful implementation of a baseline correction (see Shingles et al. 2021 for details). Overall, particularly during the earliest phases and through maximum light, the ZTF photometry shows good agreement with measurements computed from our own resources. The broadband light curves of SN 2020lao are shown in Fig. 2.
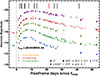 |
Fig. 2. Optical BgVri-band light curves of SN 2020lao, corrected for reddening and vertically offset by arbitrary constants for clarity. The previous ATLAS o-band non-detection limit (orange triangle), obtained −0.34 days prior to texp (vertical dashed line), is plotted alongside the r-band light curve. ZTF non-detection limits are included. Segments at the top mark the phases when optical (black) and NIR (red) spectroscopy were obtained (see Table A.1). |
During our campaign, we obtained thirteen epochs of optical spectroscopy covering a period from +2.0 to +95.9 days after texp (see Table A.1), including five spectra within the first six days, the earliest of which was published by Galbany et al. (2025). Our first and last two spectra were obtained with the 10.4-m Gran Telescopio Canarias (GTC + OSIRIS), while the others were taken with the 2.56-m NOT (+ ALFOSC), the 2-m LT (+ SPRAT), the LCOGT 2-m Faulkes telescope (+ FLOYDS), and the 3.5-m Apache Point Telescope (APO) equipped with the Dual Imaging Spectrograph (DIS). The data were reduced following standard procedures (see Hamuy et al. 2006), and the extracted 1D spectra were color-corrected to match the observed broadband colors of SN 2020lao. A single near-infrared (NIR) spectrum was also obtained at +21.5 days with the NASA Infrared Telescope Facility (IRTF; +SpeX, Rayner et al. 2003). These data were reduced, calibrated, and telluric corrected following standard SpeXtool procedures with the telluric corrections accomplished using a spectrum of an A0V star Cushing et al. (2004), Hsiao et al. (2019). The spectroscopic sequence of SN 2020lao is plotted in Fig. 36.
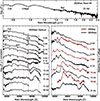 |
Fig. 3. Spectroscopic observations of SN 2020lao. Top: NIR +21.5 days spectrum of SN 2020lao. Left: selected optical spectra of SN 2020lao, corrected for MW reddening and overplotted with a smoothed version. Regions affected by three prevalent telluric features are indicated with vertical gray bands and labeled with Earth symbols. The locations of the absorption minima used to infer the expansion velocities plotted in Fig. 6 are marked with black dots, with red error bars indicating the wavelength ranges that define the associated uncertainties in the positions of maximum absorption. Right: comparison between similar epoch spectra of SN 2020lao and SN 2006aj (Pian et al. 2006; Sonbas et al. 2008). |
4. Analysis
4.1. Early photometry and estimating the explosion epoch
We used the ZTF forced photometry service (Masci et al. 2019) to measure the brightness of SN 2020lao in the ZTF public data stream. The results include a visually confirmed recovered r-band detection from the image previously used to compute the original ALeRCE-reported non-detection (Forster et al. 2020). The most constraining ZTF non-detections now come from r- and g-band images obtained 0.80 and 0.78 days before our revised TESS texp, which set limiting magnitudes of mr > 20.0 and mg > 20.2, respectively. Making use of The ATLAS Project’s forced photometry service (Smith et al. 2020; Shingles et al. 2021), an even more stringent 5-sigma limiting magnitude of mo > 20.5 mag is measured from a single o-band image taken on −0.34 days (i.e., JD 2458993.99). Given the approximately one-day discrepancy between the texp values computed from the TESS (Vallely et al. 2021) and the ZTF (Anand et al. 2024) datasets of SN 2020lao, and our recovered r-band detection, we revisited the estimate of texp.
To this end, Fig. 4 shows the observer-frame TESS light curve of SN 2020lao, along with a single power-law fit to the data spanning the range JD 2458989.13 to JD 2458998.63, after which the light curve shows a prominent break and deviates from a power-law profile. The best-fit model yields a power-law index of α = 1.50 ± 0.01 and an explosion epoch of texp= JD  . This value precedes the estimate from Vallely et al. (2021), who inferred texp= JD 2458994.63 using a different fitting methodology, by 0.96 rest-frame days. Inspection of the TESS light curve (see Fig. 4) shows that at the epoch inferred by Vallely et al. (2021), the flux is already significantly above the pre-explosion baseline, exceeding the local background by approximately 2.5σ and indicating that the SN was already rising at that time. We therefore conclude that this later value does not correspond to the true explosion epoch. Our adopted value of texp= JD
  is consistent with both the ZTF non-detections and the onset of the rise observed in the TESS light curve.
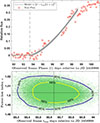 |
Fig. 4. Top panel: binned TESS light curve adopting a bin size of two hours and plotted vs. phase relative to JD 2458900. Over-plotted is our best-fit power law. Bottom panel: 2D probability density of the MCMC sample between the fit parameters – time of explosion, texp, and power-law index, α. The contours correspond to 68% and 95% confidence intervals. The solid intersecting black lines indicate the mean of the MCMC sample for parameters |

We also applied the same fitting methodology to the ZTF r-band photometry and extended it to JD 2458999.13, which yields texp= JD  . This value is in agreement with the JD 2458993.57 ± 0.75 value reported by Anand et al. (2024).
A summary of all non-detections, detections, recovered detections, and Δtexp estimates of their corresponding observational dates relative to our revised texp estimate is provided in Table 1. Finally, we note that with our revised TESS texp value and the recovered ZTF r-band detection, the earliest ground-based detection of SN 2020lao occurred ≈27 hours after texp.
Discovery information.
4.2. Broadband light curves
The light curves of SN 2020lao plotted in Fig. 2 exhibit a bell-shaped profile typical of stripped-envelope (SE) SNe and are characterized by relatively short rise times (trise) to peak. Furthermore, the early light curve evolution shows no evidence of early excess emission, which could be linked to either post-shock breakout cooling or afterglow emission associated with central engine activity. Gaussian process spline fits were used to determine the peak light curve parameters (i.e., time of peak, apparent magnitude at peak, and trise), which are summarized in Table 2. The trise values range between +8.5 days and +11.7 days. In context, they are similar to the rise time of SN 2006aj (e.g., Sollerman et al. 2006), as well as the average SDSS-II SN Ic sample (trise ≈ 11.5 ± 0.5 days). However, the values are somewhat shorter than the averages reported for the SDSS-II SN Ic-BL (trise ≈ 14.7 ± 0.2 days; Taddia et al. 2015) and the intermediate Palomar Transient Factory (iPTF) SN Ic-BL (trise ≈ 15 ± 6 days; Taddia et al. 2019) samples.
Peak light curve parameters and rise times.
Figure 5 presents the interpolated optical broadband colors of SN 2020lao, corrected for Galactic extinction, and plotted alongside the intrinsic color-curve SN Ic templates from Stritzinger et al. (2018). The colors initially transition rapidly from red to blue as the SN nears peak brightness. This is followed by a gradual shift back to red colors as the ejecta expand, cool, and the photosphere recedes into progressively deeper layers. The color excess values shown in each panel of Fig. 5 correspond to the average difference between the MW-corrected observed colors and the intrinsic template curves. Fitting these four color excess values simultaneously with the Fitzpatrick (1999) reddening law, and assuming a host-galaxy total-to-selective reddening parameter of RVhost = 3.1, suggests that SN 2020lao suffers minimal host reddening.
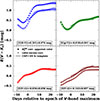 |
Fig. 5. MW reddening-corrected apparent colors of SN 2020lao (filled points) derived from Gaussian process interpolations of the observed light curves. Solid lines represent intrinsic SN Ic color-curve templates (Stritzinger et al. 2018), while open points show the corrected color curves after adjusting for the average offset between the apparent colors and the templates. The colors of SN 2020lao indicate that it experienced minimal host-galaxy reddening. |
Accounting for Galactic reddening and assuming μ = 35.6 mag, the peak r-band apparent magnitude of SN 2020lao corresponds to Mr = −18.52 ± 0.34 mag (see Table 2). This value is in agreement with the average value Mr ∼ −18.6 ± 0.5 mag computed from the iPTF sample of three dozen SNe Ic-BL (Taddia et al. 2019).
4.3. Spectroscopy
The subset of our spectroscopic time series presented in the left panel of Fig. 3 spans from +2 to +97 days relative to texp. The time series consists of an early high-cadence sequence, with six spectra obtained within the first week. The spectra are characterized by a relatively blue continuum, with the first spectrum well fit by a Planck function with a blackbody temperature of 8000 K. Superposed on the continua of the earliest spectra are several broad absorption troughs, initially centered near 3900 Å, 4200 Å, 4500 Å, 5500 Å, and 7500 Å. These features, labeled in Fig. 3, are attributed to Ca II H&K λ3945, Mg IIλ4481, Fe II multiplet 42, and the Ca IIλλ8498, 8542, 8662 NIR triplet, while the trough near 5500 Å, first seen in the +5.3 day spectrum, is tentatively associated with Si IIλ6355. As the spectra evolve, the pseudo–equivalent width of the Ca II NIR triplet increases markedly between +8.1 and +13.4 days and remains prominent at later epochs.
Attributing the 4300–4500 Å absorption feature in the earliest spectra of SN 2020lao to Fe II λ5169, the expansion velocity from the position of maximum absorption (−vabs) is inferred using the relativistic Doppler formula. From the minimum of the feature in the +2 days spectrum, this yields −vabs(Fe II λ5169) ≈53 600 ± 3900 (random) ±8000 (systematic) km s−1. The velocity decreases to ≈22 800 ± 4950 (random) ± 8000 (systematc) km s−1 by +27 days. The adopted value of 8000 km s−1 for the systematic uncertainty reflects the effects of line blending, trough identification, and uncertainties associated with the choice of reference wavelength for the Fe II multiplet 42. Although the absorption feature near 5000 Å may include contributions from the λλ4924, 5018, and 5169 components (see Branch et al. 2002), it is more commonplace in the literature to adopt λ5169 as the rest wavelength when measuring photospheric velocities in SNe Ic-BL (e.g., Modjaz et al. 2016; Taddia et al. 2019; Williamson et al. 2023; Finneran et al. 2025). If instead λ5018 were adopted as the reference wavelength, the inferred values of −vabs(Fe II) would be systematically lower by ≈8000 km s−1, comparable to the magnitude of the adopted systematic term (see Prentice & Mazzali 2017). Fitting a power-law function to the −vabs(Fe IIλ5169) evolution and evaluating the fit at the time of peak luminosity (Lmax), we infer −vabs(Fe II λ5169) ≈ 34800 ± 2300 (random) ± 8000 (systematic) km s−1. This value is adopted below to estimate the specific energy of SN 2020lao.
Figure 6 shows the evolution of −vabs(Fe II), together with the corresponding −vabs(Si II) and −vabs(Ca II), as measured from the minima of the absorption features highlighted in the left panel of Fig. 3. If correctly identified as Si II, the feature implies pre-maximum velocities lower than those from Fe II; later, more reliable identifications yield velocities comparable to both the Fe II and the Ca II NIR triplet features.
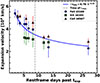 |
Fig. 6. Doppler velocity evolution as measured from the position of maximum absorption for Fe IIλ5169, Si IIλ6355, and Ca IIλ8567. |
The single NIR spectrum of SN 2020lao, spanning 7000–25 000 Å and shown at the top of Fig. 3, is dominated at shorter wavelengths by two broad absorption features. These include the Ca II NIR triplet, also present in the optical spectra, and a prominent feature with an absorption minimum near ≈1.0 μm, likely formed by C Iλ1.0693 μm with possible contributions from He Iλ1.0830 μm and O Iλ1.1290 μm. The Doppler velocity derived from the Ca II minimum is consistent with the velocity evolution measured from the optical spectra. A third prominent feature in the spectrum, peaking just blueward of 1.6 μm, is likely formed by the blending of Mg Iλ1.4878 μm and Mg Iλ1.5033 μm. Beyond the main spectral features, numerous weaker absorption lines can be identified across the spectrum, in agreement with the line identifications reported for SN 2013ak by Shahbandeh et al. (2022). Finally, the absence of the He I λ2.0581 μm feature in the NIR spectrum further supports the classification of SN 2020lao as a He-poor SE SN.
5. Discussion
5.1. Estimating the explosion parameters of SN 2020lao
5.1.1. Bolometric light curve and Arnett-model fits
Explosion parameters were estimated by fitting the pseudo-bolometric light curve of SN 2020lao with the analytical model of Arnett (1982). The pseudo-bolometric light curve was constructed using the Python package superbol (Nicholl 2018). As a first step, the broadband light curves were fit with polynomial functions, which were used to generate interpolated photometry at epochs with missing coverage in the reference band (chosen to be the r band). The photometry was corrected for MW reddening and then converted to flux. Next, observed SEDs were constructed for each epoch r-band photometry was obtained, and a blackbody function was fit to each of the observed SEDs. The resulting blackbody fits were integrated over wavelength to obtain the ultraviolet, optical, and infrared (UVOIR) flux, which was converted to luminosity using the adopted distance to the host galaxy. The resulting pseudo-bolometric light curve is shown in Fig. 7, where the associated error bars account integration error.
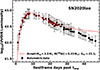 |
Fig. 7. Arnett (1982) model fit to the bolometric light curve of SN 2020lao constructed by integrating blackbody functions matched to the observed SEDs. Explosion parameters derived from the fit, with EK inferred from the EK/Mej relation of Wheeler et al. (2015), are provided. |
To estimate the 56Ni abundance powering the emission of SN 2020lao and the ejecta mass (Mej) of SN 2020lao a Arnett (1982)-like analytical model presented by Cano (2013, see their Eq. (1)), was fit to the UVOIR light curve, while the explosion energy (EK) was inferred making use of relation  (Wheeler et al. 2015)7 Although this analytical method relies on simplifying assumptions including spherical symmetry, homologous expansion with a fixed density profile (Taddia et al. 2018), centrally concentrated 56Ni, and constant optical opacity (κ), it provides a practical baseline for comparison with larger SE SN samples (e.g., Drout et al. 2011; Lyman et al. 2016; Prentice & Mazzali 2017; Taddia et al. 2019) and with results from more sophisticated modeling approaches (e.g., Taddia et al. 2018).
The Arnett model fit to the UVOIR bolometric light curve over the first ∼25 days is shown in Fig. 7, adopting a constant opacity of κ = 0.07 cm2 g−1 (Chugai 2000). The best-fit model yields a rise time of trise = 8.8 days and a peak luminosity of log10(Lmax) = 42.913, corresponding to a synthesized 56Ni mass of 0.23 ± 0.03 M⊙ after accounting for uncertainties in both the light-curve fit and the adopted distance. The inferred ejecta mass is Mej = 3.2 ± 0.8 M⊙, with an uncertainty reflecting contributions from the peak photospheric velocity and the fitting procedure.
As detailed in Sect. 4.3, the photospheric velocity at peak light, vph ≃ 34 800 ± 2300 (random) ± 8000 (systematic) km s−1, is obtained from a power-law fit inferred from the position of the at maximum absorption and assuming a reference wavelength of Fe IIλ5169 (Fig. 6). Using this velocity together with the specific kinetic energy relation from Wheeler et al. (2015, their Eq. (3),  ), we infer EK/Mej = (7.2 ± 3.5)×1051 erg M⊙−1. Substituting the Arnett-model fit inferred Mej yields an EK ≃ (23.1 ± 12.4)×1051 erg, where the quoted uncertainty includes the errors in both vph and Mej.
We emphasize that the EK and Mej parameters depend on the assumption of a constant opacity, κ. As demonstrated by Taddia et al. (2018), this approximation is accompanied with systematic uncertainty for SE SNe: varying κ across a plausible range (0.05–0.15 cm2 g−1) can change the inferred Mej and EK by factors of ∼2. The reported values of Mej and EK based on Arnett model fitting should be interpreted with this inherent, model-dependent uncertainty in mind.
5.1.2. SN 2020lao in the context of the SN Ic-BL paradigm and spectral synthesis
As a starting point, we must set aside the overly simplistic view that all SNe Ic-BL are spectroscopically equivalent. In practice, the amount of line blending spans a wide range from a few thousand to several tens of thousands of km s−1, yielding strikingly different spectral characteristics, as demonstrated by Prentice et al. (2016). These authors suggested a very simple classification scheme for SNe Ic, based simply on the number of spectral features observed near maximum light in the range 4000–7500 Å. The number of features shown by SNe Ic in this portion of the optical spectrum ranges from n = 7 in what we could call “narrow-line” objects to as few as n = 3 for the very SNe Ic BL associated with GRBs. However, it is customary to call all SNe Ic with n < 7 “broad-lined,” which is not very precise. A smaller value of n typically indicates a larger EK/Mej ratio, although even this assumption does not fully describe the range of possibilities. In fact, the value of n crucially depends on the density slope in the line-forming layers. For example, SN 1998bw has n = 3, and so do all well-observed GRB-associated SNe Ic-BL, but the XRF SN 2006aj has n = 6, and blending only affects the Fe II multiplet 42 lines. Fewer features means that the line-forming region spreads over a larger range of velocities, such that some material reaches high enough velocities that lines formed there can appear blueshifted and blend with the next strong line located at adjacent blue wavelengths. As the separation in velocity between the various features is not constant, ejecta reaching progressively larger velocities show a higher degree of feature blending. It takes ejecta of vph ∼ 30 000 km s−1 to blend the Ca II NIR triplet with O Iλ7774, feature such that only three major features are observed in known GRB-associated SNe Ic-BL.
Furthermore, Mazzali et al. (2017) discussed at length how the structure of the outer layers influences the spectral appearance. In particular, a different density slope in the outer layers has a significant impact on the appearance of the early spectra, including the number of lines. A flatter density distribution (ρ(v)) leads to broader lines, and therefore a lower value of n. The value of n can also change with time as the line-forming region recedes to inner layers of the ejecta. Alternatively, an increase in mass that is not accompanied by a flattening of ρ(v) produces a “fast-lined” spectrum, in which the intrinsic line widths remain unchanged but the blueshifts of the features become larger.
This is apparently the case for SN 2020lao, which could therefore be called a “fast-lined” SN Ic-6, rather than just, generically, a SN Ic-BL. A similar case was that of PTF12gzk (Ben-Ami et al. 2012), when compared, for example, to SN 2004aw (Taubenberger et al. 2006).
These considerations are important when one tries to “rescale” an explosion model (i.e., a density structure) used for a particular SN based on its light curve and spectra to match the properties of another SN. As explained in Mazzali et al. (2017), this should be attempted only for SNe that look rather similar. In the particular case of SN 2020lao, the light curve evolves similarly to that of SN 2006aj, also as we discuss below, achieves a similar peak luminosity, while the spectra are similar in shape to those of SN 2006aj but with features exhibiting much higher velocities. This clearly calls not for a simultaneous increase in both Mej and EK via a flattening of the outer layers, which is the trend that characterizes SNe-Ic with progressively smaller n values and translates into two separate contributions to EK, but only for a shifting of the line-forming region to higher velocities, starting from the model used for SN 2006aj. The steeply declining density of the outer ejecta that characterize the model should be preserved in order not to change the blending of the spectral features. Actually, this is basically the assumption of the popular Arnett approach (Arnett 1982).
Although the spectra of SN 2020lao are morphologically similar to those of SN 2006aj, the lines in SN 2020lao are systematically faster. The light curves are also very similar (see below), apart from a modest difference in luminosity. At the time of Lmax, the position of the Fe IIλ5169 absorption minimum in SN 2020lao indicates −vabs(Fe II λ5169) ≈ 34800 km s−1, while in the case of SN 2006aj, Maund et al. (2007) reported a substantially lower value of −vabs(Fe II λ5169) ≈ 18500 ± 3000 km s−1 (see also Lyman et al. 2016).
This comparison suggests that a suitably rescaled version of the explosion model used for SN 2006aj can account for SN 2020lao, provided that the steeply declining outer ejecta are located approximately 10 000 km s−1 farther out. This requirement implies that SN 2020lao has both a larger EK and a larger Mej, but not a flatter density (ρ(v)) profile in the outer layers. Using a simple Arnett-type rescaling and directly comparing the properties of the two SNe Ic-BL, and assuming that the opacity is the same in the two objects rather than estimating the actual time- and depth-dependent opacity, we infer approximate values for SN 2020lao of Mej ≈ 3.5 M⊙ and EK ≈ 17 × 1051 erg.
Spectral modeling was performed on three spectra of SN 2020lao, which enabled us to assess whether the previously estimated properties of the SN are consistent with its observed spectral features. To this end, a 1D Monte Carlo radiative-transfer code developed by Mazzali & Lucy (1993), Lucy (1999), and Mazzali (2000) was employed. The code has previously been used to analyze the spectra of both thermonuclear and core-collapse SNe, including among others, the SNe Ic-BL 2006aj (Mazzali et al. 2006) and 2016jca (Ashall et al. 2019). The method is particularly well suited for generating synthetic spectra during the photospheric phase, when the inner ejecta are optically thick and a well-defined photosphere exists. Assuming that the photosphere emits a blackbody spectrum, the spectral synthesis code releases photon packets from the photosphere and computes their subsequent propagation through the SN ejecta. The code requires as input the density structure, abundances, the location of the photosphere, and the bolometric luminosity.
In this work, a uniform abundance distribution is assumed with a composition of 82% oxygen, 16% neon, 2% silicon, and 0.2% carbon. This composition is consistent with that of the carbon–oxygen layers in massive stars (e.g., Woosley et al. 2002). Additional notably trace elements in the ejecta include 0.8% magnesium, and 0.0005% calcium. Motivated by the spectroscopic similarity between SN 2020lao and SN 2006aj (see Fig. 3, right), we adopted the ρ(v) used in the spectral modeling of SN 2006aj (Mazzali et al. 2006), scaled appropriately to compute synthetic spectra for SN 2020lao. A discussion of the uncertainties associated with this approach can be found in Ashall & Mazzali (2020). The bolometric luminosity of SN 2020lao was taken from the Arnett-model results presented in Sect. 5.1.1.
Figure 8 shows the comparison between the observed spectra of SN 2020lao at +8.1, +11.8, and +13.4 days and the corresponding synthetic spectra computed for EK/Mej = 4.9 × 1051 erg  and photospheric velocities of 28 000, 23 000, and 21 000 km s−1, respectively, with uncertainties on the order of up to 10%. Overall, the observed spectra are reasonably well reproduced, with all major absorption complexes present in the models. The most notable discrepancy is the broad feature between 7000 and 8000 Å in the later spectrum where the synthetic spectra show a more pronounced blend of O Iλ7773 and the Ca II NIR triplet than is seen in the observations. This discrepancy may stem from the assumption of a uniform abundance distribution, or the fact that the underlying ejecta may be aspherical.
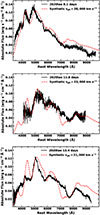 |
Fig. 8. Synthetic spectra from a model with Mej = 3.5 M⊙ and EK = 17 × 1051 erg compared to observed spectra of SN 2020lao at +8.1 (top), +11.8 (middle), and +13.4 days (bottom) past explosion. |
Having established the overall spectral agreement, we turned to the vph values inferred from the spectral modeling. A least-squares linear fit to the model-derived velocities allowed us to estimate the photospheric velocity at the time of Lmax. The extrapolated value is vph = 27 000 km s−1, which is ∼7000 km s−1 lower than the −vabs(Fe II λ5169) estimate, although still consistent within the adopted uncertainties (see Sect. 4.3).
With an estimate of vph in hand, we proceeded to compare the synthetic spectrum inferences of SN 2020lao for EK and EK/Mej to those inferred in Sect. 5.1.1, based on a combination of the Arnett-model fit, our estimate of −vabs(Fe II λ5169), and the relation  . We find that this method provides EK and EK/Mej values that are ≈36% and 47% larger, respectively.
Finally, to place these results in context, we compared our inferred explosion parameters of SN 2020lao to those of SN 2006aj. Arnett model fits to the bolometric light curves of both objects indicate that they synthesized approximately 0.2 M⊙ of 56Ni (Mazzali et al. 2006; Cano 2013). Spectral synthesis modeling of SN 2006aj suggests vph = 18 000 km s−1 (comparable to the value inferred from its maximum light spectra, i.e., −vabs(Fe II λ5169) ≈ 18500 km s−1; Maund et al. 2007), EK = 2 × 1051 erg, Mej = 2 M⊙, and hence EK/Mej = 1 × 1051 erg  . These parameter values are all lower than those inferred from our spectral model fits of SN 2020lao, as well as the even higher values inferred from the Arnett model fitting and the EK/Mej relation of Wheeler et al. (2015). Quantitatively, our inferred range of EK/Mej values for SN 2020lao is on the order of 5–10 times larger than that of SN 2006aj. In conclusion, we emphasize that the results from the spectral synthesis models rest on a number of underlying assumptions, several of which may no longer hold if the ejecta of SN 2020lao are significantly aspherical.
5.2. Constraint on the progenitor’s radius
The early TESS and ZTF light curves also allowed us to constrain the progenitor radius. To translate the lack of any early optical excess into a quantitative limit, we adopted the analytic shock–cooling scalings for compact, H/He-poor envelopes derived from Rabinak & Waxman (2011, their Eq. (15)), where the luminosity is given by
 (1)
(1)
Here E51 = EK/1051 erg, R*, 13 = R★/1013 cm, fρ encodes the outer density profile (we adopted fρ = 0.1, appropriate for compact WR-like envelopes; see Appendix A of Calzavara & Matzner 2004), κ0.34 ≡ κ/0.34 cm2 g−1, and t5 ≡ t/105 s. Solving for R★ and using our explosion parameters from the spectral synthesis analysis (EK = 17 × 1051 erg ⇒ E51 = 17; Mej = 3.5 M⊙) with the first ZTF point at t = 1.13 days and log10L ≃ 42.000, we obtain for κ = 0.07 an R★ ≲ 0.6 R⊙. Alternatively, adopting κ = 0.20 yields R★ ≲ 1.4 R⊙, while κ = 0.34 gives R★ ≲ 2.1 R⊙. At the second epoch (t = 2.07 days, log10L ≃ 42.262), the corresponding limits are R★ ≲ 1.3 R⊙ for κ = 0.07 and R★ ≲ 4.8 R⊙ for κ = 0.34.
If we instead require the shock–cooling contribution to be ≤30% of the measured luminosity to avoid producing a visible early bump (Piro & Nakar 2013; Nakar & Piro 2014), then the limits scale down linearly with L, tightening to R★ ≲ 0.2 − 0.6 R⊙ at +1.13 days and R★ ≲ 0.4 − 1.4 R⊙ at +2.07 days. Even allowing for uncertainties in κ or modest bolometric corrections, the data robustly favor a compact Wolf-Rayet (WR)-like progenitor with R★ well below a few R⊙, and disfavor any extended envelope that could produce an early optical excess. Finally, adopting the explosion parameters inferred from the bolometric light curve and observed spectra (E51 = 23.1 erg, and Mej = 3.2 M⊙; see Sect. 5.1.1) suggests even tighter constraints on R★.
5.3. Constraints from radio and X-ray observations
The optical data of SN 2020lao show no signatures of central-engine activity. The light curves lack any early excess seen in GRB- or XRF-associated SN Ic-BL events, for example SN 2006aj (Campana et al. 2006; Soderberg et al. 2006), SN 2017iuk, (Izzo et al. 2019), and SN 2020bvc (Izzo et al. 2020; Ho et al. 2020), and the spectra presented in Fig. 3 identify it as a high-velocity, energetic SN Ic-BL without an afterglow component.
Published Very Large Array observations of SN 2020lao yielded 3σ non-detections at +13 days (5.2 GHz; Fν ≲ 33 μJy) and +141 days (5.5 GHz; Fν ≲ 21 μJy; Corsi et al. 2023). These are among the faintest radio limits measured for SNe Ic-BL (Bietenholz et al. 2021) and effectively exclude relativistic ejecta similar to those in SN 1998bw (Kulkarni et al. 1998), unless the circumburst density was unusually low. For a distance of D = 132.7 Mpc, the observed limits correspond to luminosity limits of Lν ≲ 6.9 × 1026 and 4.4 × 1026 erg s−1 Hz−1 at 5.2 GHz and 5.5 GHz, respectively.
To interpret these radio limits in the context of the explosion dynamics, we computed synchrotron models (see Harris et al. 2023; Venkattu et al. 2024, for details of the modeling) based on explosion parameters inferred from the bolometric light curve (Ek ≃ 23.1 × 1051 erg, Mej ≃ 3.2 M⊙) an outer density profile characterized by a power-law index of n = 10, and a wind density profile (ρ ∝ r−2). For these parameters, the transition velocity separating the flat inner ejecta from the steep outer component occurs at ≈2.94 × 10⁴ km s−1. For a nominal WR-like wind with mass-loss rate Ṁ = 6.1 × 10⁻⁷ M⊙ yr−1 and wind velocity vw = 1000 km s−1 the shock propagates at roughly 0.57c at +13 days, substantially faster than the canonical 105 km s−1 often assumed for ordinary SE SNe. This high shock velocity places SN 2020lao in the regime illustrated in Fig. 6 of Chevalier & Fransson (2017), where radio emission rises and peaks on very short timescales and is entirely optically thin for t ≳ 7 − 8 days at 5 GHz (cf. Fig. 9). In comparison, SN 1998bw reached Lν ∼ 1029 erg s−1 Hz−1 at ∼11 days with shock speeds ≳c/3.
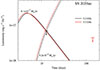 |
Fig. 9. Observed upper limits at 5.2 GHz (+13 days, black) and at 5.5 GHz (+141 days, red), together with modeled light curves for two mass-loss rates: Ṁ = 6.1 × 10⁻⁷ M⊙ yr−1 (solid lines) and Ṁ = 6.2 × 10⁻⁴ M⊙ yr−1 (dashed lines). |
Our synchrotron models adopt a WR-like composition for the wind (50% C and 50% O by mass), which yields slightly higher electron densities and marginally more efficient radio emission than cosmic abundances. The modeled 5.2 GHz and 5.5 GHz luminosities are shown in Fig. 9. In these models, we have also included free-free absorption in the unshocked, yet fully ionized, C and O-rich wind, assuming a wind temperature of 3 × 10⁴ K (see Lundqvist & Fransson 1988). Adopting Ṁ = 6.1 × 10⁻⁷ M⊙ yr−1 and vw = 1000 km s−1, the model predicts a peak (due to synchrotron self-absorption) at tpk ≃ 5 days with a 5.2 GHz luminosity of ≃2.2 × 1027 erg s−1 Hz−1. This is consistent with expectations from Fig. 6 of Chevalier & Fransson (2017). The model also matches the observed 13-day limit of Lν ≲ 6.9 × 1026 erg s−1 Hz−1 at 5.2 GHz. A caveat is that the high shock velocity at this epoch (≈0.57c) makes our nonrelativistic approach only marginally valid, but the qualitative conclusion remains robust: SN 2020lao would have produced a detectable radio signal at 13 days unless the external density were exceptionally low.
A complication is that for high mass-loss rates, free–free absorption from the wind starts to suppress early radio emission, so that the 13-day limit cannot rule out mass-loss rates Ṁ ≳ 6.2 × 10⁻⁴ M⊙ yr−1 (see Fig. 9). However, the late-time (141 day) limit at 5.5 GHz breaks this degeneracy: for Ṁ = 6.2 × 10⁻⁴ M⊙ yr−1 the model predicts a 5.5 GHz luminosity of Lν ≈ 1.3 × 1029 erg s−1 Hz−1 at 141 days, which is firmly excluded. Combining the two epochs therefore yields the constraint
 (2)
(2)
Swift X-Ray Telescope (XRT) observations at ∼14 days yielded no detection, with a flux limit of FX ≲ 2.9 × 10⁻¹⁴ erg s−1 cm−2 (LX ≲ 6 × 1040 erg s−1 at D = 131.8 Mpc; Corsi et al. 2023). This is consistent with expectations for ordinary core-collapse SNe (Dwarkadas 2025) and significantly fainter than the afterglows of classical, cosmological GRBs (Kann et al. 2011). Interpreted within the inverse-Compton framework for SE SNe interacting with a wind (e.g., Chevalier & Fransson 2006; Margutti et al. 2012), the X-ray non-detection implies a very low external density, consistent with the WR-like environment inferred from the radio limits, and supports the conclusion that SN 2020lao showed no detectable relativistic outflow or central-engine powered emission associated with canonical events such as SN 1998bw/GRB 980425 and SN 2006aj/XRF 060218.
More recently, fast X-ray transient SNe Ic BL identified by the Einstein Probe (EP) provide an additional comparison class for interpreting the multiwavelength limits of SN 2020lao. For example, the well-studied EP 250108a/SN 2025kg (Eyles-Ferris et al. 2025; Rastinejad et al. 2025; Srinivasaragavan et al. 2025a; Li et al. 2025) differs from SN 2020lao in exhibiting early optical excess emission and post-maximum spectroscopic signatures of circumstellar interaction. Despite these differences, and despite being identified through prompt X-ray emission, EP 250108a/SN 2025kg was not detected by Swift/XRT at approximately two days post explosion and showed no radio emission at any epoch, with MeerKAT 3.06 GHz limits at the level of about 24 μJy (3σ), corresponding to a luminosity limit of Lν ≲ 1.8 × 1028 erg s−1 Hz−1 at z = 0.176 (Srinivasaragavan et al. 2025a). The Swift/XRT upper limit for SN 2020lao at about 14 days post explosion, together with the deep radio non-detections at 13 and 141 days, are comparable in flux density to those reported for EP 250108a/AT 2025kg, while being more constraining in luminosity because of the much smaller distance, reaching Lν ≲ 1027 erg s−1 Hz−1. These comparisons show that although SN 2020lao lacked a luminous, long-lived afterglow characteristic of classical GRBs, its X-ray and radio limits overlap the regime occupied by weak or rapidly fading high-energy transients associated with some low-luminosity GRBs and fast X-ray transient SNe Ic BL, which may be powered by a combination of magnetar-driven energy injection and radioactive heating (e.g., Zhu et al. 2025; Srinivasaragavan et al. 2025b).
5.4. SN 2020lao in comparison with other SNe Ic-BL
Placing SN 2020lao in context with other SNe Ic-BL helps clarify its explosion properties and highlight where it fits within the broader parameter space of the class. Although the full set of comparison spectra is not shown here, we examined SN 2020lao alongside a wide sample of well-observed SNe Ic-BL. From these comparisons, we find that SN 2020lao most closely resembles SN 2006aj in its overall spectral morphology, but with markedly higher Doppler velocities. Inspection of Fig. 3 clearly reveals that the line profiles of the two events are similar in form, yet the absorption minima in SN 2020lao are significantly more blueshifted, indicating much more rapidly expanding ejecta. Consistent with this, the spectral-synthesis analysis in Sect. 5.1.2 demonstrates that SN 2020lao requires substantially larger values of EK and EK/Mej than SN 2006aj.
Figure 10 compares the absolute r-band light curve of SN 2020lao with those of SNe Ic-BL both with and without signatures of engine-driven activity. The sample includes events associated with high-energy emission or early optical excesses often interpreted as afterglow or cocoon emission (SNe 1998bw, 2006aj8 and 2020bvc), as well as SN 2020ayz, a rapidly discovered SN Ic-BL lacking such features. SN 2020lao shows no clear early excess, and its light-curve evolution is broadly consistent with that of other SNe Ic-BL, regardless of whether they exhibit early high-energy signatures.
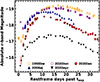 |
Fig. 10. Absolute r-band magnitude light curve of SN 2020lao compared with several well-studied SNe Ic BL. These include the R/r-band light curves of GRB980425/SN 1998bw ( |

For additional context, we compared SN 2020lao with the canonical GRB-associated SN 1998bw. Spectral-synthesis modeling of SN 1998bw, assuming spherical symmetry, yields Mej ≈ 8–10 M⊙ and EK ≈ (30–50)×1051 erg, corresponding to EK/Mej ∼ (3–6)×1051 erg M⊙−1. Although SN 1998bw was likely highly aspherical, whereas SN 2006aj exhibited much weaker asymmetry, these values nonetheless provide a useful benchmark. We note that this comparison refers to the bulk SN ejecta and should be distinguished from the isotropic-equivalent prompt gamma-ray energy of GRB 980425 (Eiso ∼ 8 × 1047 erg), which is orders of magnitude smaller and traces a physically distinct component of the explosion.
When compared to the EK/Mej distribution of SNe Ic-BL, SN 2020lao lies near the upper end, approaching the energetics of SN 1998bw while more closely resembling SN 2006aj in spectral morphology. Yet despite its high kinetic energy, it shows none of the usual signatures of engine-driven explosions: its early optical light curve lacks any excess attributable to afterglow or cocoon emission, and deep radio and X-ray limits rule out luminous relativistic ejecta. Taken together, these constraints indicate a low-density, WR-like environment and are strong evidence against a detectable cocoon breakout or relativistic afterglow emission components. Despite its unusually high specific kinetic energy, SN 2020lao falls among the radio- and X-ray-quiet SNe Ic-BL rather than the engine-driven events exemplified by SN 1998bw/GRB 980425. If a central engine was active and launched a jet, the observations require that it was either viewed far off-axis or choked before breakout. Alternatively, SN 2020lao may represent an extreme but nonrelativistic SN Ic-BL lacking sustained engine activity, though this would be somewhat surprising given its large high spectral line velocities.
6. Conclusion
We have presented an exceptional early-time optical dataset of the SN Ic-BL 2020lao, including optical photometry beginning within hours of the explosion along with a high-cadence spectroscopic time series beginning within ≈48 hours of the explosion and extending to nearly one hundred days later. The explosion epoch is well constrained thanks to continuous TESS coverage and complementary limits and detections from the ZTF and ATLAS public data streams.
The light curves of SN 2020lao show a rapid rise of ≈10 days and a peak absolute r-band magnitude of Mr ≃ −18.5, typical of SNe Ic-BL (e.g., Taddia et al. 2019). Its spectra resemble those of SN 2006aj but with systematically higher expansion velocities. Line-velocity measurements and Arnett-model fits, combined with an appropriate EK/Mej relation, yield a 56Ni mass of ∼0.23 ± 0.03 M⊙, Mej = 3.2 ± 0.8 M⊙, EK ∼ (23.1 ± 12.4)×1051 erg, and EK/Mej = (7.2 ± 3.5)×1051 erg  . Spectral synthesis with a scaled SN 2006aj density structure reproduces the overall photospheric-phase spectra and is consistent with the explosion parameters inferred from the light curve: Mej = 3.5 M⊙, EK ≈ 17 × 1051 erg, and EK/Mej ≈ 4.9 × 1051 erg
  .
.
Compared with analogous parameter estimates for SN 2006aj derived from similar spectral-synthesis modeling (Mazzali et al. 2006), SN 2020lao shows a comparable 56Ni mass of ∼0.2 M⊙ but an EK/Mej ratio that is a factor of ≳5 higher. Moreover, the EK/Mej values inferred for SN 2020lao are higher than those of SN Ic-BL events such as SNe 2006aj and 2020bvc, aligning it more closely with the energetics of GRB-associated SNe Ic-BL such as SN 1998bw.
All this taken together, SN 2020lao exemplifies an energetic SN Ic-BL, a property often associated with engine-driven explosions. Yet its early optical behavior, combined with deep radio and X-ray non-detections, provides no evidence of any of the afterglow emission that would be expected from such activity. This combination implies that, if a jet was launched, the event must have been viewed far off-axis or the jet was choked before breakout. An alternative possibility is that SN 2020lao represents an extreme but purely nonrelativistic SN Ic-BL without sustained central-engine activity. Systematic infant-phase follow-up, including sensitive radio to X-ray monitoring, polarimetry, and nebular spectroscopy to probe the ejecta geometry, will be essential for assessing how common such engine-quiet yet energetic SNe Ic-BL are and for distinguishing viewing-angle effects from intrinsic physical differences. In conclusion, SN 2020lao establishes a valuable empirical baseline that we hope will aid future efforts to separate the underlying SN emission in SNe Ic-BL from the additional components powered by central-engine activity in GRB- and XRF-associated events such as SN 2006aj.
Data availability
The spectra presented in this work are publicly available through the WISeREP repository (Yaron & Gal-Yam 2012) and can be downloaded from https://www.wiserep.org/object/14810. Broadband photometry of SN 2020lao are available at the CDS via https://cdsarc.cds.unistra.fr/viz-bin/cat/J/A+A/708/A305
Acknowledgments
We thank Morgan Fraser, Francisco Förster, Rasmus Handberg, and Simon Holmbo for insightful discussions and/or providing observational support to the NUTS2 programme. Support for the Aarhus supernova group comes from Independent Research Fund Denmark (IRFD; grant numbers 8021-00170B and 10.46540/2032-00022B), and by the Aarhus University Research Foundation Nova project (AUFF-E-2023-9-28). TJM is supported by the Grants-in-Aid for Scientific Research of the Japan Society for the Promotion of Science (JP24K00682, JP24H01824, JP21H04997, JP24H00002, JP24H00027, JP24K00668) and by the Australian Research Council (ARC) through the ARC’s Discovery Projects funding scheme (project DP240101786). L.G. acknowledges financial support from AGAUR, CSIC, MCIN and AEI 10.13039/501100011033 under projects PID2023-151307NB-I00, PIE 20215AT016, CEX2020-001058-M, ILINK23001, COOPB2304, and 2021-SGR-01270. NER, AP and GV acknowledge support from the PRIN-INAF 2022 “Shedding light on the nature of gap transients: from the observations to the models”. EP acknowledges financial support from INAF and kind hospitality at NAOJ, Mitaka, Tokyo. SM is funded by Leverhulme Trust grant RPG-2023-240. Partial funding enabling NUTS2 use of the Nordic Optical Telescope (NOT) comes from the Instrument Center for Danish Astrophysics (IDA). The NOT is owned in collaboration by the University of Turku and Aarhus University, and operated jointly by Aarhus University, the University of Turku and the University of Oslo, representing Denmark, Finland and Norway, and the University of Iceland at the Observatorio del Roque de los Muchachos, La Palma, Spain, of the Instituto de Astrofisica de Canarias. NOT observations were obtained under program ID P61-507 and P62-505. This work makes use of observations from the Las Cumbres Observatory Global Telescope network through OPTICON (PI Stritzinger, programme ID 2020A/031), and also from the GTC under programmes GTC52-20A and GTC69-20A. This research also makes use of Astropy, a community-developed core Python package for Astronomy (Astropy Collaboration 2018), as well as Photutils (Bradley et al. 2020).
References
- Anand, S., Barnes, J., Yang, S., et al. 2024, ApJ, 962, 68 [Google Scholar]
- Anderson, J., & King, I. R. 2000, PASP, 112, 1360 [NASA ADS] [CrossRef] [Google Scholar]
- Arnett, W. D. 1982, ApJ, 253, 785 [Google Scholar]
- Ashall, C., & Mazzali, P. A. 2020, MNRAS, 492, 5956 [Google Scholar]
- Ashall, C., Mazzali, P. A., Pian, E., et al. 2019, MNRAS, 487, 5824 [NASA ADS] [CrossRef] [Google Scholar]
- Astropy Collaboration (Price-Whelan, A. M., et al.) 2018, AJ, 156, 123 [Google Scholar]
- Bellm, E. C., Kulkarni, S. R., Graham, M. J., et al. 2019, PASP, 131, 018002 [Google Scholar]
- Ben-Ami, S., Gal-Yam, A., Filippenko, A. V., et al. 2012, ApJ, 760, L33 [NASA ADS] [CrossRef] [Google Scholar]
- Bietenholz, M. F., Bartel, N., Argo, M., et al. 2021, ApJ, 908, 75 [NASA ADS] [CrossRef] [Google Scholar]
- Bradley, L., Sipocz, B., Robitaille, T., et al. 2020, astropy/photutils: 1.0.0 [Google Scholar]
- Branch, D., Benetti, S., Kasen, D., et al. 2002, ApJ, 566, 1005 [NASA ADS] [CrossRef] [Google Scholar]
- Burke, J., Hiramatsu, D., Howell, D. A., et al. 2020, TNS, 2020–1666, 1 [Google Scholar]
- Calzavara, A. J., & Matzner, C. D. 2004, MNRAS, 351, 694 [Google Scholar]
- Campana, S., Mangano, V., Blustin, A. J., et al. 2006, Nature, 442, 1008 [NASA ADS] [CrossRef] [Google Scholar]
- Cano, Z. 2013, MNRAS, 434, 1098 [Google Scholar]
- Chambers, K. C., Magnier, E. A., Metcalfe, N., et al. 2016, ArXiv e-prints [arXiv:1612.05560] [Google Scholar]
- Chevalier, R. A., & Fransson, C. 2006, ApJ, 651, 381 [NASA ADS] [CrossRef] [Google Scholar]
- Chevalier, R. A., & Fransson, C. 2017, in Handbook of Supernovae, eds. A. W. Alsabti, & P. Murdin, 875 [Google Scholar]
- Chugai, N. N. 2000, Astron. Lett., 26, 797 [Google Scholar]
- Clocchiatti, A., Suntzeff, N. B., Covarrubias, R., & Candia, P. 2011, AJ, 141, 163 [NASA ADS] [CrossRef] [Google Scholar]
- Corsi, A., Ho, A. Y. Q., Cenko, S. B., et al. 2023, ApJ, 953, 179 [CrossRef] [Google Scholar]
- Cushing, M. C., Vacca, W. D., & Rayner, J. T. 2004, PASP, 116, 362 [NASA ADS] [CrossRef] [Google Scholar]
- Drout, M. R., Soderberg, A. M., Gal-Yam, A., et al. 2011, ApJ, 741, 97 [NASA ADS] [CrossRef] [Google Scholar]
- Dwarkadas, V. V. 2025, Universe, 11, 161 [Google Scholar]
- Eyles-Ferris, R. A. J., Jonker, P. G., Levan, A. J., et al. 2025, ApJ, 988, L14 [Google Scholar]
- Ferrero, P., Kann, D. A., Zeh, A., et al. 2006, A&A, 457, 857 [NASA ADS] [CrossRef] [EDP Sciences] [Google Scholar]
- Finneran, G., Cotter, L., & Martin-Carrillo, A. 2025, A&A, 700, A200 [NASA ADS] [CrossRef] [EDP Sciences] [Google Scholar]
- Fitzpatrick, E. L. 1999, PASP, 111, 63 [Google Scholar]
- Forster, F., Bauer, F. E., Galbany, L., et al. 2020, TNS, 2020–1550, 1 [Google Scholar]
- Fukugita, M., Ichikawa, T., Gunn, J. E., et al. 1996, AJ, 111, 1748 [Google Scholar]
- Galama, T. J., Vreeswijk, P. M., van Paradijs, J., et al. 1998, Nature, 395, 670 [Google Scholar]
- Galbany, L., Gutiérrez, C. P., Piscarreta, L., et al. 2025, JCAP, 2025, 053 [Google Scholar]
- Hamuy, M., Folatelli, G., Morrell, N. I., et al. 2006, PASP, 118, 2 [NASA ADS] [CrossRef] [Google Scholar]
- Harris, C. E., Sarbadhicary, S. K., Chomiuk, L., et al. 2023, ApJ, 952, 24 [Google Scholar]
- Ho, A. Y. Q., Kulkarni, S. R., Perley, D. A., et al. 2020, ApJ, 902, 86 [NASA ADS] [CrossRef] [Google Scholar]
- Hsiao, E. Y., Phillips, M. M., Marion, G. H., et al. 2019, PASP, 131, 014002 [NASA ADS] [CrossRef] [Google Scholar]
- Irwin, C. M., Nakar, E., & Piran, T. 2019, MNRAS, 489, 2844 [NASA ADS] [CrossRef] [Google Scholar]
- Izzo, L., de Ugarte Postigo, A., Maeda, K., et al. 2019, Nature, 565, 324 [Google Scholar]
- Izzo, L., Auchettl, K., Hjorth, J., et al. 2020, A&A, 639, L11 [EDP Sciences] [Google Scholar]
- Johnson, B. D., Leja, J., Conroy, C., & Speagle, J. S. 2021, ApJS, 254, 22 [NASA ADS] [CrossRef] [Google Scholar]
- Jones, D. O., McGill, P., Manning, T. A., et al. 2024, ArXiv e-prints [arXiv:2410.17322] [Google Scholar]
- Kann, D. A., Klose, S., Zhang, B., et al. 2011, ApJ, 734, 96 [NASA ADS] [CrossRef] [Google Scholar]
- Komatsu, E., Dunkley, J., Nolta, M. R., et al. 2009, ApJS, 180, 330 [NASA ADS] [CrossRef] [Google Scholar]
- Kulkarni, S. R., Frail, D. A., Wieringa, M. H., et al. 1998, Nature, 395, 663 [NASA ADS] [CrossRef] [Google Scholar]
- Lazzati, D., Morsony, B. J., Blackwell, C. H., & Begelman, M. C. 2012, ApJ, 750, 68 [NASA ADS] [CrossRef] [Google Scholar]
- Leja, J., Carnall, A. C., Johnson, B. D., Conroy, C., & Speagle, J. S. 2019, ApJ, 876, 3 [Google Scholar]
- Li, W. X., Zhu, Z. P., Zou, X. Z., et al. 2025, ArXiv e-prints [arXiv:2504.17034] [Google Scholar]
- Lucy, L. B. 1999, A&A, 345, 211 [NASA ADS] [Google Scholar]
- Lundqvist, P., & Fransson, C. 1988, A&A, 192, 221 [NASA ADS] [Google Scholar]
- Lyman, J. D., Bersier, D., James, P. A., et al. 2016, MNRAS, 457, 328 [Google Scholar]
- MacFadyen, A. I., & Woosley, S. E. 1999, ApJ, 524, 262 [NASA ADS] [CrossRef] [Google Scholar]
- MacFadyen, A. I., Woosley, S. E., & Heger, A. 2001, ApJ, 550, 410 [NASA ADS] [CrossRef] [Google Scholar]
- Margutti, R., Soderberg, A. M., Chomiuk, L., et al. 2012, ApJ, 751, 134 [Google Scholar]
- Marzke, R. O., Huchra, J. P., & Geller, M. J. 1996, AJ, 112, 1803 [Google Scholar]
- Masci, F. J., Laher, R. R., Rusholme, B., et al. 2019, PASP, 131, 018003 [Google Scholar]
- Maund, J. R., Wheeler, J. C., Patat, F., et al. 2007, A&A, 475, L1 [NASA ADS] [CrossRef] [EDP Sciences] [Google Scholar]
- Mazzali, P. A. 2000, A&A, 363, 705 [NASA ADS] [Google Scholar]
- Mazzali, P. A., & Lucy, L. B. 1993, A&A, 279, 447 [NASA ADS] [Google Scholar]
- Mazzali, P. A., Kawabata, K. S., Maeda, K., et al. 2005, Science, 308, 1284 [Google Scholar]
- Mazzali, P. A., Deng, J., Nomoto, K., et al. 2006, Nature, 442, 1018 [NASA ADS] [CrossRef] [Google Scholar]
- Mazzali, P. A., McFadyen, A. I., Woosley, S. E., Pian, E., & Tanaka, M. 2014, MNRAS, 443, 67 [Google Scholar]
- Mazzali, P. A., Sauer, D. N., Pian, E., et al. 2017, MNRAS, 469, 2498 [NASA ADS] [CrossRef] [Google Scholar]
- Metzger, B. D., Margalit, B., Kasen, D., & Quataert, E. 2015, MNRAS, 454, 3311 [NASA ADS] [CrossRef] [Google Scholar]
- Modjaz, M., Liu, Y. Q., Bianco, F. B., & Graur, O. 2016, ApJ, 832, 108 [NASA ADS] [CrossRef] [Google Scholar]
- Modjaz, M., Gutiérrez, C. P., & Arcavi, I. 2019, Nat. Astron., 3, 717 [NASA ADS] [CrossRef] [Google Scholar]
- Mould, J. R., Huchra, J. P., Freedman, W. L., et al. 2000, ApJ, 529, 786 [Google Scholar]
- Nakar, E., & Piro, A. L. 2014, ApJ, 788, 193 [NASA ADS] [CrossRef] [Google Scholar]
- Nicholl, M. 2018, RNAAS, 2, 230 [Google Scholar]
- Patat, F., Cappellaro, E., Danziger, J., et al. 2001, ApJ, 555, 900 [Google Scholar]
- Pian, E., Mazzali, P. A., Masetti, N., et al. 2006, Nature, 442, 1011 [Google Scholar]
- Piran, T., Nakar, E., Mazzali, P., & Pian, E. 2019, ApJ, 871, L25 [NASA ADS] [CrossRef] [Google Scholar]
- Piro, A. L., & Morozova, V. S. 2019, ApJ, 871, L25 [NASA ADS] [CrossRef] [Google Scholar]
- Piro, A. L., & Nakar, E. 2013, ApJ, 769, 67 [NASA ADS] [CrossRef] [Google Scholar]
- Prentice, S. J., & Mazzali, P. A. 2017, MNRAS, 469, 2672 [Google Scholar]
- Prentice, S. J., Mazzali, P. A., Pian, E., et al. 2016, MNRAS, 458, 2973 [NASA ADS] [CrossRef] [Google Scholar]
- Rabinak, I., & Waxman, E. 2011, ApJ, 728, 63 [Google Scholar]
- Ramirez-Ruiz, E., Celotti, A., & Rees, M. J. 2002, MNRAS, 337, 1349 [Google Scholar]
- Rastinejad, J. C., Levan, A. J., Jonker, P. G., et al. 2025, ApJ, 988, L13 [Google Scholar]
- Rayner, J. T., Toomey, D. W., Onaka, P. M., et al. 2003, PASP, 115, 362 [NASA ADS] [CrossRef] [Google Scholar]
- Riess, A. G., Yuan, W., Macri, L. M., et al. 2022, ApJ, 934, L7 [NASA ADS] [CrossRef] [Google Scholar]
- Schlafly, E. F., & Finkbeiner, D. P. 2011, ApJ, 737, 103 [Google Scholar]
- Shahbandeh, M., Hsiao, E. Y., Ashall, C., et al. 2022, ApJ, 925, 175 [NASA ADS] [CrossRef] [Google Scholar]
- Shingles, L., Smith, K. W., Young, D. R., et al. 2021, TNS, 7, 1 [Google Scholar]
- Skrutskie, M. F., Cutri, R. M., Stiening, R., et al. 2006, AJ, 131, 1163 [NASA ADS] [CrossRef] [Google Scholar]
- Smith, K. W., Smartt, S. J., Young, D. R., et al. 2020, PASP, 132, 085002 [Google Scholar]
- Soderberg, A. M., Kulkarni, S. R., Nakar, E., et al. 2006, Nature, 442, 1014 [CrossRef] [Google Scholar]
- Sollerman, J., Jaunsen, A. O., Fynbo, J. P. U., et al. 2006, A&A, 454, 503 [NASA ADS] [CrossRef] [EDP Sciences] [Google Scholar]
- Sonbas, E., Moskvitin, A. S., Fatkhullin, T. A., et al. 2008, Astron. Bull., 63, 228 [Google Scholar]
- Srinivasaragavan, G. P., Hamidani, H., Schroeder, G., et al. 2025a, ApJ, 988, L60 [Google Scholar]
- Srinivasaragavan, G. P., Li, D., Hall, X. J., et al. 2025b, ArXiv e-prints [arXiv:2512.10239] [Google Scholar]
- Stritzinger, M. D., Taddia, F., Burns, C. R., et al. 2018, A&A, 609, A135 [NASA ADS] [CrossRef] [EDP Sciences] [Google Scholar]
- Suzuki, A., & Maeda, K. 2018, ApJ, 852, 88 [CrossRef] [Google Scholar]
- Taddia, F., Sollerman, J., Leloudas, G., et al. 2015, A&A, 574, A60 [NASA ADS] [CrossRef] [EDP Sciences] [Google Scholar]
- Taddia, F., Stritzinger, M. D., Bersten, M., et al. 2018, A&A, 609, A136 [NASA ADS] [CrossRef] [EDP Sciences] [Google Scholar]
- Taddia, F., Sollerman, J., Fremling, C., et al. 2019, A&A, 621, A71 [NASA ADS] [CrossRef] [EDP Sciences] [Google Scholar]
- Tanaka, M., Maeda, K., Mazzali, P. A., & Nomoto, K. 2007, ApJ, 668, L19 [Google Scholar]
- Taubenberger, S., Pastorello, A., Mazzali, P. A., et al. 2006, MNRAS, 371, 1459 [NASA ADS] [CrossRef] [Google Scholar]
- Tonry, J. L., Denneau, L., Flewelling, H., et al. 2018, ApJ, 867, 105 [NASA ADS] [CrossRef] [Google Scholar]
- Vallely, P. J., Kochanek, C. S., Stanek, K. Z., Fausnaugh, M., & Shappee, B. J. 2021, MNRAS, 500, 5639 [Google Scholar]
- Venkattu, D., Lundqvist, P., Pérez Torres, M., et al. 2024, ApJ, 976, 213 [Google Scholar]
- Wang, B., Leja, J., Bezanson, R., et al. 2023, ApJ, 944, L58 [NASA ADS] [CrossRef] [Google Scholar]
- Wheeler, J. C., Johnson, V., & Clocchiatti, A. 2015, MNRAS, 450, 1295 [Google Scholar]
- Williamson, M., Vogl, C., Modjaz, M., et al. 2023, ApJ, 944, L49 [NASA ADS] [CrossRef] [Google Scholar]
- Woosley, S. E. 1993, ApJ, 405, 273 [Google Scholar]
- Woosley, S. E. 2002, AIP Conf. Proc., 662, 185 [Google Scholar]
- Woosley, S. E., Heger, A., & Weaver, T. A. 2002, Rev. Mod. Phys., 74, 1015 [NASA ADS] [CrossRef] [Google Scholar]
- Wright, E. L., Eisenhardt, P. R. M., Mainzer, A. K., et al. 2010, AJ, 140, 1868 [Google Scholar]
- Yaron, O., & Gal-Yam, A. 2012, PASP, 124, 668 [Google Scholar]
- York, D. G., Adelman, J., Anderson, J. E., Jr, et al. 2000, AJ, 120, 1579 [Google Scholar]
- Zhu, J.-P., Zheng, J.-H., & Zhang, B. 2025, MNRAS, 544, L139 [Google Scholar]
Alfoscgui is a graphical user interface designed for extracting SN spectroscopy and photometry from data obtained with FOSC-like instruments. It was developed by E. Cappellaro. More information about the package is available at http://sngroup.oapd.inaf.it/foscgui.html
These data are available in electronic format on the Weizmann Interactive Supernova Data Repository (Yaron & Gal-Yam 2012).
The parameter vph in this relation is taken to be equivalent to −vabs(Fe II λ5160) at the time of Lmax.
SN 2006aj exhibits early excess emission primarily in bluer bands (Modjaz et al. 2019, and references therein).
Appendix A: Spectroscopic journal
Journal of spectroscopic observations.
All Tables
All Figures
|
Fig. 1. An r-band image from the NOT showing the position of SN 2020lao within its host galaxy, CGCG 169-041. |
| In the text | |
|
Fig. 2. Optical BgVri-band light curves of SN 2020lao, corrected for reddening and vertically offset by arbitrary constants for clarity. The previous ATLAS o-band non-detection limit (orange triangle), obtained −0.34 days prior to texp (vertical dashed line), is plotted alongside the r-band light curve. ZTF non-detection limits are included. Segments at the top mark the phases when optical (black) and NIR (red) spectroscopy were obtained (see Table A.1). |
| In the text | |
|
Fig. 3. Spectroscopic observations of SN 2020lao. Top: NIR +21.5 days spectrum of SN 2020lao. Left: selected optical spectra of SN 2020lao, corrected for MW reddening and overplotted with a smoothed version. Regions affected by three prevalent telluric features are indicated with vertical gray bands and labeled with Earth symbols. The locations of the absorption minima used to infer the expansion velocities plotted in Fig. 6 are marked with black dots, with red error bars indicating the wavelength ranges that define the associated uncertainties in the positions of maximum absorption. Right: comparison between similar epoch spectra of SN 2020lao and SN 2006aj (Pian et al. 2006; Sonbas et al. 2008). |
| In the text | |
|
Fig. 4. Top panel: binned TESS light curve adopting a bin size of two hours and plotted vs. phase relative to JD 2458900. Over-plotted is our best-fit power law. Bottom panel: 2D probability density of the MCMC sample between the fit parameters – time of explosion, texp, and power-law index, α. The contours correspond to 68% and 95% confidence intervals. The solid intersecting black lines indicate the mean of the MCMC sample for parameters |
| In the text | |
|
Fig. 5. MW reddening-corrected apparent colors of SN 2020lao (filled points) derived from Gaussian process interpolations of the observed light curves. Solid lines represent intrinsic SN Ic color-curve templates (Stritzinger et al. 2018), while open points show the corrected color curves after adjusting for the average offset between the apparent colors and the templates. The colors of SN 2020lao indicate that it experienced minimal host-galaxy reddening. |
| In the text | |
|
Fig. 6. Doppler velocity evolution as measured from the position of maximum absorption for Fe IIλ5169, Si IIλ6355, and Ca IIλ8567. |
| In the text | |
|
Fig. 7. Arnett (1982) model fit to the bolometric light curve of SN 2020lao constructed by integrating blackbody functions matched to the observed SEDs. Explosion parameters derived from the fit, with EK inferred from the EK/Mej relation of Wheeler et al. (2015), are provided. |
| In the text | |
|
Fig. 8. Synthetic spectra from a model with Mej = 3.5 M⊙ and EK = 17 × 1051 erg compared to observed spectra of SN 2020lao at +8.1 (top), +11.8 (middle), and +13.4 days (bottom) past explosion. |
| In the text | |
|
Fig. 9. Observed upper limits at 5.2 GHz (+13 days, black) and at 5.5 GHz (+141 days, red), together with modeled light curves for two mass-loss rates: Ṁ = 6.1 × 10⁻⁷ M⊙ yr−1 (solid lines) and Ṁ = 6.2 × 10⁻⁴ M⊙ yr−1 (dashed lines). |
| In the text | |
|
Fig. 10. Absolute r-band magnitude light curve of SN 2020lao compared with several well-studied SNe Ic BL. These include the R/r-band light curves of GRB980425/SN 1998bw ( |
| In the text | |
Current usage metrics show cumulative count of Article Views (full-text article views including HTML views, PDF and ePub downloads, according to the available data) and Abstracts Views on Vision4Press platform.
Data correspond to usage on the plateform after 2015. The current usage metrics is available 48-96 hours after online publication and is updated daily on week days.
Initial download of the metrics may take a while.