Fig. 2.
Download original image
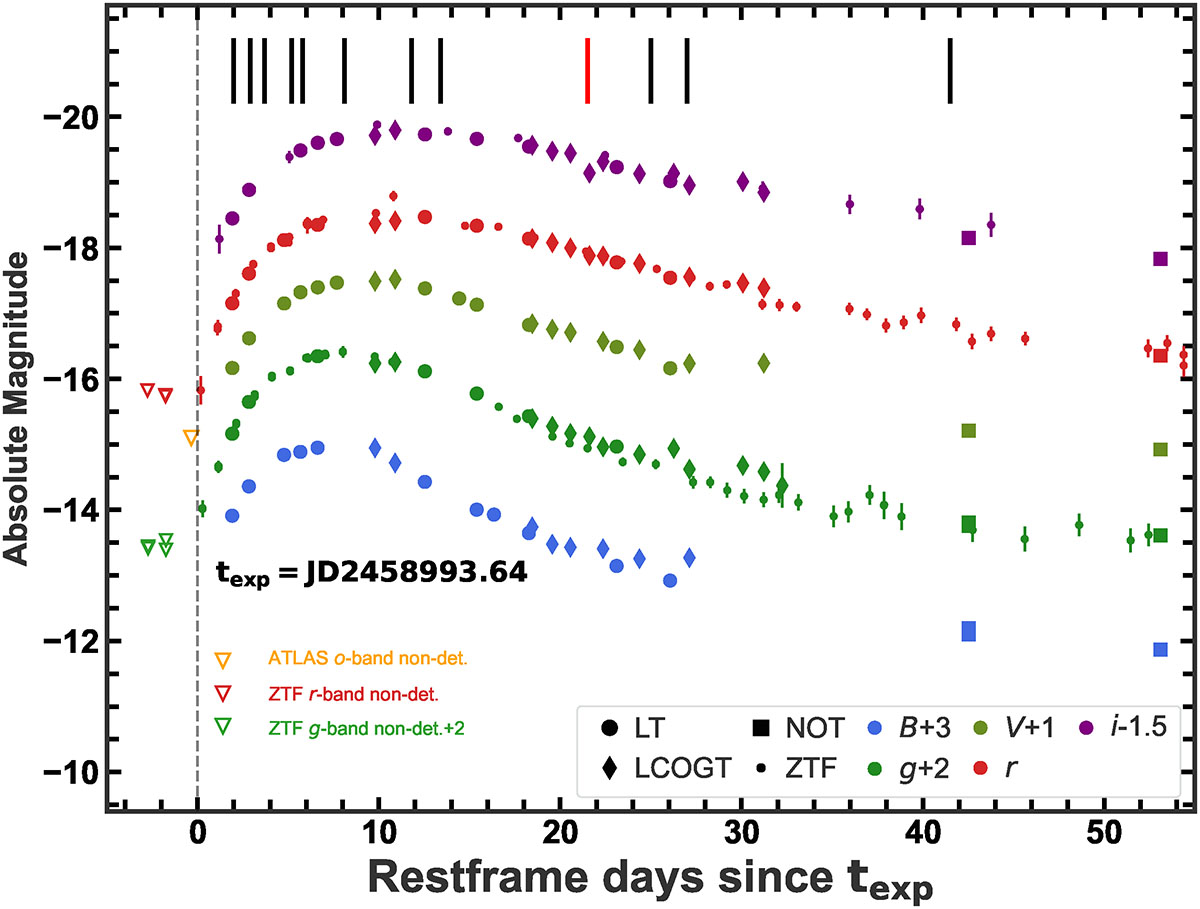
Optical BgVri-band light curves of SN 2020lao, corrected for reddening and vertically offset by arbitrary constants for clarity. The previous ATLAS o-band non-detection limit (orange triangle), obtained −0.34 days prior to texp (vertical dashed line), is plotted alongside the r-band light curve. ZTF non-detection limits are included. Segments at the top mark the phases when optical (black) and NIR (red) spectroscopy were obtained (see Table A.1).
Current usage metrics show cumulative count of Article Views (full-text article views including HTML views, PDF and ePub downloads, according to the available data) and Abstracts Views on Vision4Press platform.
Data correspond to usage on the plateform after 2015. The current usage metrics is available 48-96 hours after online publication and is updated daily on week days.
Initial download of the metrics may take a while.